

Bulk and single-cell transcriptome profiling reveal the metabolic heterogeneity in gastric cancer
- PMID: 37258571
- PMCID: PMC10232450
- DOI: 10.1038/s41598-023-35395-y
Bulk and single-cell transcriptome profiling reveal the metabolic heterogeneity in gastric cancer
Abstract
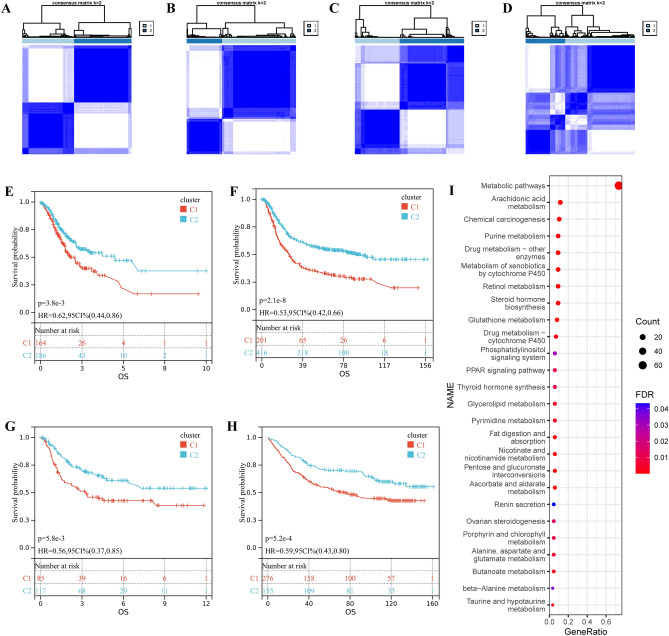
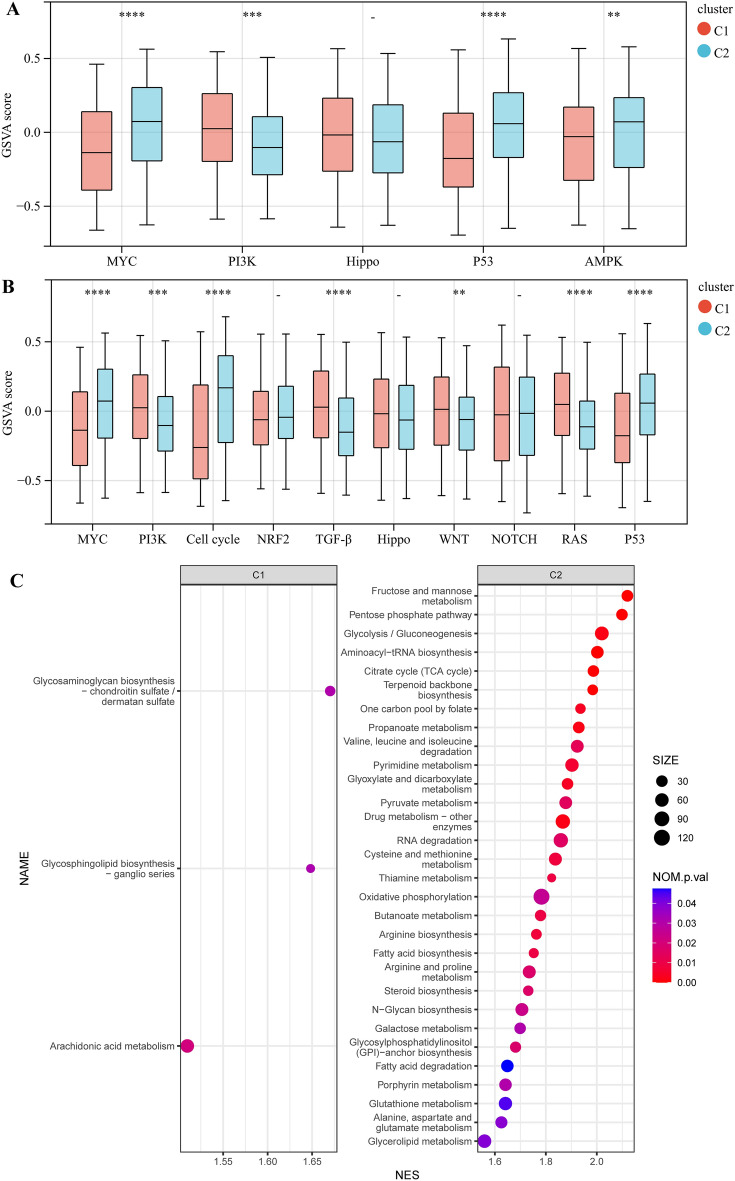
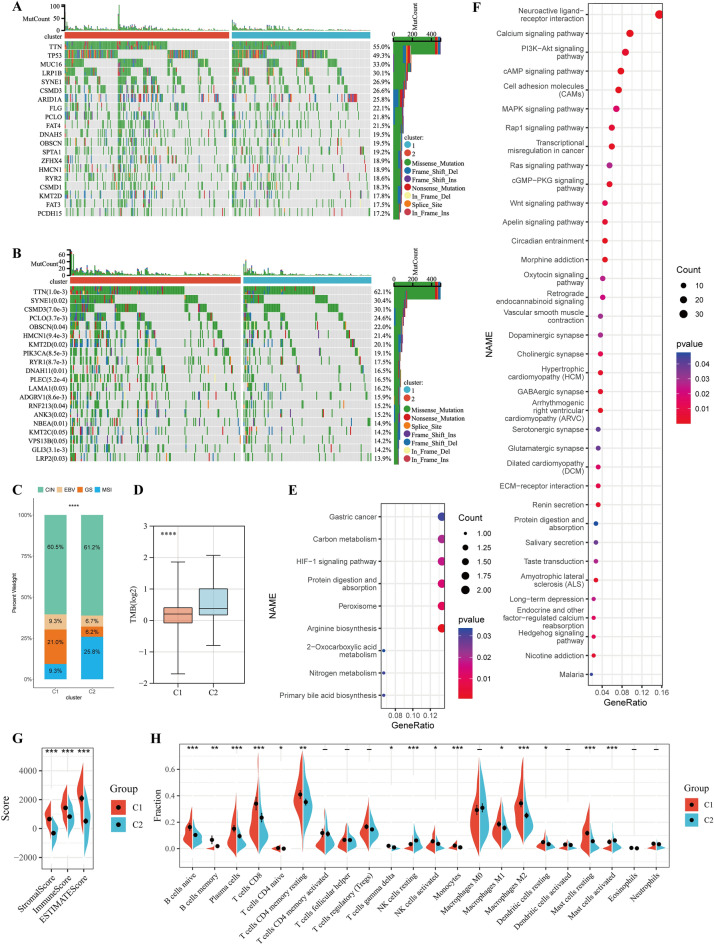
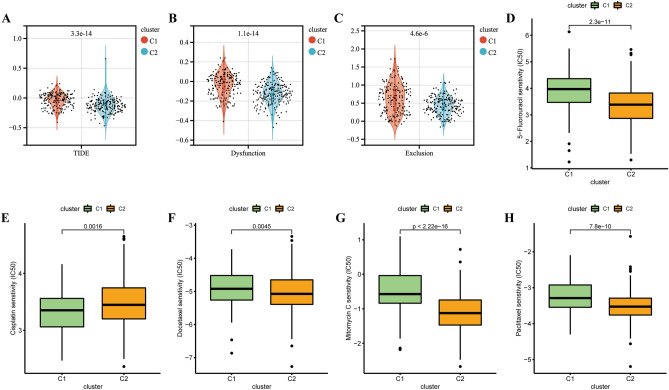
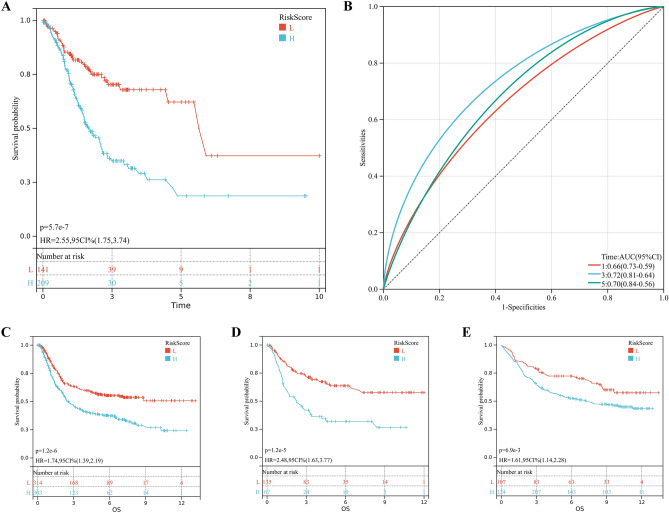
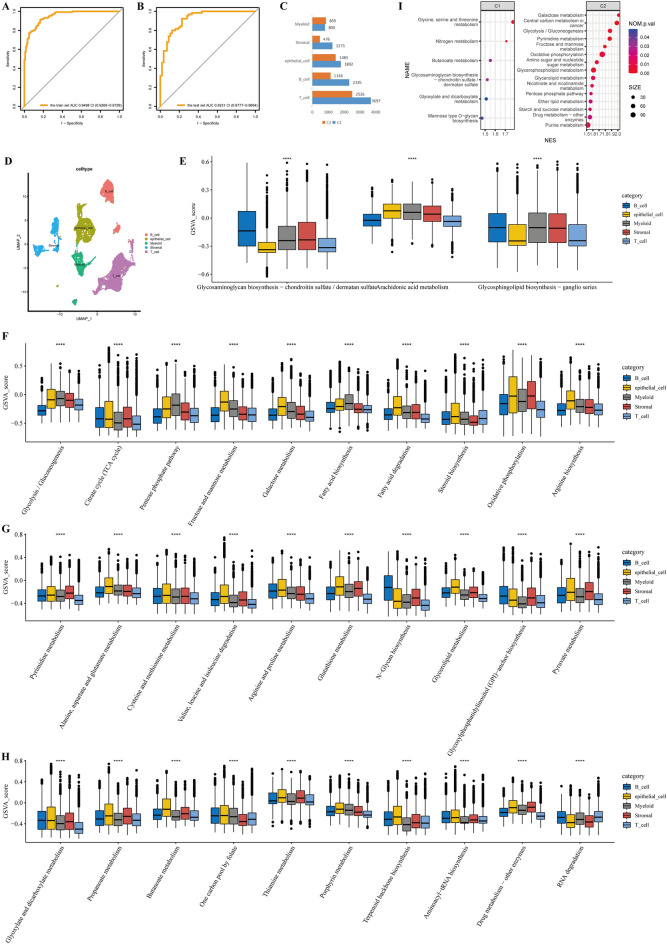
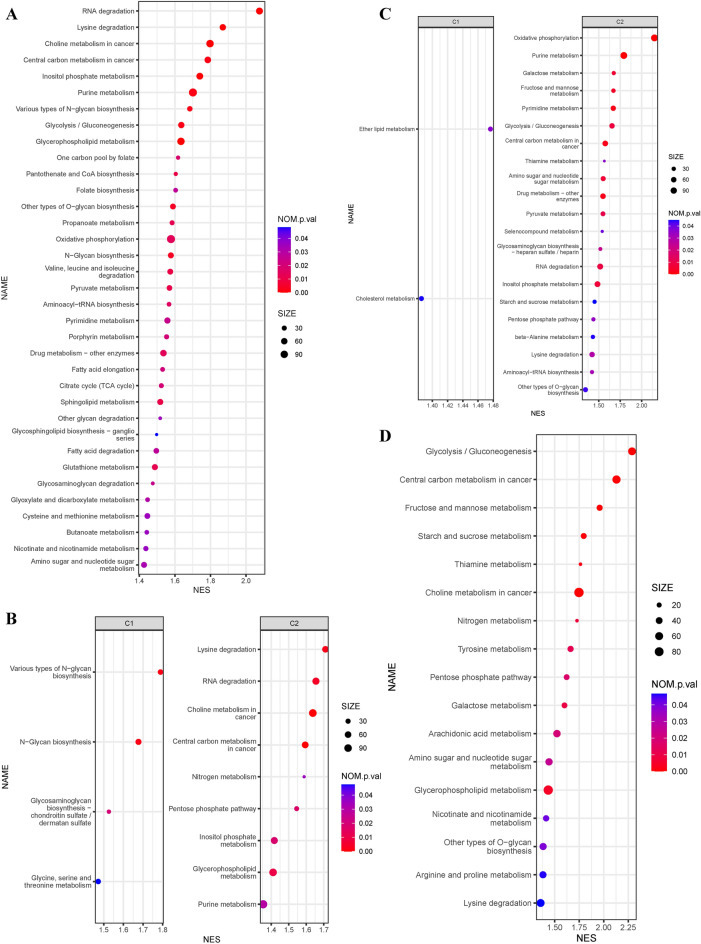
Metabolic reprogramming has been defined as a key hall mark of human tumors. However, metabolic heterogeneity in gastric cancer has not been elucidated. Here we separated the TCGA-STAD dataset into two metabolic subtypes. The differences between subtypes were elaborated in terms of transcriptomics, genomics, tumor-infiltrating cells, and single-cell resolution. We found that metabolic subtype 1 is predominantly characterized by low metabolism, high immune cell infiltration. Subtype 2 is mainly characterized by high metabolism and low immune cell infiltration. From single-cell resolution, we found that the high metabolism of subtype 2 is dominated by epithelial cells. Not only epithelial cells, but also various immune cells and stromal cells showed high metabolism in subtype 2 and low metabolism in subtype 1. Our study established a classification of gastric cancer metabolic subtypes and explored the differences between subtypes from multiple dimensions, especially the single-cell resolution.
© 2023. The Author(s).
Conflict of interest statement
The authors declare no competing interests.
Figures
Similar articles
-
Unveiling the heterogeneity and immunotherapy potency of tumor-associated neutrophils in the tumor microenvironment of gastric cancer.BMC Gastroenterol. 2025 Apr 28;25(1):303. doi: 10.1186/s12876-025-03920-0. BMC Gastroenterol. 2025. PMID: 40295944 Free PMC article.
-
Integration of transcriptomics, proteomics, and metabolomics data to reveal HER2-associated metabolic heterogeneity in gastric cancer with response to immunotherapy and neoadjuvant chemotherapy.Front Immunol. 2022 Aug 4;13:951137. doi: 10.3389/fimmu.2022.951137. eCollection 2022. Front Immunol. 2022. PMID: 35990657 Free PMC article.
-
Genomic analysis and clinical implications of immune cell infiltration in gastric cancer.Biosci Rep. 2020 May 29;40(5):BSR20193308. doi: 10.1042/BSR20193308. Biosci Rep. 2020. PMID: 32338286 Free PMC article.
-
Cancer biology deciphered by single-cell transcriptomic sequencing.Protein Cell. 2022 Mar;13(3):167-179. doi: 10.1007/s13238-021-00868-1. Epub 2021 Aug 17. Protein Cell. 2022. PMID: 34405376 Free PMC article. Review.
-
Dissection of gastric cancer heterogeneity for precision oncology.Cancer Sci. 2019 Nov;110(11):3405-3414. doi: 10.1111/cas.14191. Epub 2019 Sep 25. Cancer Sci. 2019. PMID: 31495054 Free PMC article. Review.
Cited by
-
Unraveling metabolic characteristics and clinical implications in gastric cancer through single-cell resolution analysis.Front Mol Biosci. 2024 May 20;11:1399679. doi: 10.3389/fmolb.2024.1399679. eCollection 2024. Front Mol Biosci. 2024. PMID: 38831933 Free PMC article.
-
Current development of molecular classifications of gastric cancer based on omics (Review).Int J Oncol. 2024 Sep;65(3):89. doi: 10.3892/ijo.2024.5677. Epub 2024 Aug 2. Int J Oncol. 2024. PMID: 39092559 Free PMC article. Review.
-
ECHDC2 inhibits the proliferation of gastric cancer cells by binding with NEDD4 to degrade MCCC2 and reduce aerobic glycolysis.Mol Med. 2024 May 23;30(1):69. doi: 10.1186/s10020-024-00832-9. Mol Med. 2024. PMID: 38783226 Free PMC article.
-
Dissecting gastric cancer heterogeneity and exploring therapeutic strategies using bulk and single-cell transcriptomic analysis and experimental validation of tumor microenvironment and metabolic interplay.Front Pharmacol. 2024 Jun 19;15:1355269. doi: 10.3389/fphar.2024.1355269. eCollection 2024. Front Pharmacol. 2024. PMID: 38962317 Free PMC article.
-
Recent Developments in Single-Cell Metabolomics by Mass Spectrometry─A Perspective.J Proteome Res. 2025 Apr 4;24(4):1493-1518. doi: 10.1021/acs.jproteome.4c00646. Epub 2024 Oct 22. J Proteome Res. 2025. PMID: 39437423 Free PMC article. Review.
References
MeSH terms
LinkOut - more resources
Full Text Sources
Medical
