. 2023 May 31;13(1):8867.
doi: 10.1038/s41598-023-35652-0.

Allantoic fluid metabolome reveals specific metabolic signatures in chicken lines different for their muscle glycogen content

Affiliations

Allantoic fluid metabolome reveals specific metabolic signatures in chicken lines different for their muscle glycogen content

Angélique Petit et al. Sci Rep. .

Abstract

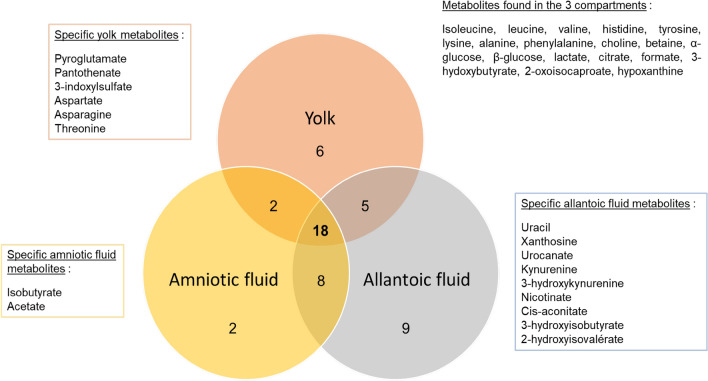
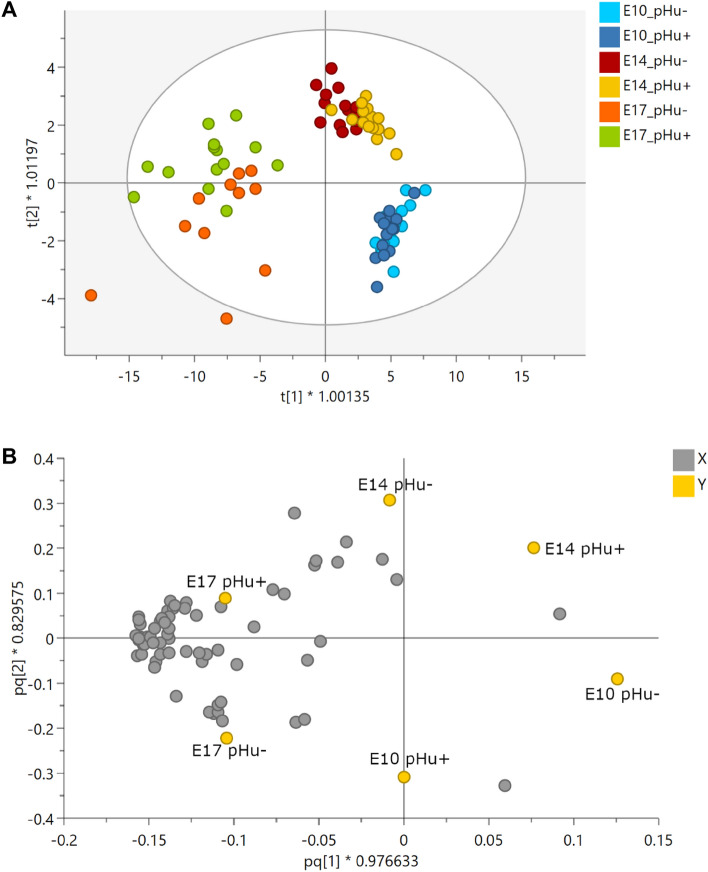
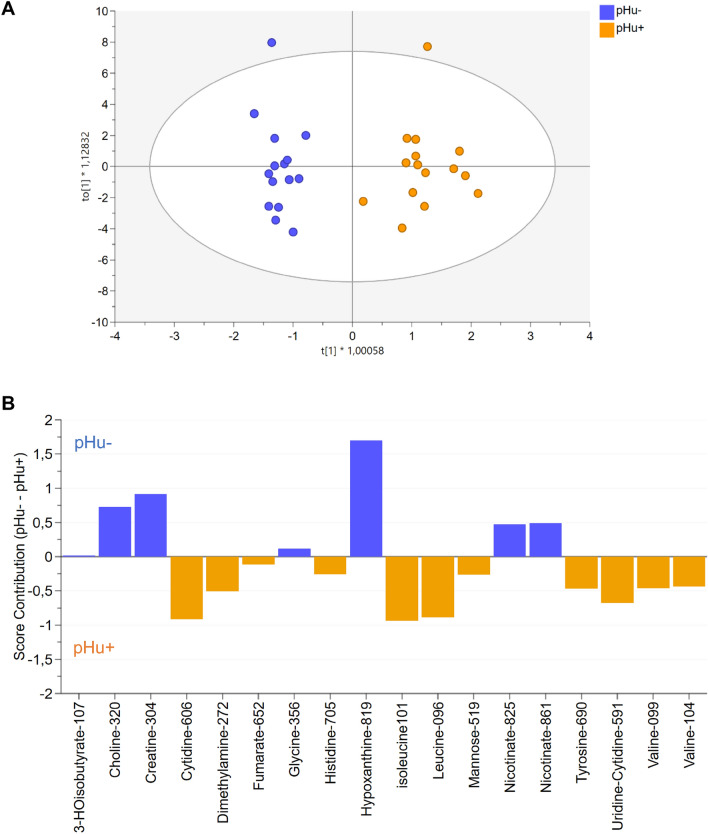
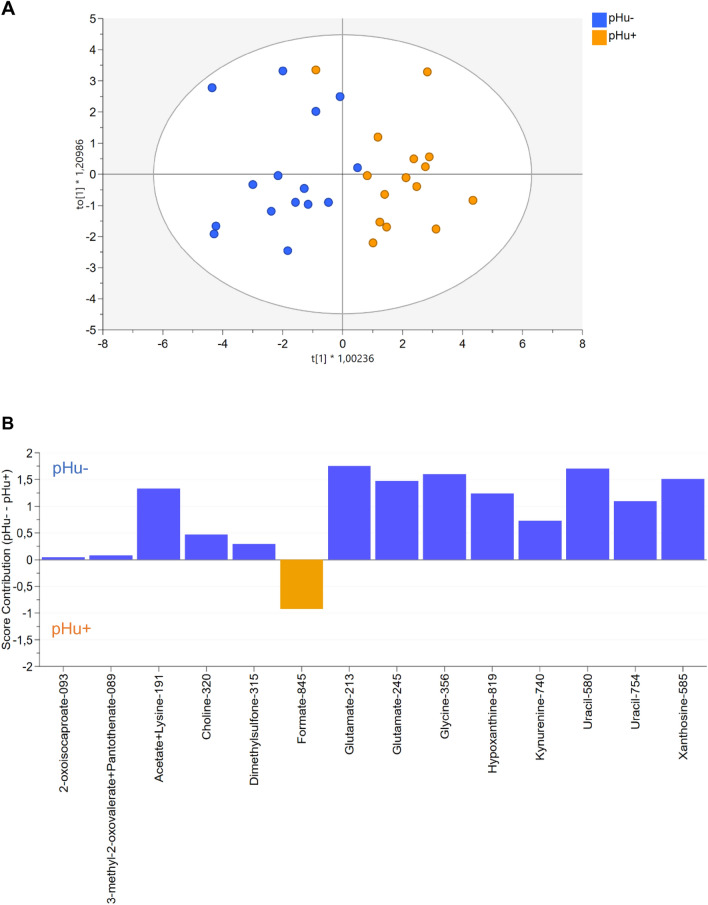
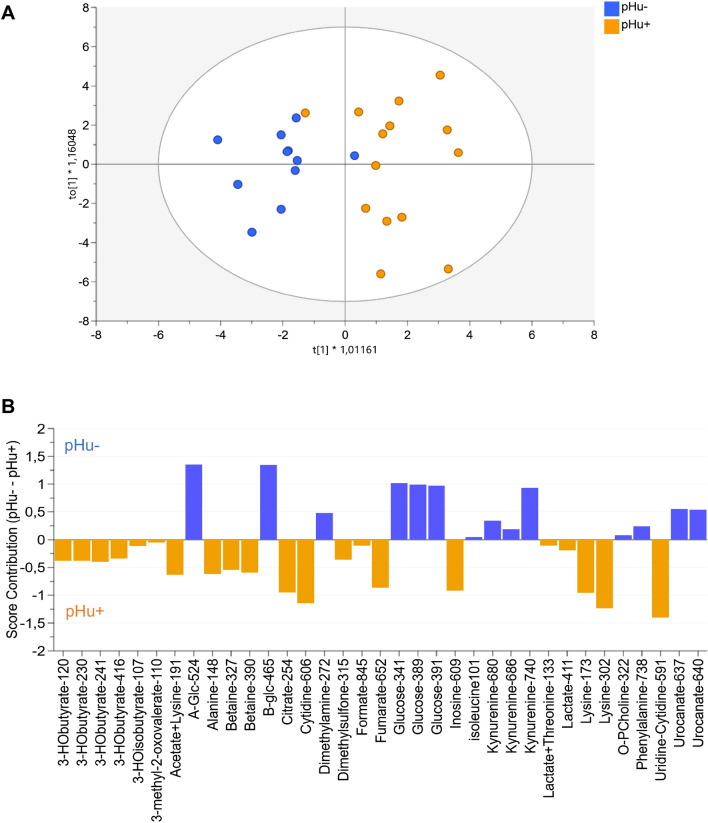
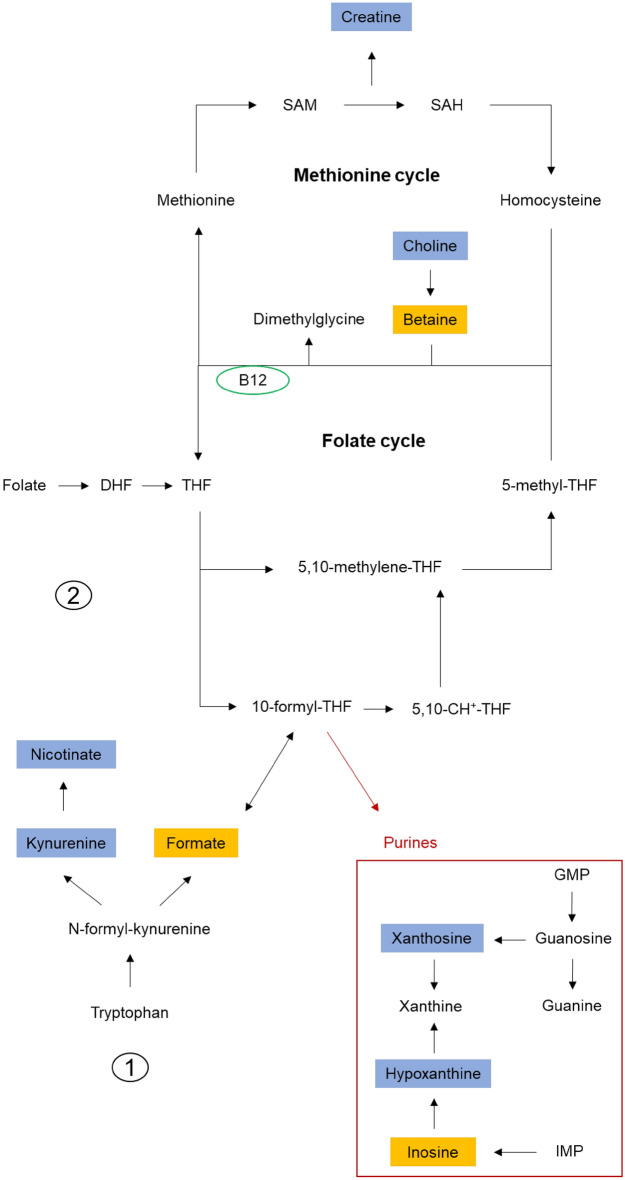
Nutrient availability in eggs can affect early metabolic orientation in birds. In chickens divergently selected on the Pectoralis major ultimate pH, a proxy for muscle glycogen stores, characterization of the yolk and amniotic fluid revealed a different nutritional environment. The present study aimed to assess indicators of embryo metabolism in pHu lines (pHu+ and pHu-) using allantoic fluids (compartment storing nitrogenous waste products and metabolites), collected at days 10, 14 and 17 of embryogenesis and characterized by 1H-NMR spectroscopy. Analysis of metabolic profiles revealed a significant stage effect, with an enrichment in metabolites at the end of incubation, and an increase in interindividual variability during development. OPLS-DA analysis discriminated the two lines. The allantoic fluid of pHu- was richer in carbohydrates, intermediates of purine metabolism and derivatives of tryptophan-histidine metabolism, while formate, branched-chain amino acids, Krebs cycle intermediates and metabolites from different catabolic pathways were more abundant in pHu+. In conclusion, the characterization of the main nutrient sources for embryos and now allantoic fluids provided an overview of the in ovo nutritional environment of pHu lines. Moreover, this study revealed the establishment, as early as day 10 of embryo development, of specific metabolic signatures in the allantoic fluid of pHu+ and pHu- lines.


Conflict of interest statement

The authors declare no competing interests.

Figures

Figure 1
Figure 1
Venn diagram representing metabolites present in allantoic fluid (present study), yolk and amniotic fluid. It compiles metabolites analyzed on the 10th day of incubation (E10) in the amniotic fluid, E0 (before incubation) and E10 in the yolk, and E10, E14 and E17 in the allantoic fluid. Metabolic profile analysis identified 31 metabolites in yolk, 30 in amniotic fluid and 40 in allantoic fluid referenced in the databases. Of the 40 metabolites identified in the allantoic fluid, 18 were common to all 3 compartments, 5 were present in both yolk and allantoic fluid, and 8 were present in both amniotic fluid and allantoic fluid. Specific metabolites of the yolk (n = 6), amniotic fluid (n = 2) and allantoic fluid (n = 9) are specified in the colored boxes (in orange, yellow and gray, respectively).
Figure 2
Figure 2
OPLS-DA score (A) and loading plot (B) based on the 1H-NMR spectra of allantoic fluid samples from pHu+ and pHu− lines on days 10, 14 and 17 of incubation. The OPLS-DA score plot revealed clustering of samples by embryonic stage (n = 15 per line and per stage). R2Y = 0.50, Q2 = 0.39 and CV-ANOVA = 5.6e-11. The OPLS-DA loading plot represents the correlation structure of the metabolomic variables (X, gray circle) with the stage and line variables (Y, yellow circle). The loading plot revealed that most metabolites are highly correlated with the 17th day of incubation.
Figure 3
Figure 3
OPLS-DA score plot based on the 1H-NMR spectra of allantoic fluid samples from pHu+ and pHu− lines (n = 15) on the 10th day of incubation (A). The OPLS-DA contribution plot indicates the contribution of discriminating variables in each line. Variables with positive contributions (blue bars) correspond to metabolites more abundant in pHu− line (e.g., choline, creatine). Variables with negative contributions (orange bars) correspond to metabolites more abundant in pHu+ line (e.g., cytidine, leucine). Variables with a strong contribution such as hypoxanthine in pHu− or isoleucine in pHu+ correspond to the most discriminating metabolites between the two lines. Metabolites were referenced by their names, followed by their chemical shift multiplied by 100 (B). R2Y = 0.92, Q2 = 0.81, CV-ANOVA = 5.1e-05 and X = 18.
Figure 4
Figure 4
OPLS-DA score plot based on the 1H-NMR spectra of allantoic fluid samples 4from pHu+ and pHu− lines (n = 15) on the 14th day of incubation (A). OPLS-DA contribution plot indicating the contribution of discriminating variables in each line. Variables with positive contributions (blue bars) correspond to metabolites more abundant in pHu− line (e.g., hypoxanthine, uracil). Variables with negative contributions (orange bars) correspond to metabolites more abundant in pHu+ line (e.g., formate). Variables with a strong contribution such as glutamate in pHu− correspond to the most discriminating metabolites between the two lines. Metabolites were referenced by their name, followed by their chemical shift multiplied by 100 (B). R2Y = 0.68, Q2 = 0.56, CV-ANOVA = 0.00027 and X = 14.
Figure 5
Figure 5
OPLS-DA score plot based on the 1H-NMR spectra of allantoic fluid samples from pHu+ and pHu− lines (n = 15) on the 17th day of incubation (A). OPLS-DA contribution plot indicating the contribution of discriminating variables in each line. Variables with positive contributions (blue bars) correspond to metabolites more abundant in pHu− line (e.g., glucose, kynurenine). Variables with negative contributions (orange bars) correspond to metabolites more abundant in pHu+ line (e.g., betaine, citrate). Variables with a strong contribution such as alpha-glucose in pHu− or lysine in pHu+ correspond to the most discriminating metabolites between the two lines. Metabolites were referenced by their name, followed by their chemical shift multiplied by 100 (B). R2Y = 0.70, Q2 = 0.55, CV-ANOVA = 0.0022 and X = 35.
Figure 6
Figure 6
Representation of the folate and methionine cycles and the involvement of formate in one-carbon metabolism. In orange, the metabolites are more abundant in the allantoic fluid of pHu+, and in blue, the metabolites are more abundant in pHu−. 1 = Formate production through the folate-independent pathway and 2 = Formate production through the folate-dependent pathway. SAM: S-adenosylmethionine, SAH: S-adenosylhomocysteine, DHF: Dihydrofolate, THF: Tetrahydrofolate, 5,10-CH+-THF: 5,10-methenyl-tetrahydrofolate, B12: Vitamin B12, IMP: Inosine monophosphate, GMP: Guanosine monophosphate. Figure adapted from Brosnan and Brosnan, Bozack et al., and Baroukh et al..

References

    1. Givisiez PEN, Moreira Filho ALB, Santos MRB, Oliveira HB, Ferket PR, Oliveira CJB, Malheiros RD. Chicken embryo development: metabolic and morphological basis for in ovo feeding technology. Poult. Sci. 2020;99:6774–6782. doi: 10.1016/j.psj.2020.09.074. - DOI - PMC - PubMed
    1. Moran JR, Edwin T. Nutrition of the developing embryo and hatchling. Poult. Sci. 2007;86:1043–1049. doi: 10.1093/ps/86.5.1043. - DOI - PubMed
    1. Nasir Z, Peebles ED. Symposium: avian embryo nutrition and incubation. Poult. Sci. 2018;97:2994–2995. doi: 10.3382/ps/pey137. - DOI - PubMed
    1. Le Bihan-Duval E, Debut M, Berri CM, Sellier N, Santé-Lhoutellier V, Jégo Y, et al. Chicken meat quality: genetic variability and relationship with growth and muscle characteristics. BMC Genet. 2008;9:53. doi: 10.1186/1471-2156-9-53. - DOI - PMC - PubMed
    1. Beauclercq S, Nadal-Desbarats L, Hennequet-Antier C, Collin A, Tesseraud S, Bourin M, et al. Serum and muscle metabolomics for the prediction of ultimate pH, a key factor for chicken-meat quality. J. Proteome Res. 2016;15:1168–1178. doi: 10.1021/acs.jproteome.5b01050. - DOI - PubMed

Publication types