. 2023 Jun;618(7964):383-393.
doi: 10.1038/s41586-023-06102-8. Epub 2023 May 31.

Deterministic evolution and stringent selection during preneoplasia

Affiliations

Deterministic evolution and stringent selection during preneoplasia

Kasper Karlsson et al. Nature. 2023 Jun.

Abstract

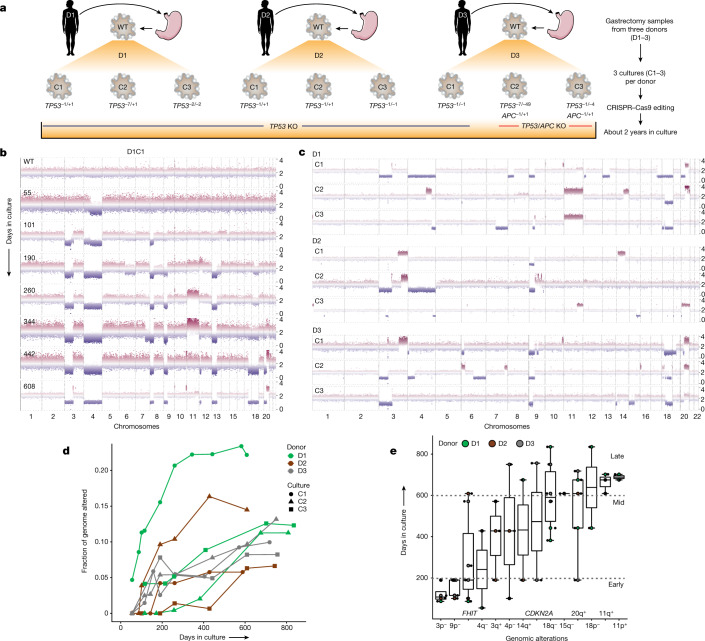
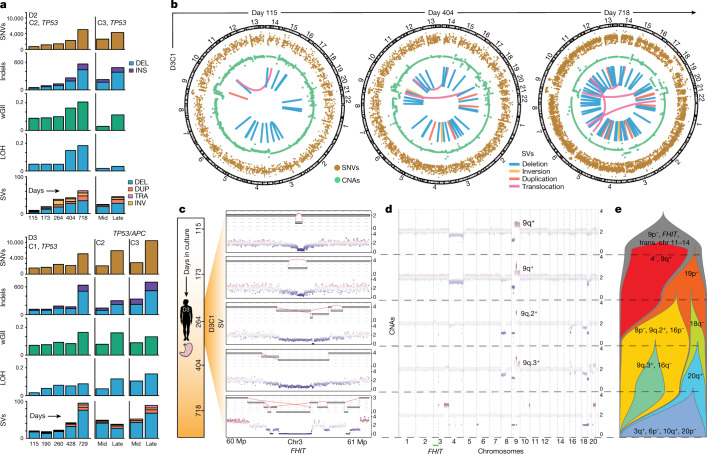
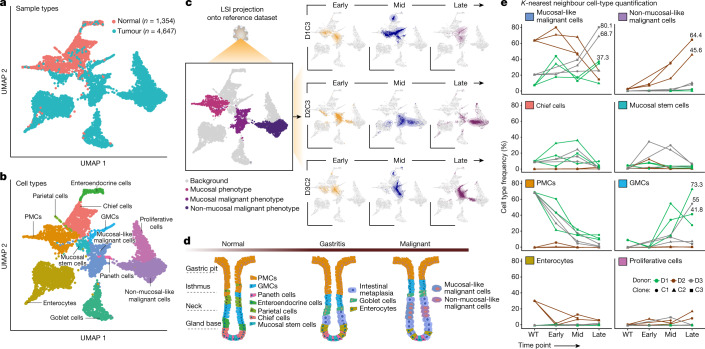
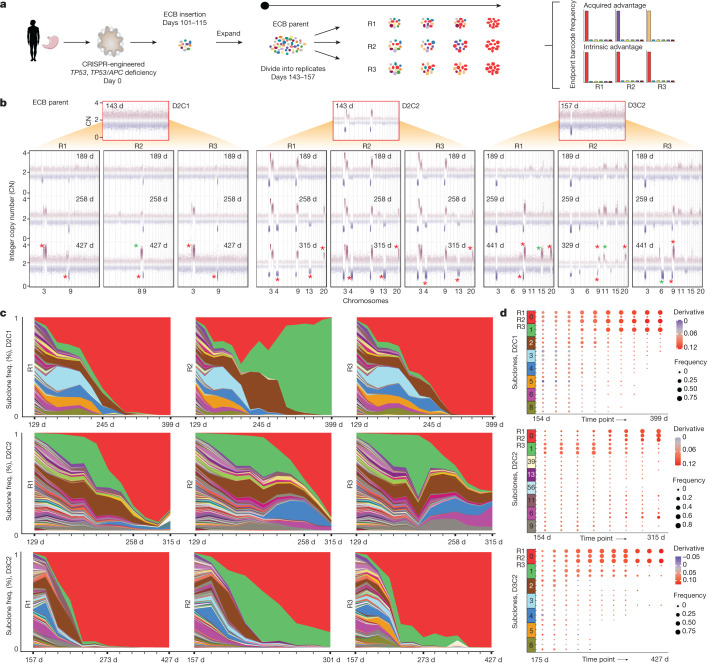
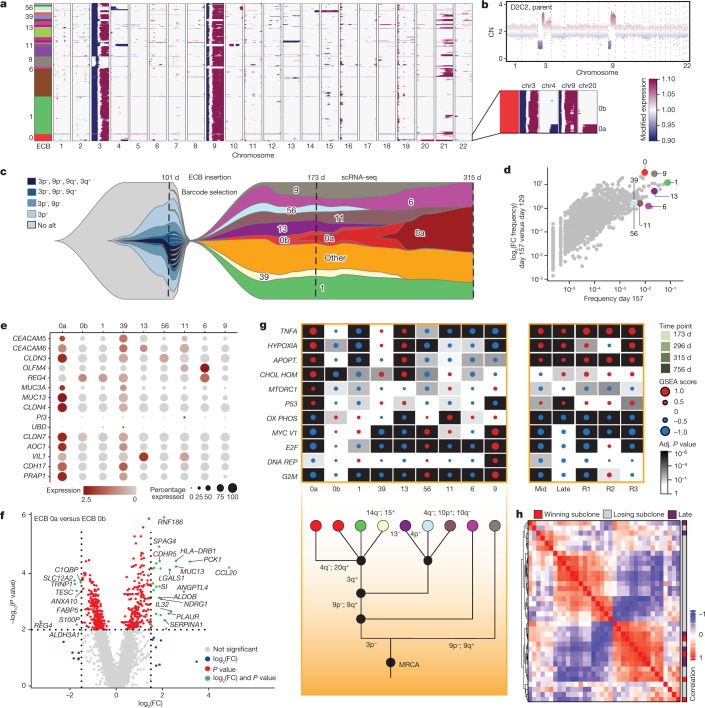
The earliest events during human tumour initiation, although poorly characterized, may hold clues to malignancy detection and prevention1. Here we model occult preneoplasia by biallelic inactivation of TP53, a common early event in gastric cancer, in human gastric organoids. Causal relationships between this initiating genetic lesion and resulting phenotypes were established using experimental evolution in multiple clonally derived cultures over 2 years. TP53 loss elicited progressive aneuploidy, including copy number alterations and structural variants prevalent in gastric cancers, with evident preferred orders. Longitudinal single-cell sequencing of TP53-deficient gastric organoids similarly indicates progression towards malignant transcriptional programmes. Moreover, high-throughput lineage tracing with expressed cellular barcodes demonstrates reproducible dynamics whereby initially rare subclones with shared transcriptional programmes repeatedly attain clonal dominance. This powerful platform for experimental evolution exposes stringent selection, clonal interference and a marked degree of phenotypic convergence in premalignant epithelial organoids. These data imply predictability in the earliest stages of tumorigenesis and show evolutionary constraints and barriers to malignant transformation, with implications for earlier detection and interception of aggressive, genome-instable tumours.


Conflict of interest statement

Unrelated to this study, C.J.K. is a founder and stockholder for Surrozen, Inc., Mozart Therapeutics and NextVivo, Inc. and C.C. is a stockholder in Illumina and DeepCell and an advisor to DeepCell, Genentech, Bristol Myers Squibb, 3T Biosciences, NanoString and ResistanceBio. The remaining authors declare no competing interests.

Figures

Fig. 1
Fig. 1. TP53 deficiency in HGOs induces aneuploidy and GC-associated CNAs along a defined temporal order.
a, Schematic overview of HGO establishment and generation of TP53–/–, TP53–/– and APC–/– cultures via CRISPR–Cas9 editing (Methods). b, Genome-wide CNA profiles of D1C1 at multiple time points assessed by sWGS. Normalized read counts across 50 kb genomic windows for each time point. c, CNA profiles for the nine organoid cultures sampled between days 588 and 835. d, FGA over time for each culture. e, Time of appearance (days in culture) of persistent arm-level CNAs (or alterations in FHIT and CDKN2A) in TP53/APC-deficient organoids (alterations that became extinct were not considered). The prevalence of these alterations in GC is summarized in Extended Data Fig. 2a,b. Boxes show interquartile range (IQR), centre lines represent the median and whiskers extend by 1.5× IQR. Sample size per aberration (n): 3p (4), 9p (7), FHIT (7), 4q (2), 3q+ (3), 4p (3), 14q+ (2), CDKN2A (2), 18q (6), 15q (2), 20q+ (5), 18p (2), 11q+ (3), 11p+ (2). KO, knockout. Image of stomach in a is from Servier Medical Art, CC BY 3.0. Source Data
Fig. 2
Fig. 2. TP53 deficiency elicits subclonal copy number evolution, SVs and clonal interference.
a, Burden of different classes of somatic genomic alterations in TP53–/– and TP53–/–, APC–/– HGOs (relative to WT over time), as assessed by longitudinal WGS of individual cultures at the specified time points (mid, day 296; late, days 743–756). b, Circos plots for D3C1 illustrating increasing genomic instability and complexity over time. Classes of alterations shown include SNVs (adjusted variant allele frequencies), CNAs (log(R)) and SV consensus calls (Methods). c, Evolution of rigma-like SVs at the FHIT fragile site on chr3p. Zoomed-in view of a 1 Mb region in the FHIT locus. Top, reconstructed SVs; bottom, corresponding CNAs. d, Longitudinal CNA profiles for D3C1. e, Fishplot schematic for D3C1 illustrating subclonal CNA evolution, clonal interference and extinction. Subclone frequencies (x axis) were determined based on CNAs visualized in d (Methods). DEL, deletion; DUP, duplication; INV, inversion; TRA, translocation. Image of stomach in c is from Servier Medical Art, CC BY 3.0. Source Data
Fig. 3
Fig. 3. Transcriptional deregulation in TP53-deficient gastric organoids.
a, Experimental overview of longitudinal scRNA-seq profiling of gastric organoid cultures. WT and replicate TP53–/– HGOs were sampled at multiple time points (early, about 100 days, orange; mid, about 320 days, blue; late, about 770 days, purple) and subjected to scRNA-seq. b, Dot-plot depicting estimated growth curve derivatives and growth fold change (FC) from previous time points for each culture over time (interpolated passage number). c, Uniform manifold approximation and projection (UMAP) visualizations coloured according to culture (left) and time point (right) for D1, depicting 13,984 cells. d, Dot-plot depicting the expression of selected marker genes for individual cultures and time points. Coloured bars highlight (1) marker genes associated with normal gastric and intestinal cell types, (2) genes upregulated in gene expression profiling interactive analysis (GEPIA) of GC and (3) others of functional relevance. PMCs, MUC5AC, TFF1, dark yellow; GMCs, MUC6, TFF2, light blue; proliferative cells, MKI67, purple; neck-like cells, PGC, LYZ, orange; mucosal stem cells, OLFM4, turquoise; enterocytes, FABP1, VIL1, olive; goblet cells, TFF3, WFDC2, MUC5B, CDX2, green; GEPIA top 12 genes, CEACAM5, CEACAM6, CLDN3, CLDN4, CLDN7, REG4, MUC3A, MUC13, PI3, UBD, AOC1, CDH17, black; other, TP53, APC, CDKN2A, FHIT, red. e, UpSet plot representing shared differentially up- (left) and downregulated genes (right) across donors and cultures (P < 0.05, Bonferroni corrected two-sided Wilcoxon rank-sum test). f, GSEA heatmap for MsigDB Hallmark gene sets showing pathways most significantly altered for each culture (Kolmogorov–Smirnov statistic, Benjamini–Hochberg adjusted, two-sided). GSEA score is indicated (dot size) and coloured according to the directionality of expression profiles (up, red; down, blue). Image of stomach in a is from Servier Medical Art, CC BY 3.0. Source Data
Fig. 4
Fig. 4. Unsupervised assessment indicates progression towards malignant transcriptional states.
a,b, UMAP embedding of 6,001 epithelial cells from the Sathe et al. gastric tumour–normal scRNA-seq dataset, coloured according to histology (a) and assigned cell type (b). Detected cell types included PMCs, GMCs, chief cells, parietal cells, enterocytes, enteroendocrine cells, goblet cells and proliferative cells, as well as two types of malignant cell (mucosal-like and non-mucosal-like). c, LSI projection of TP53–/– HGOs sampled at early (orange), mid (blue) and late (purple) time points onto the reference dataset (left), coloured by cellular phenotypes of interest, providing orientation for the LSI projection of the three HGO cultures at the specified time points (right). The density of projected cells is highlighted using two-dimensional density distribution. LSI, latent semantic index. d, Schematic representation of shifts in cell populations proposed to accompany the transition from normal tissue to gastritis and that can lead to intestinal metaplasia and malignancy, adapted from ref. . e, Projected cell type frequencies based on the 25 nearest neighbours in HGOs over time. Panel d created with BioRender.com.
Fig. 5
Fig. 5. Lineage tracing showing subclonal dynamics and deterministic outgrowth.
a, Overview of prospective lineage tracing studies in TP53–/– HGOs using ECBs. The ECB parental population was split into replicates, and individual cultures evolved in parallel and subject to longitudinal barcode sequencing, showing subclonal dynamics and assessment of intrinsic or acquired fitness advantages amongst replicate cultures. b, CNA profiles were assessed by sWGS before the introduction of the ECB in the parental line and across replicate ECB cultures at multiple time points. Red asterisks denote CNAs present in at least two replicates but not in the parental population; green asterisks denote CNAs unique to one replicate. Only chromosomes harbouring newly arisen CNAs (not present in the parental population) are numbered, for simplicity. c, Muller plots depicting ECB frequencies (assessed by barcode sequencing) over time, where each colour represents a distinct subclone in each replicate. Note that, for D3C2, R2 (D3C2R2), the barcode was lost around day 273. d, Dot-plots indicating ECB subclone frequency (indicated by size) and estimated growth curve derivative per subclone (indicated by colour). Image of stomach in a is from Servier Medical Art, CC BY 3.0. Source Data
Fig. 6
Fig. 6. Genotype-to-phenotype mapping defines molecular determinants of winning subclones.
a, Inferred CNA heatmap from scRNA-seq data for D2C2R2 at day 173, where each row represents a cell. Colour bar at the left indicates the ECB to which each cell maps. Numbered barcodes were selected for further investigation. Inset shows a subpopulation within ECB-0 with additional CNAs, termed 0a, and the ECB-0 parent subclone is termed 0b. b, CNA profile for the D2C2 parental population (also shown in Fig. 5b). c, Fishplot schematic illustrating the link between lineage (ECBs) and CNA subclones. To facilitate visualization, subclones of interest (denoted in a) are shown and the remainder grouped as ‘other’; all values are log transformed. d, Scatterplot comparing subclone frequency at day 157 and log2(FC) between days 129 and 157. All subclones are shown, with those of interest highlighted as in a. e, Dot-plot showing the expression of top DEGs based on GEPIA of gastric cancers. f, Volcano plot illustrating DEGs from comparison of the winning subclone 0a and its parental subclone 0b. Vertical and horizontal lines correspond to absolute log2(FC) values of 1.5 and P < 0.01 (two-sided Wilcoxon rank-sum test, not corrected for multiple testing), respectively. g, GSEA heatmap from MsigDB Hallmark gene sets showing the most significantly altered pathways (Kolmogorov–Smirnov statistic, Benjamini–Hochberg adjusted, two-sided) for specific subclones at day 173 (left) and later time points for the same culture (right). A manually reconstructed phylogeny is shown below. h, Pairwise Spearman correlation between samples based on GSEA score for the top ten most altered pathways for late relative to early time points and for subclones from multiple ECB replicate experiments. MRCA, most recent common ancestor. Source Data
Extended Data Fig. 1
Extended Data Fig. 1. Schematic overview of gastric organoid cultures, assays and sequencing time points.
Organoids were established from three donors (abbreviated D) as wild-type (WT) cultures. For each donor (D1-D3), three independent CRISPR/Cas9 edited TP53−/− or TP53−/−, APC−/− cultures (abbreviated C) were established (indicated by sg 1-3) and referred to as C1-C3 (Methods). The WT and genome edited cultures were evolved under defined conditions for over two years. Sequencing was performed across the experimental time course at defined intervals: Early (~0–200 days), Mid (~200–400 days), Late (~400–900 days). Each original culture was thawed (indicated by dashed lines) at an Early/Mid (190–290 days) and Late (540–730 days) time point for additional replication and comparisons. The thawed samples were treated with normocin to eliminate mycoplasma (Methods). All cultures were subject to shallow WGS (sWGS). A subset of cultures underwent deeper WGS and/or single cell RNA (scRNA)-sequencing at select time points. In addition to these non-barcoded cultures, representative TP53−/− HGO cultures from each donor were selected for prospective lineage tracing via transduction of a lentiviral expressed cellular barcode (ECB), as indicated by the multi-coloured circle in the legend. These ECB cultures were similarly subject to sWGS and scRNA-seq. Broad time intervals are indicated as in the legend, while days in culture are provided for individual cultures. Note that scRNA for D1C3 “Mid trajectory” was sampled at day 413.
Extended Data Fig. 2
Extended Data Fig. 2. Recurrent copy number aberrations in TP53-deficient gastric organoids are enriched in gastric and esophageal cancers.
a, Prevalence of somatic alterations and fraction genome altered in gastric cancer (stomach adenocarcinoma, STAD) from TCGA in all subgroups versus the CIN subgroup. Data derive from the cBioPortal. b, Frequency of chromosome arm alterations in TP53−/− HGOs (ORG) at late time points (days 588 to 835, as in Fig. 1c) relative to other tumour types: Stomach Adenocarcinoma (STAD), Esophageal carcinoma (ESCA), Colorectal Adenocarcinoma (COAD), Rectum Adenocarcinoma (READ), Breast invasive carcinoma (BRCA), Glioblastoma Multiforme (GBM), Pancreatic Adenocarcinoma (PAAD). TCGA data were obtained from Firehose (http://gdac.broadinstitute.org/#). c, Enrichment of chromosome arm-level alterations in TP53−/− gastric organoid cultures across cancer types. Boxes show inter-quartile range (IQR), center lines represent the median, whiskers extend by 1.5 × IQR. Arm-level CNAs altered in two or more TP53−/− gastric organoid cultures (n = 12 alterations) were more frequently altered than alterations present in 1 or fewer cultures (n = 66 alterations) in both STAD and ESCA (p-value shown, two-sided Wilcoxon rank sum test). d, The Jaccard Index (JI) was calculated by comparing CNAs that occurred in more than 1 chromosome arm in organoid cultures with CNAs occurring in 15% or more cases in a given tumour type. Permutation tests were performed to determine if the JI score was higher than expected by chance (i.e. one-sided test). For each tumour type, organoid CNA labels were randomly sampled (n = 10,000) from all possible chromosome arm-level events, and the JI was calculated. The empirical p-value was calculated as: P = 1-(sum(real JI > null JIs)/number of null JIs). Boxplot represents median, 0.25 and 0.75 quantiles with whiskers at 1.5 × IQR and includes the nominal p-values. e, Oncoplot shows alterations that occurred in two or more samples for genes commonly (>10% of cases) altered in gastro-esophageal cancer. Source Data
Extended Data Fig. 3
Extended Data Fig. 3. Longitudinal whole genome sequencing (WGS) of TP53−/− gastric organoids .
a, Overview of WGS and scRNA-seq time points for Early, Mid and Late cultures. Time is indicated in days (d). b, Summary of genomic features as assessed by WGS of multiple time points for Donors 2 and 3, expanding upon Fig. 2a. Mid and Late time points correspond to day 296 and 705–754, respectively. c, Distribution of non-clustered SVs, simple SVs (2–9 rearrangements) and complex SVs (10 or more rearrangements) defined using ClusterSV (Methods). d, Distribution of SV types across the three classes of SVs (non-clustered, clustered-simple and clustered-complex) e, Boxplot comparing total SV burden at the time of endoscopy (T1 and T2) for four Barrett’s esophagus biopsies per patient with cancer outcome (CO, n = 160) or noncancer outcome (NCO; n = 160) from the Paulson et al. cohort relative to the total SV burden between early (n = 4) and late (n = 9) timepoints in TP53−/− and TP53−/−, APC−/− HGOs (right). P-values were calculated using Wilcoxon rank sum test (two sided, unpaired). Boxes show IQR, center lines represent the median, whiskers extend by 1.5 × IQR.
Extended Data Fig. 4
Extended Data Fig. 4. TP53-deficient gastric organoids recapitulate complex structural variants (SVs) observed in gastric cancers.
a, Complex rigma-like SVs seen in gastric cancer (GC) patients such as pfg008 from the Wang et al. cohort (Methods) are similar to those in TP53−/− HGOs including D3C1 (also shown in Fig. 2e). b, Zoomed-in view of a region on chromosome 3 which evolved complex SVs during in vitro culture. c, Corresponding CNA profiles based on longitudinal WGS of D2C2 at 5 timepoints spanning days 115 to 729 in culture. d, Fishplot for D2C2 depicting CNA evolution inferred from WGS. e, IGV plots indicate the translocation between chromosomes 3 and 9 for D2C2, corresponding to the complex SV in panel b. Primers used for PCR amplification, gel electrophoresis purification and Sanger sequencing as marked in the plots f, BLAT results from Sanger sequencing of the PCR primers demonstrating partial alignment to chr3 and chr9. Image of stomach in d is from Servier Medical Art, CC BY 3.0. Source Data
Extended Data Fig. 5
Extended Data Fig. 5. Latent Semantic Index (LSI) projection of gastric organoids onto gastric tissue dataset.
a–b, UMAP visualizations coloured according to culture (left) and time point (right) for Donors 2 and 3 depicting 9,031 and 8,591 cells, respectively. c–d, Dotplot depicting the expression of selected marker genes for individual cultures and time points. Coloured bars highlight marker genes associated with normal gastric and intestinal cell types, genes up-regulated in the gene expression profiling interactive analysis (GEPIA) of GC, and others of functional relevance. Pit mucosal cells: MUC5AC, TFF1 – dark yellow; Gland mucosal cells: MUC6, TFF2 – light blue; Proliferative cells: MKI67 – purple; Neck-like cells: PGC, LYZ – orange; Mucosal stem cells: OLFM4 – turquoise; Enterocytes: FABP1, VIL1 – olive; Goblet cells: TFF3, WFDC2, MUC5B, CDX2 – green; GEPIA top 12 genes: CEACAM5, CEACAM6, CLDN3, CLDN4, CLDN7, REG4, MUC3A, MUC13, PI3, UBD, AOC1, CDH17 – black; Other: TP53, APC, CDKN2A, FHIT – red. e, The reference gastric tumour-normal dataset (Sathe et al.) for the LSI projection is shown with key cellular populations coloured according to their expression phenotype, as denoted in the legend. This panel is identical to that shown in Fig. 4c. f–h, Showing the LSI projection of individual cultures for donors 1, 2 and 3.
Extended Data Fig. 6
Extended Data Fig. 6. Subclone growth and frequency comparison and barcode trajectories for D1C1 and D2C3.
a, sWGS of the parental population (top) and three time points for D1C1 and D2C3, replicates 1-3. b, Muller plots of the ECB subclone frequency over time for the cultures shown in panel a reveals similar lineage dynamics across replicates and deterministic outgrowth. c, Barplot depicting frequencies of the top 10 subclones in the parental population and the winning subclone (which was not one of the top subclones in the parental population). All other subclones coloured gray. d, Pairwise Pearson correlation over time between replicate cultures for D1C1, D2C1, D2C2, D2C3 and D3C2. Time points correspond to passage times, where intervals between passages are approximately two weeks. Source Data
Extended Data Fig. 7
Extended Data Fig. 7. Linking single-cell genotypes to their transcriptional phenotypes in D2C1R1.
a, Inferred copy number heatmap from scRNA-seq data at day 245, analogous to Fig. 6a. b, Copy number plot of parent population for D2C1. c, Fishplot schematic illustrating the link between lineage (ECBs) and copy number based subclones, similar to Fig. 6b. The actual subclone frequencies are shown in Fig. 5c. d, Scatterplot comparing subclone frequencies at day 157 and the fold change between days 129 and 157 for all subclones. Subclones of interest are highlighted as in panel a. e, Dotplot showing the expression of top differentially expressed genes (DEGs) based on GEPIA (gene expression profiling interactive analysis) of gastric cancer (GC). f, Volcano plot illustrating DEGs from the comparison of the winning subclone 0a and its parent subclone 0b. Vertical and horizontal lines correspond to absolute log2FC values of 1 and p-values < 0.00001 (Wilcoxon rank sum test, not corrected for multiple testing) respectively. g, GSEA heatmap from MSigDB Hallmark gene sets showing the most significantly altered pathways for the highlighted subclones (right; Kolmogorov-Smirnov statistic, Benjamini-Hochberg adjusted, two-sided). A manually reconstructed copy number phylogeny is shown above. This visualization is equivalent to Fig. 6f. Source Data
Extended Data Fig. 8
Extended Data Fig. 8. Linking single-cell genotypes to their transcriptional phenotypes in in D2C1R2.
a, Inferred copy number heatmap from scRNA-seq data at day (d) 245, analogous to Fig. 6a. b, Fishplot schematic illustrating the link between lineage (ECBs) and copy number based subclones, similar to Fig. 6b. The actual subclone frequencies are shown in Fig. 5c. c, Scatterplot comparing subclone frequencies at day 157 and the fold change between days 129 and 157 for all subclones. Subclones of interest are highlighted as in panel a. d, Dotplot showing the expression of top differentially expressed genes (DEGs) based on GEPIA (gene expression profiling interactive analysis) of gastric cancer (GC). e, Volcano plot illustrating DEGs from the comparison of the winning subclone 0a and its parent subclone 0b. Vertical and horizontal lines correspond to absolute log2FC values of 1 and p-values < 0.00001 (Wilcoxon rank sum test, not corrected for multiple testing) respectively. f, GSEA heatmap from MSigDB Hallmark gene sets showing the most significantly altered pathways for the highlighted subclones (right; Kolmogorov-Smirnov statistic, Benjamini-Hochberg adjusted, two-sided). A manually reconstructed copy number phylogeny is shown above. This visualization is equivalent to Fig. 6f. Source Data
Extended Data Fig. 9
Extended Data Fig. 9. Linking single-cell genotypes to their transcriptional phenotypes in in D3C2R1.
a, Inferred copy number heatmap from scRNA-seq data at day (d) 189, analogous to Fig. 6a. b, Fishplot schematic illustrating the link between lineage (ECBs) and copy number based subclones, similar to Fig. 6b. The actual subclone frequencies are shown in Fig. 5c. c, Scatterplot comparing subclone frequencies at day 157 and the fold change between days 129 and 157 for all subclones. Subclones of interest are highlighted as in panel A. d, Dotplot showing the expression of top differentially expressed genes (DEGs) based on GEPIA (gene expression profiling interactive analysis) of gastric cancer (GC). e, Volcano plot illustrating DEGs from the comparison of the winning subclone 0a and its parent subclone 0b. Vertical and horizontal lines correspond to absolute log2FC values of 1 and p-values < 0.00001 (Wilcoxon rank sum test, not corrected for multiple testing) respectively. f, GSEA heatmap from MSigDB Hallmark gene sets showing the most significantly altered pathways for the highlighted subclones (right; Kolmogorov-Smirnov statistic, Benjamini-Hochberg adjusted, two-sided). A manually reconstructed copy number phylogeny is shown above. The visualization is equivalent to Fig. 6f. Source Data
Extended Data Fig. 10
Extended Data Fig. 10. Enrichment of similar gene sets between winning subclones and Late cultures.
a, GSEA heatmap from MSigDB Hallmark gene sets for each barcoded culture, including replicates: D2C2-R2 (day 173), D2C1R1 (day 245), D2C1-R2 (day 245), D3C2R1 (day 189), as well as non-barcoded Late cultures for D1C1, D1C2, D1C3, D2C2, D2C3 and D3C2. The GSEA score is indicated by dot size and coloured according to the directionality of expression profiles (up, red; down, blue). Background shading indicates statistical significance (Kolmogorov-Smirnov statistic, Benjamini-Hochberg adjusted, two-sided) b, Winning subclones and Late samples cluster together based on GSEA score. Pairwise spearman correlation between samples based on GSEA scores for the top 10 most altered pathways for all Late and winnings subclone samples. The most altered pathways are shown in a. This plot is identical to Fig. 6g but with sample annotations included. Note that the winning subclones (marked in red) cluster with the Late samples for D1C1, D2C2, D2C3 and D3C2 which exhibit a more malignant phenotype compared to Late samples D1C2 and D1C3 based on the LSI projection (Fig. 4c,d, Extended Data Fig. 5). c, Fisher exact test of independence (two-sided), comparing significance for each pathway, and status for each sample - Late and winning subclones (n = 16) relative to all other subclones analysed (n = 29). The red line indicates the significance threshold (0.05) with Bonferroni correction. Source Data

References

    1. Crosby D, et al. Early detection of cancer. Science. 2022;375:eaay9040. - PubMed
    1. Vázquez-García I, et al. Clonal heterogeneity influences the fate of new adaptive mutations. Cell Rep. 2017;21:732–744. - PMC - PubMed
    1. Lenski RE, Rose MR, Simpson SC, Tadler SC. Long-term experimental evolution in Escherichia coli. I. Adaptation and divergence during 2,000 generations. Am. Nat. 1991;138:1315–1341.
    1. Good BH, McDonald MJ, Barrick JE, Lenski RE, Desai MM. The dynamics of molecular evolution over 60,000 generations. Nature. 2017;551:45–50. - PMC - PubMed
    1. Sottoriva A, et al. A Big Bang model of human colorectal tumor growth. Nat. Genet. 2015;47:209–216. - PMC - PubMed

Publication types

MeSH terms

Substances