. 2023 Jul;619(7968):160-166.
doi: 10.1038/s41586-023-06123-3. Epub 2023 May 31.

Pan-KRAS inhibitor disables oncogenic signalling and tumour growth

Affiliations

Pan-KRAS inhibitor disables oncogenic signalling and tumour growth

Dongsung Kim et al. Nature. 2023 Jul.

Abstract

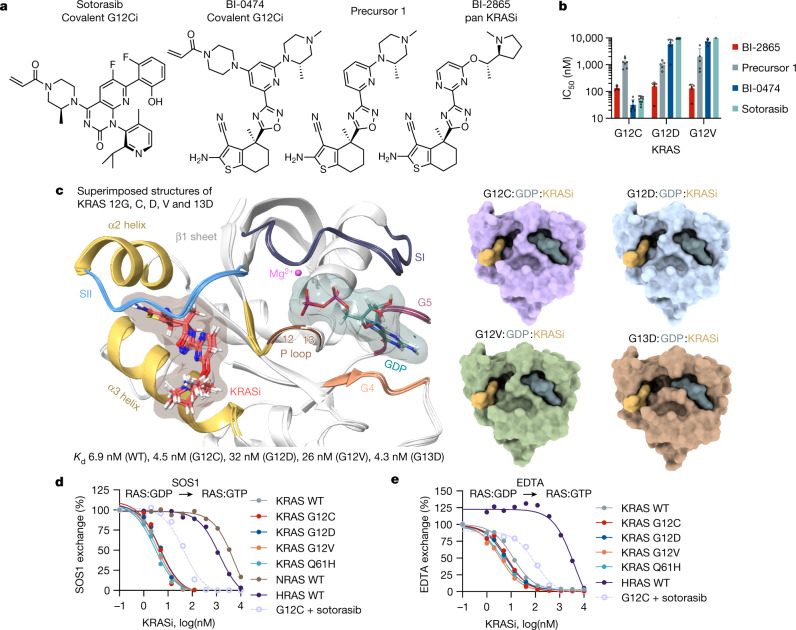
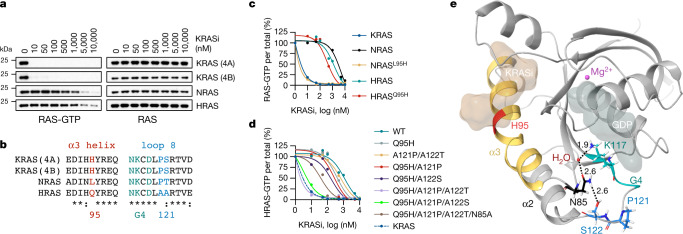
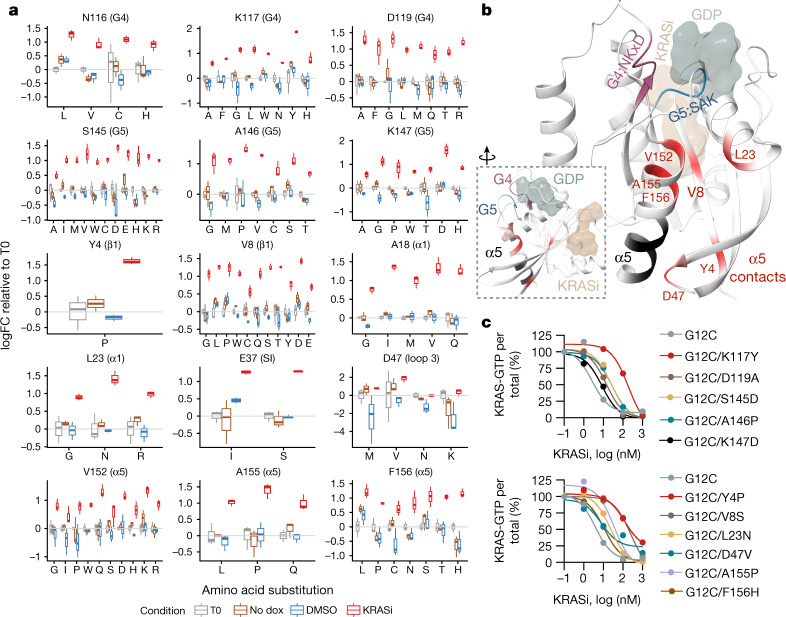
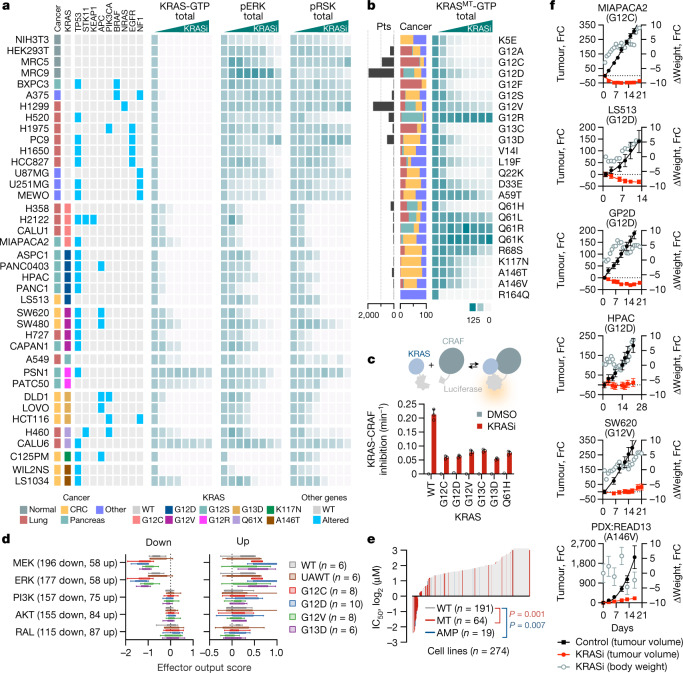
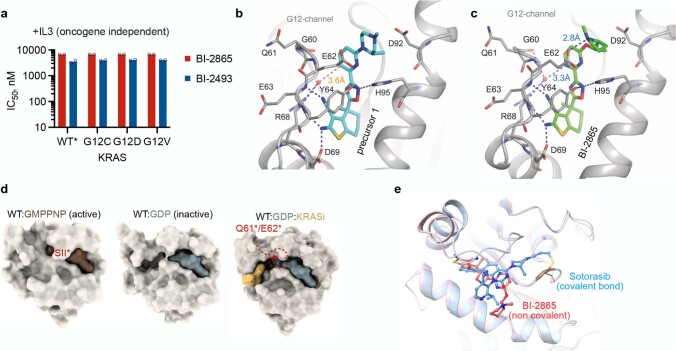
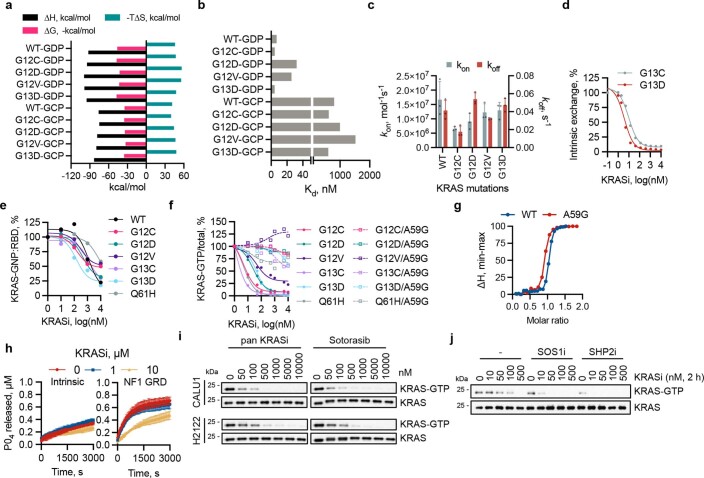
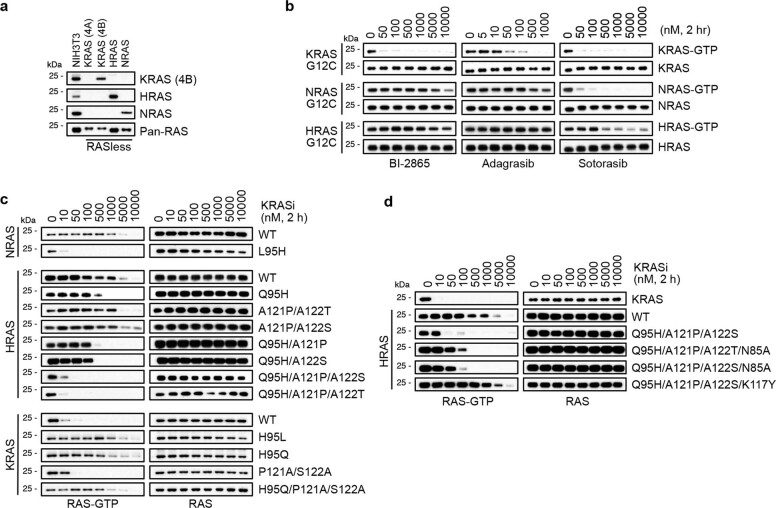
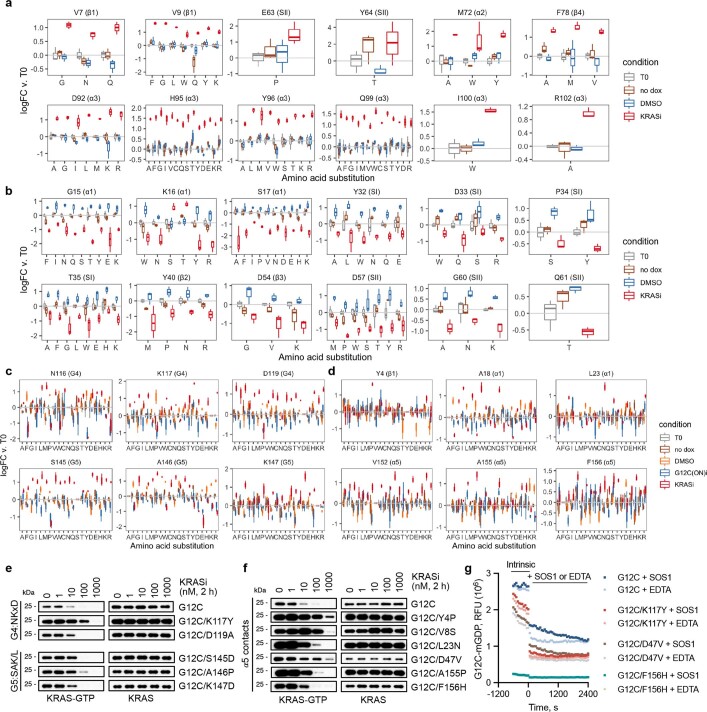
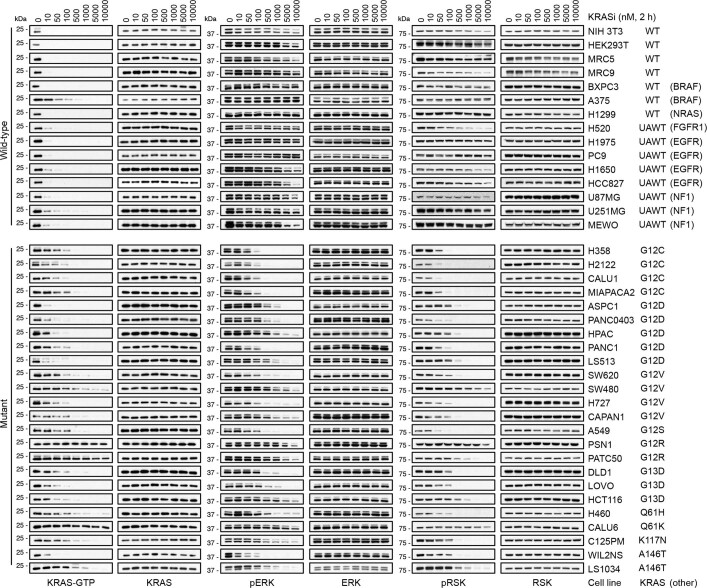
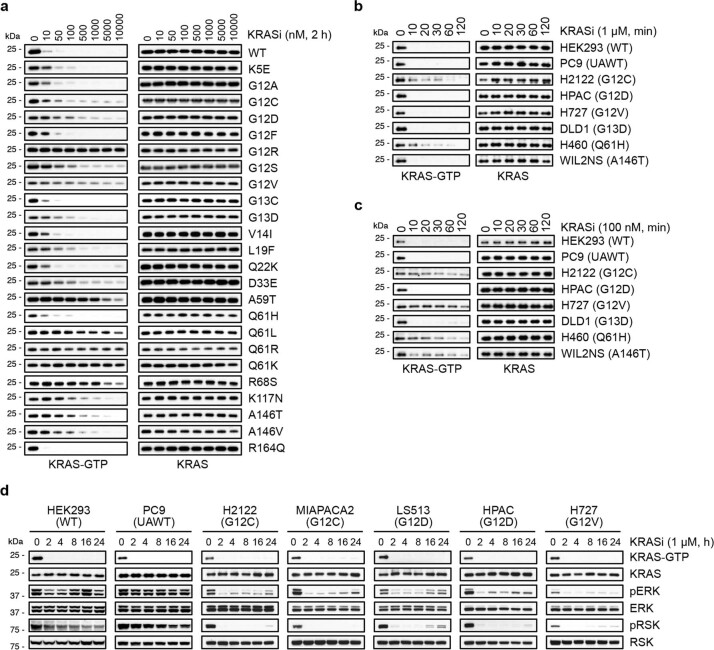
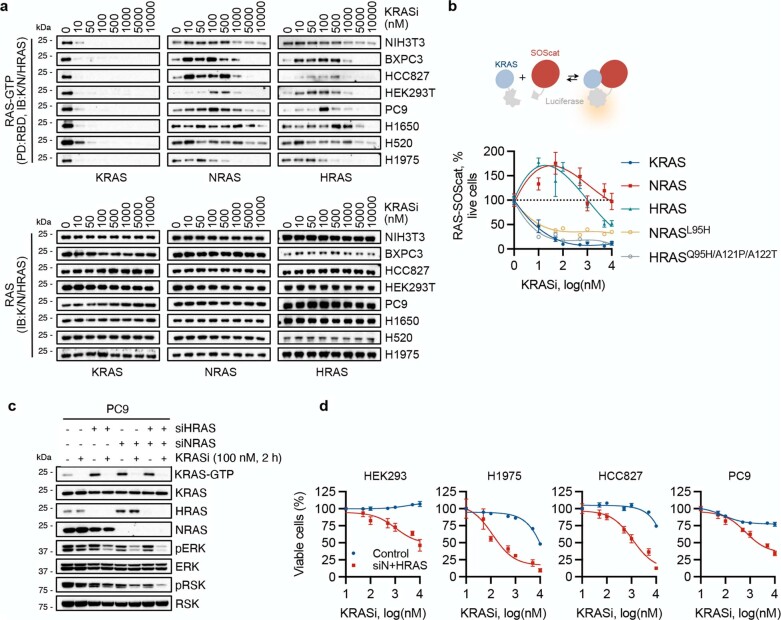
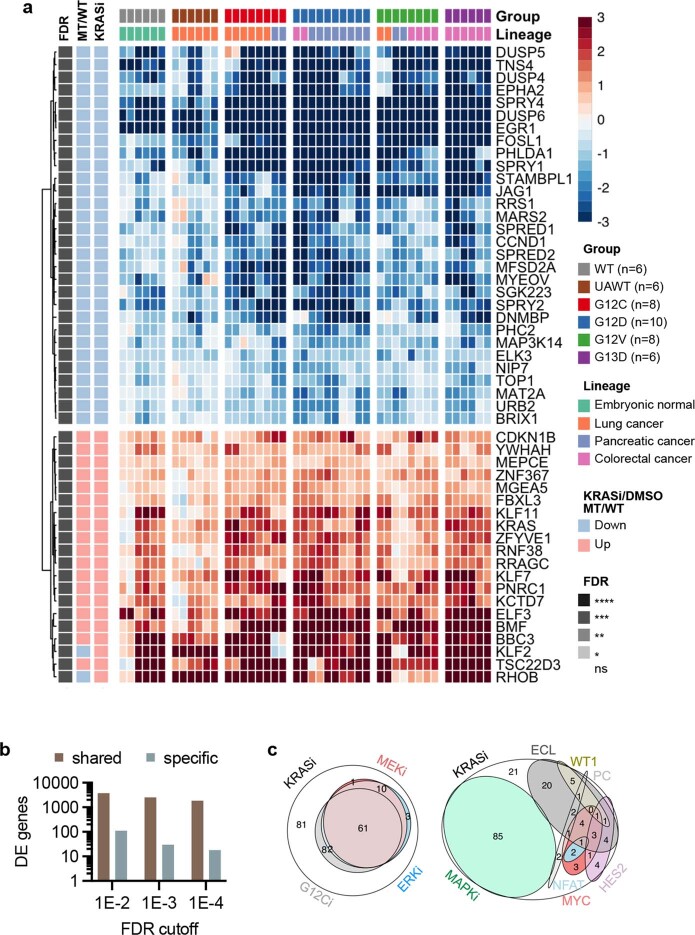
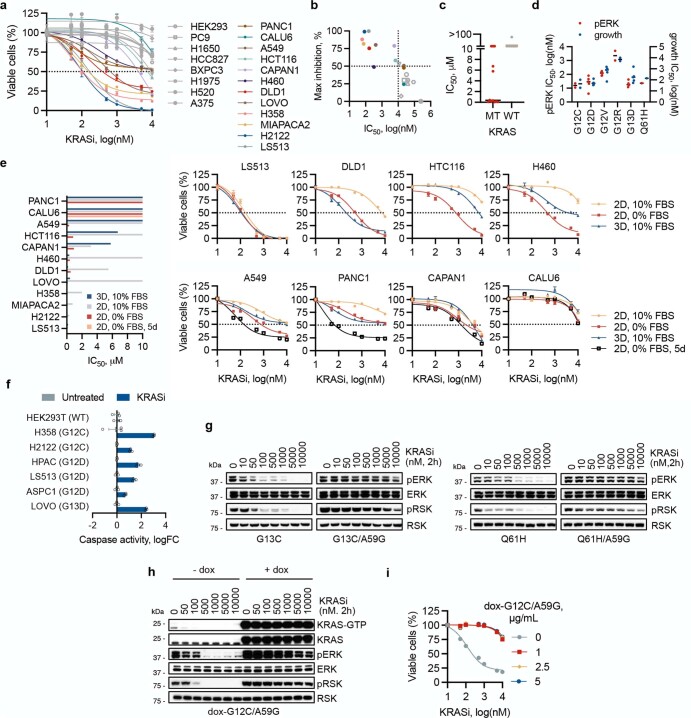
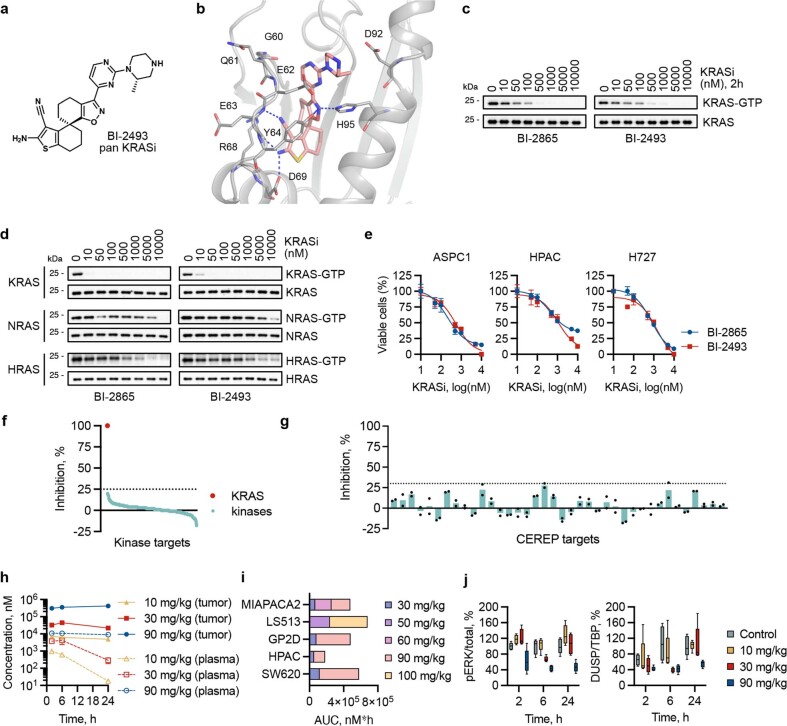
KRAS is one of the most commonly mutated proteins in cancer, and efforts to directly inhibit its function have been continuing for decades. The most successful of these has been the development of covalent allele-specific inhibitors that trap KRAS G12C in its inactive conformation and suppress tumour growth in patients1-7. Whether inactive-state selective inhibition can be used to therapeutically target non-G12C KRAS mutants remains under investigation. Here we report the discovery and characterization of a non-covalent inhibitor that binds preferentially and with high affinity to the inactive state of KRAS while sparing NRAS and HRAS. Although limited to only a few amino acids, the evolutionary divergence in the GTPase domain of RAS isoforms was sufficient to impart orthosteric and allosteric constraints for KRAS selectivity. The inhibitor blocked nucleotide exchange to prevent the activation of wild-type KRAS and a broad range of KRAS mutants, including G12A/C/D/F/V/S, G13C/D, V14I, L19F, Q22K, D33E, Q61H, K117N and A146V/T. Inhibition of downstream signalling and proliferation was restricted to cancer cells harbouring mutant KRAS, and drug treatment suppressed KRAS mutant tumour growth in mice, without having a detrimental effect on animal weight. Our study suggests that most KRAS oncoproteins cycle between an active state and an inactive state in cancer cells and are dependent on nucleotide exchange for activation. Pan-KRAS inhibitors, such as the one described here, have broad therapeutic implications and merit clinical investigation in patients with KRAS-driven cancers.


Conflict of interest statement

P.L. is listed as an inventor on patents filed by MSKCC on the treatment of KRAS or BRAF mutant cancers (US20200009138A1). P.L. reports grants to his institution from Amgen, Mirati, Revolution Medicines, Boehringer Ingelheim and Virtec Pharmaceuticals. P.L. reports consulting fees from Black Diamond Therapeutics, AmMax, OrbiMed, PAQTx, Repare Therapeutics and Revolution Medicines, travel reimbursement from Boehringer Ingelheim as well as membership of the Scientific Advisory Board of Frontier Medicines (consulting fees and equity). L.H., D.R., J.B., B.W., K.G.K., D.B.M. and N.K. are employed by Boehringer Ingelheim. The remaining authors declare no competing interests.

Figures

Fig. 1
Fig. 1. Identification of a non-covalent inhibitor that inactivates common cancer-causing KRAS mutants.
a, Chemical structures of the indicated compounds. b, Isogenic BaF3 cells expressing the indicated KRAS mutants were treated for 5 days in the absence of IL3 (oncogene dependent growth) to determine the effect on proliferation (mean ± s.e.m., n = 5, unless otherwise indicated, n denotes biological replicates). c, Cocrystal structures of drug-bound WT, G12C, G12D, G12V and G13D mutant KRAS. d,e, The effect of KRASi treatment on nucleotide exchange stimulated either by SOS1 (d) or EDTA (e). The reaction of KRAS G12C with the covalent inhibitor sotorasib is shown for comparison. A representative of two independent repeats is shown in d and e. Source data
Fig. 2
Fig. 2. Limited evolutionary divergence confers selectivity for KRAS.
a, RASless mouse embryonic fibroblasts expressing the indicated RAS isoforms were treated for 2 h. Cell extracts were subjected to RBD pull down and immunoblotting to determine the amount of active RAS. b, Sequence alignment of the G domain of RAS isoforms. c,d, Effect of isoform mimetic substitutions on RAS inhibition: RAS-GTP (c) and HRAS-GTP (d). HEK293 cells expressing the indicated mutants were treated for 2 h to determine the effect on RAS activation by using RBD pull down, immunoblotting and densitometry. e, Cocrystal structure of drug-bound KRAS showing H bonds between S122, N85 and K117 (black dotted lines, distance in Å). A representative of two independent experiments is shown in a, c and d. Source data
Fig. 3
Fig. 3. Diverse allosteric effects on inactive state selective KRAS inhibition.
a, H358 cells were infected with a dox-inducible saturation mutagenesis library based on a KRAS G12C backbone and treated with either DMSO or KRASi for 2 weeks. The selection of mutations in amino acids far from drug-binding interface are shown (median, interquartile range and Tukey whiskers, n = 3). FC, fold change; T0, time 0. b, Residues from a were mapped in the cocrystal structure of KRAS G12C with the KRAS inhibitor. Residues involved in α5 contacts that were not identified in the screen are shown in black. Inset, 90° rotation. c, HEK293 cells expressing KRAS with a single G12C mutation or double mutants involving substitutions in the G4 and G5 motifs (top) or α5 helix contacts (bottom) were treated as shown for 2 h. Cell extracts were subjected to RBD pull down, immunoblotting and densitometry to determine the effect on KRAS-GTP concentrations. A representative of two independent repeats is shown in c. Source data
Fig. 4
Fig. 4. Selective inhibition of oncogenic signalling and KRAS-driven tumour growth.
a, Thirty-nine cell lines were treated for 2 h to determine the effect on KRAS activation and downstream signalling. b, HEK293 cells expressing the indicated KRAS mutants were treated as shown and analysed to determine the effect on KRAS activation. The abundance (Pts) and distribution of mutations across cancer types (Cancer, %) are shown. c, A split luciferase assay was used to determine the rate constant for the inhibition of the KRAS–CRAF interaction by treatment in live cells (mean ± s.e.m., n = 3). d, Effect of KRASi treatment on the transcriptional output by key RAS effector pathways (median, interquartile range and Tukey whiskers). The number of effector-dependent genes used to calculate the output score is shown in parentheses. e, Profiling of IC50s in a panel of 274 cell lines. f, Mice bearing xenograft models were treated to determine the effect on tumour growth and animal weight (mean ± s.e.m., n = 5). FrC, fractional change (%). Source data
Extended Data Fig. 1
Extended Data Fig. 1. Rational design of a non-covalent pan KRAS inhibitor.
a, Isogenic BaF3 cells engineered to express the indicated KRAS variants were treated as shown for 72 h to determine the IC50 (n = 2, mean and each replicate). IL3 stimulation was used to induce oncogene independent growth. The effect of treatment in the absence of IL3 is shown in Fig. 1b. *: endogenous KRAS WT. b,c, Co-crystal structures of precursor 1 (b) or BI-2865 (c) bound to KRAS. d, Space filling models of KRAS variants in an apo- or drug-bound conformation. S: switch; *: active state conformation. e, Superimposition of co-crystal structures of KRAS G12C in complex with the covalent inhibitor sotorasib or the pan KRAS inhibitor BI-2865. Source data
Extended Data Fig. 2
Extended Data Fig. 2. Biochemical and cellular effects of the KRAS inhibitor.
a,b, KRAS variants were loaded with GDP or GCP and subjected to isothermal titration calorimetry (ITC) with the KRASi. c, The association (on) and dissociation (off) rate constants of drug binding to GDP-loaded KRAS variants (mean ± s.e.m., n = 3). d, Effect of KRASi treatment on nucleotide exchange under intrinsic conditions. e, KRAS variants were loaded with the non-hydrolyzable GTP analogue GMPPNP (GNP) and reacted with a GST-tagged RBD domain of CRAF. The mixtures were analyzed by GST pull-down and immunoblotting to determine the ability of the drug to displace effectors from the active state of KRAS. Pull-down reactions were analyzed by immunoblotting and quantified by densitometry. f, Extracts from HEK293 cells expressing the indicated variants treated with the KRASi for 2 h were subjected to RBD pull down and immunoblotting. The levels of total and GTP-bound KRAS were quantified by densitometry. g, The indicated KRAS variants were loaded with GDP and subjected to ITC in the presence of increasing concentrations of the KRASi. h, Effect of KRASi treatment on GTP hydrolysis by KRAS under intrinsic conditions or in the presence of the GAP related domain (GRD) of NF1 (mean ± s.e.m., n = 3). i, The indicated KRAS G12C mutant cell lines were treated for 2 h and their extracts were subjected to RBD pull-down and immunoblotting to determine the level of active KRAS. j, H2122 cells were treated as shown and analyzed to determine the effect on KRAS activation. A representative of two independent repeats is shown in a, b, d-f, i and j. Source data
Extended Data Fig. 3
Extended Data Fig. 3. Orthosteric and allosteric effects determine KRAS selectivity.
a, Extracts from RASless MEFs expressing the indicated RAS isoforms were evaluated by immunoblotting. b, HEK293 cells expressing the indicated G12C mutants were treated for 2 h. Cell extracts were subjected to RBD-pull down and immunoblotting to determine the level of active RAS. c,d, Effect of isoform mimetic substitutions on RAS inhibition. HEK293 cells expressing the indicated mutants were treated as shown for 2 h. Cell extracts were subjected to RBD-pull down and immunoblotting to determine the level of active RAS. The effect of H95 mutants is shown in c and the effects of P121, S122, N85 and K117 mutants are shown in c and d. A representative of two independent repeats is shown in a, b, c and d. Source data
Extended Data Fig. 4
Extended Data Fig. 4. Saturation mutagenesis screen reveals residues that modulate inhibition.
a,b, The effect of substitutions in amino acids involved in the drug binding interface (a) or in the RAS-GDP:SOS1 interface (b) are shown (mean ± 95%CI, n = 3). Only variants with a log FC (KRASi/DMSO) > 1 and FDR < 0.05 are included. All boxplots denote median, interquartile range and Tukey whiskers. c,d, As in a, but the cells were treated either with the inactive state selective pan KRASi or with an active state selective KRAS G12C inhibitor. The effect of substitutions in amino acids comprising the G4 and G5 motifs or substitutions in amino acids involved in contacts with the α5 helix are shown in c and d, respectively (mean ± 95%CI, n = 3). e,f, Cell extracts from HEK293 cells expressing the indicated KRAS variants were subjected to RBD-pulldown and immunoblotting to determine the effect on KRAS-GTP. g, The indicated KRAS mutants were loaded with mant-GDP and subjected to nucleotide exchange in the absence or the presence of the catalytic subunit of SOS1 or EDTA. A representative of two independent repeats is shown in e, f and g. Source data
Extended Data Fig. 5
Extended Data Fig. 5. Selective inhibition of oncogenic signaling driven by various KRAS mutants.
Extracts from cell lines treated with the KRAS inhibitor were subjected to RBD pull-down and immunoblotting to determine the effect on KRAS and ERK signaling activation. WT: wild-type, UAWT: upstream activated wild-type. Co-occurring alterations in select other genes are shown. The data in Fig. 4a are densitometric quantifications of the immunoblots shown here.
Extended Data Fig. 6
Extended Data Fig. 6. Rapid and sustained inactivation of common KRAS mutants.
a, HEK293 cells expressing the indicated KRAS variants were treated as shown and analyzed to determine the effect on KRAS activation. bd, The indicated cell lines were treated over time to determine the effect on KRAS activation (b–d) and ERK signaling intermediates (d). The cells in b and c were treated in serum-free medium, whereas those in a and d were treated in complete medium. A representative of two independent repeats is shown in a–d.
Extended Data Fig. 7
Extended Data Fig. 7. Drug induced cellular activation of HRAS and NRAS.
a, The indicated KRAS WT cells were treated for 2 h to determine the effect on RAS isoform activation. A representative of two independent repeats is shown. b, A split luciferase construct was used to determine the effect of treatment (2 h) on the interaction between RAS variants and the catalytic subunit of SOS1 (SOScat, mean ± s.e.m., n = 3). c, The cells were transfected with HRAS- and/or NRAS-specific siRNA pools and treated as shown. Extracts were analyzed to determine the level of KRAS activation and downstream signaling inhibition. A representative of two independent repeats is shown. d, The indicated KRAS WT models were transfected with NRAS- and HRAS-specific siRNA pools, followed by treatment with the KRASi for 72 h. The effect on cell viability was determined by the ATP-glow assay (mean ± s.e.m., n = 3). Source data
Extended Data Fig. 8
Extended Data Fig. 8. Effect of KRASi treatment on transcriptional output.
a, Differential expression analysis in models with wild-type or mutant KRAS treated for 2 h with the KRASi. The heat map shows the scaled logFC relative to DMSO. Row annotations show the expression trend in the KRASi/DMSO or MT/WT comparisons. The models are grouped as shown. b, The number of differentially expressed (DE) genes shared across groups as compared to those specific for a particular group. c, Gene-set enrichment analysis of transcripts down-regulated by treatment. The MAPK-dependent signatures were established experimentally by treating cells with the inhibitors shown (see Methods). The other signatures are from MSigDB. ECL: extracellular ligand; PC: polycomb transcription factors. Source data
Extended Data Fig. 9
Extended Data Fig. 9. Antiproliferative effect of the KRAS inhibitor.
ac, The indicated cells were grown in 3D culture and treated with the KRASi for 72 h and the effect on cell viability (A) was determined using the ATP-glow assay (mean ± s.e.m., n = 4). The effect on maximal inhibition as a function of IC50 (b) and the difference in IC50 between KRAS MT and WT models (c) are shown. d, Correlation between ERK and growth inhibition in cell lines with distinct KRAS mutations. e, Antiproliferative effect of treatment under the cell culture conditions shown (mean ± s.e.m., n = 4). f, The indicated models were treated for 24 h followed by measurement of caspase activation (mean ± s.e.m., n = 3). g, Extracts from HEK293 cells expressing the indicated variants were analyzed to determine the effect of treatment on ERK signaling activation. h,i, H358 cells with dox-inducible expression of KRAS G12C/A59G were analyzed as shown to determine the effect on KRAS signaling (h) or proliferation (i, mean ± s.e.m., n = 3). A representative of two independent repeats is shown in g and h. Source data
Extended Data Fig. 10
Extended Data Fig. 10. Characterization of the in vivo pan KRAS inhibitor BI-2493.
a, Chemical structure of BI-2493. b, Co-crystal structure of KRAS G13D with BI-2493. c,d, CALU1 cells (c) or RASless MEFs expressing the indicated RAS isoforms (d) were treated as shown and analyzed by RBD pulldown and immunoblotting. A representative of two independent repeats is shown. e, The indicated cancer cell lines were treated as shown for 72 h. Viable cells were determined by ATP-glow (mean ± s.e.m., n = 3). f,g, Effect of KRASi-treatment (1 µM) across a panel of 404 kinases (f) or 38 targets commonly used in safety profiling (g). KRAS was not part of the assay and included only as a reference. hj, GP2D (h, i, j) or other (i) xenograft bearing mice were treated with BI-2493 (10–90 mg/kg, p.o. twice a day). Plasma (h, i) or tumors (h, j) from treated mice were used to determine the concentration of BI-2493 or the effect on inhibition of the noted ERK signaling intermediates. h: mean ± s.e.m (n = 4), j: median, 95% confidence interval and range are shown (n = 4). Source data

Comment in

References

    1. Ostrem JM, Peters U, Sos ML, Wells JA, Shokat KM. K-Ras(G12C) inhibitors allosterically control GTP affinity and effector interactions. Nature. 2013;503:548–551. doi: 10.1038/nature12796. - DOI - PMC - PubMed
    1. Lito P, Solomon M, Li LS, Hansen R, Rosen N. Allele-specific inhibitors inactivate mutant KRAS G12C by a trapping mechanism. Science. 2016;351:604–608. doi: 10.1126/science.aad6204. - DOI - PMC - PubMed
    1. Canon J, et al. The clinical KRAS(G12C) inhibitor AMG 510 drives anti-tumour immunity. Nature. 2019;575:217–223. doi: 10.1038/s41586-019-1694-1. - DOI - PubMed
    1. Hallin J, et al. The KRAS(G12C) inhibitor MRTX849 provides insight toward therapeutic susceptibility of KRAS-mutant cancers in mouse models and patients. Cancer Discov. 2020;10:54–71. doi: 10.1158/2159-8290.CD-19-1167. - DOI - PMC - PubMed
    1. Hong DS, et al. KRAS(G12C) inhibition with sotorasib in advanced solid tumors. N. Engl. J. Med. 2020;383:1207–1217. doi: 10.1056/NEJMoa1917239. - DOI - PMC - PubMed

Publication types