. 2023 Jun;618(7966):827-833.
doi: 10.1038/s41586-023-06132-2. Epub 2023 May 31.

In situ tumour arrays reveal early environmental control of cancer immunity

Affiliations

In situ tumour arrays reveal early environmental control of cancer immunity

Guadalupe Ortiz-Muñoz et al. Nature. 2023 Jun.

Abstract

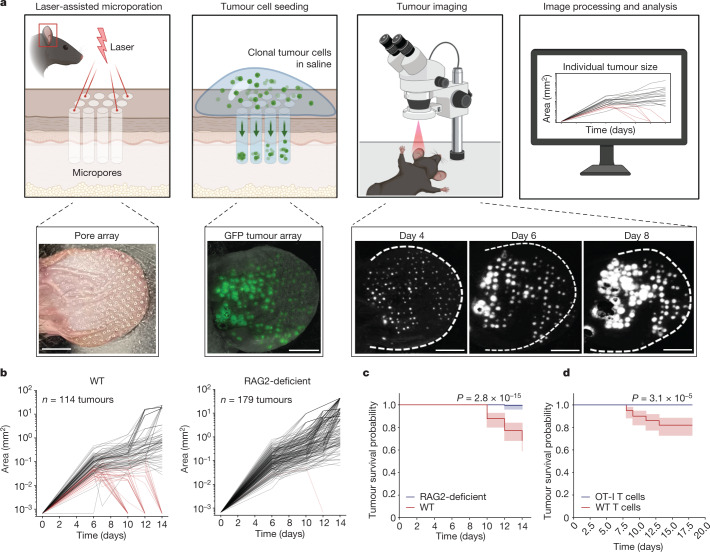
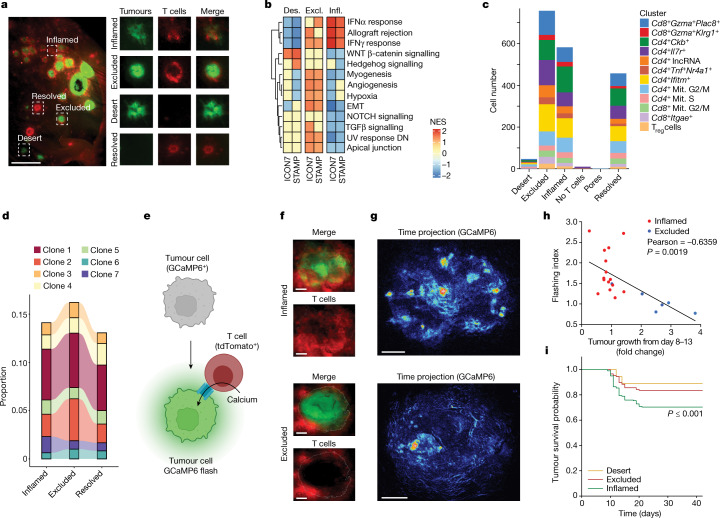
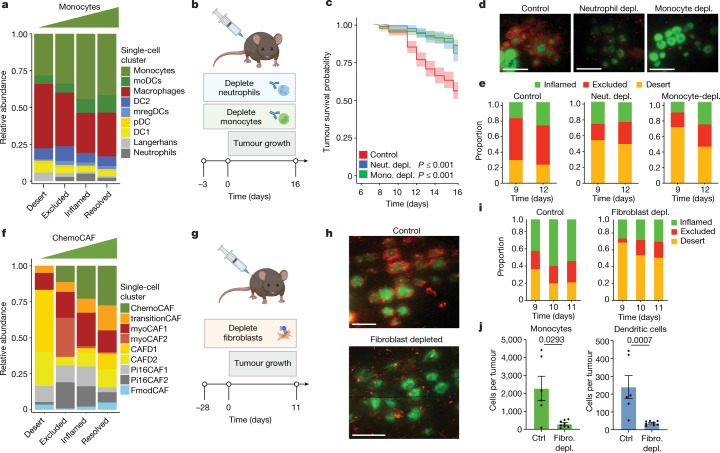
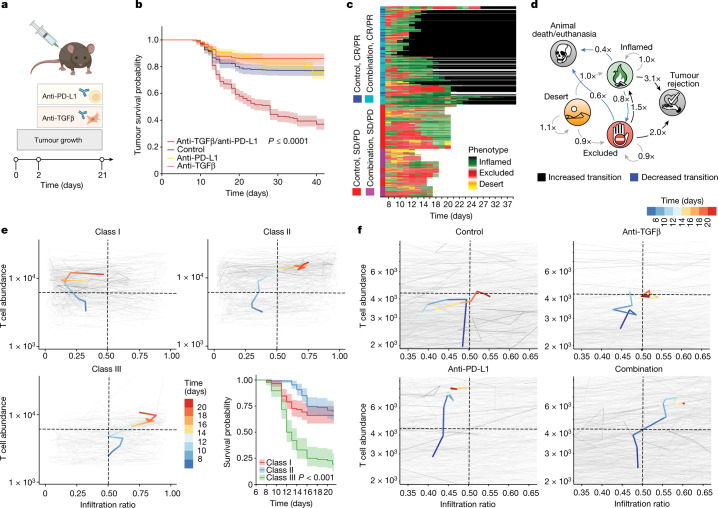
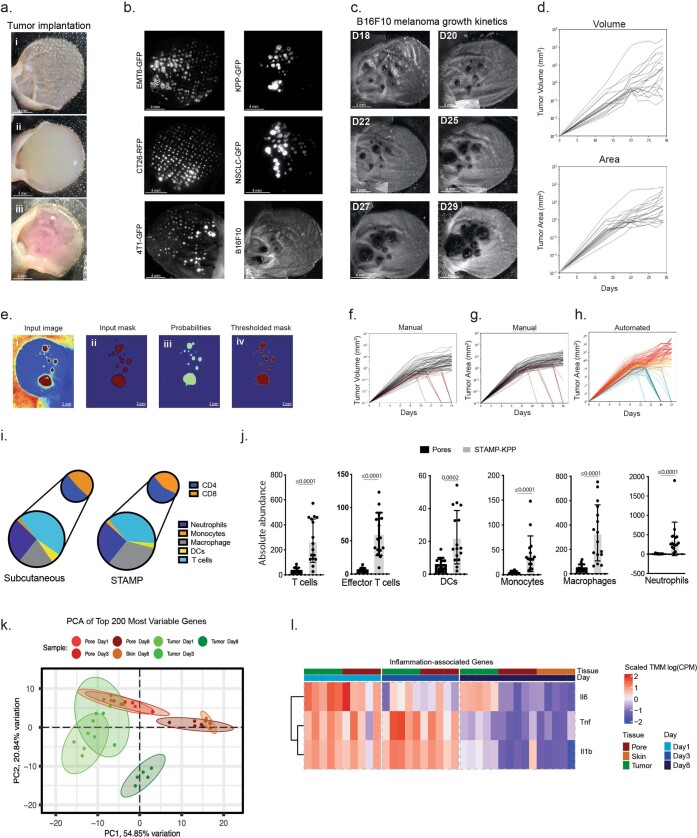
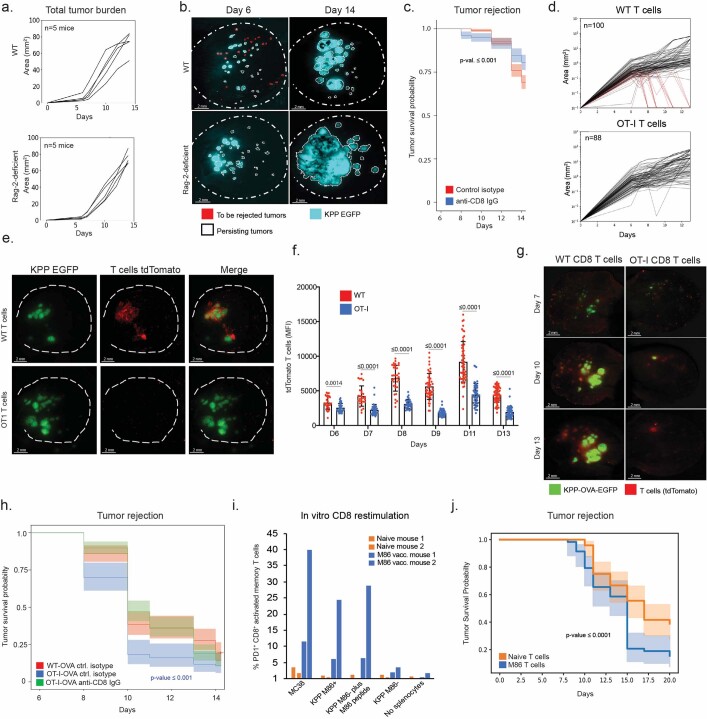
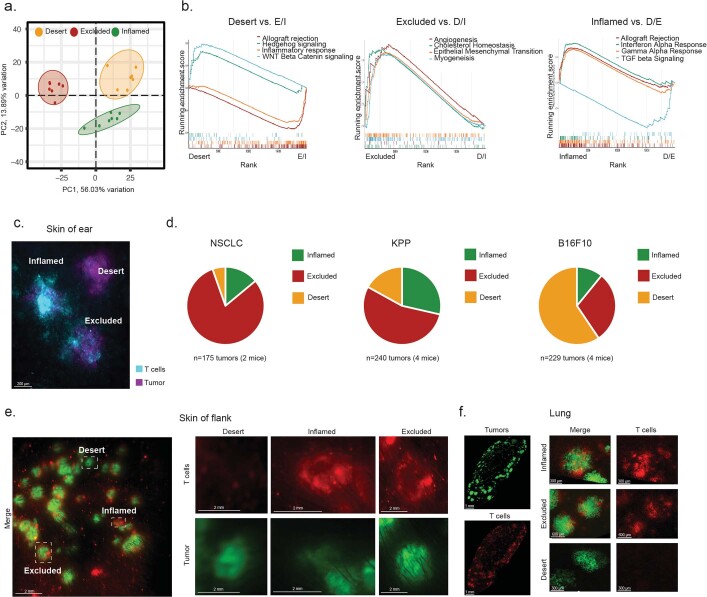
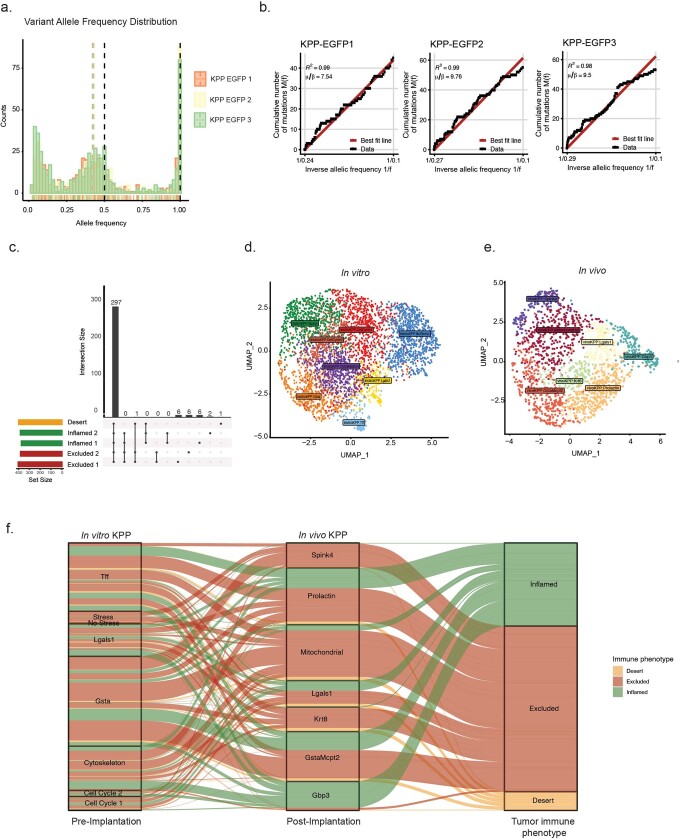
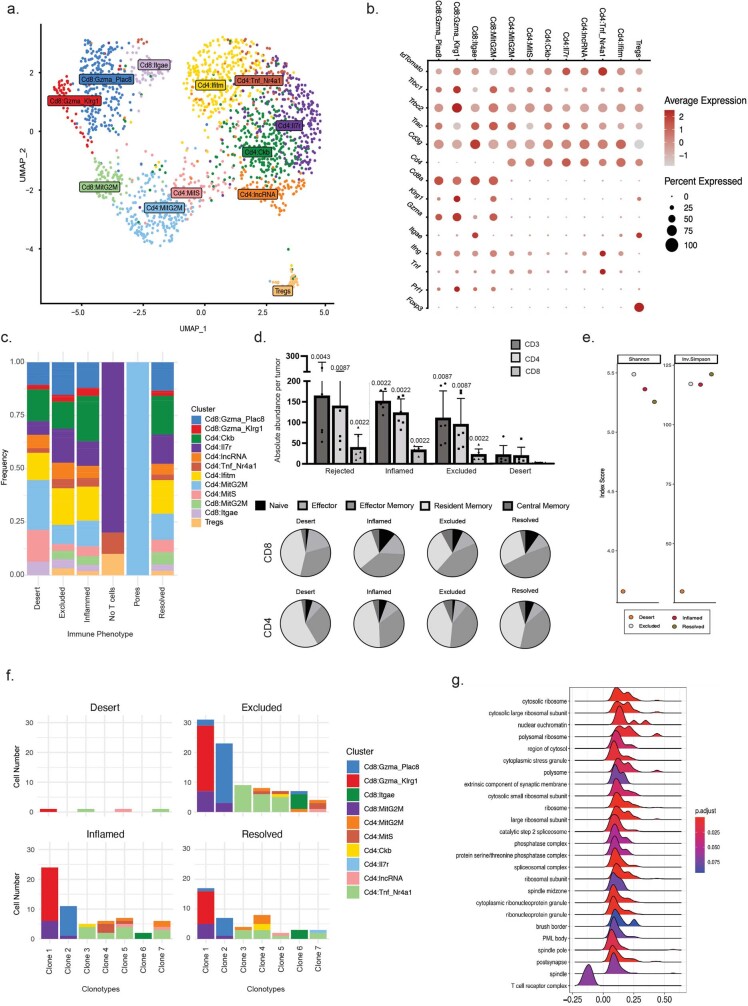
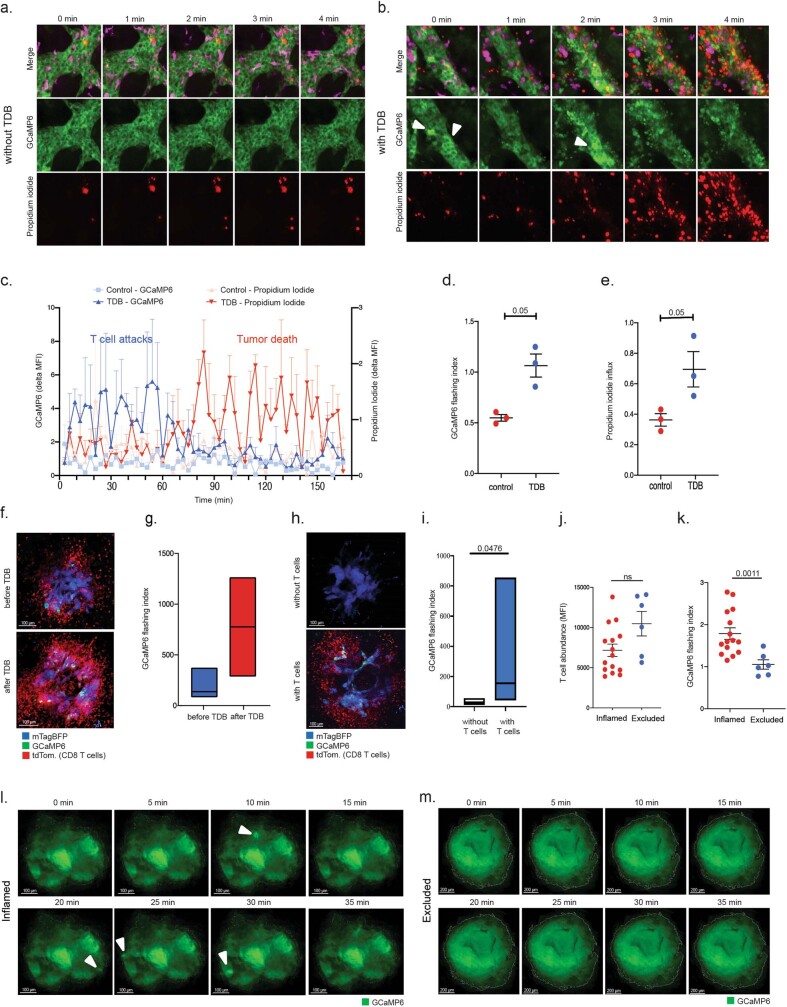
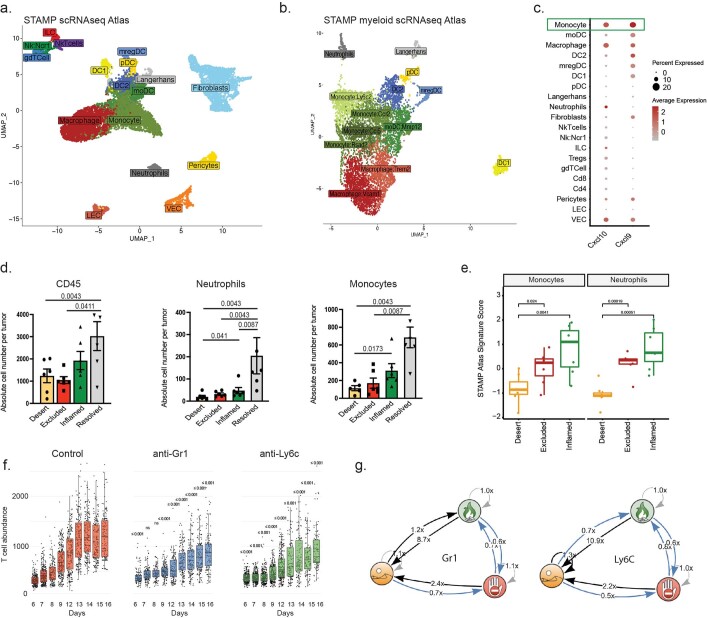
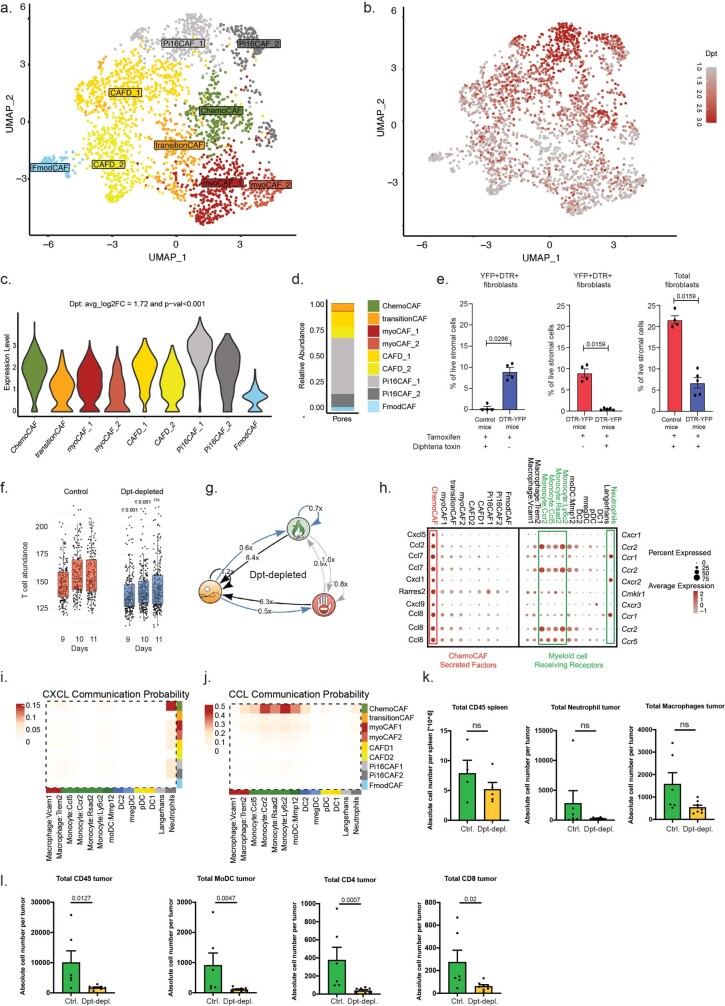
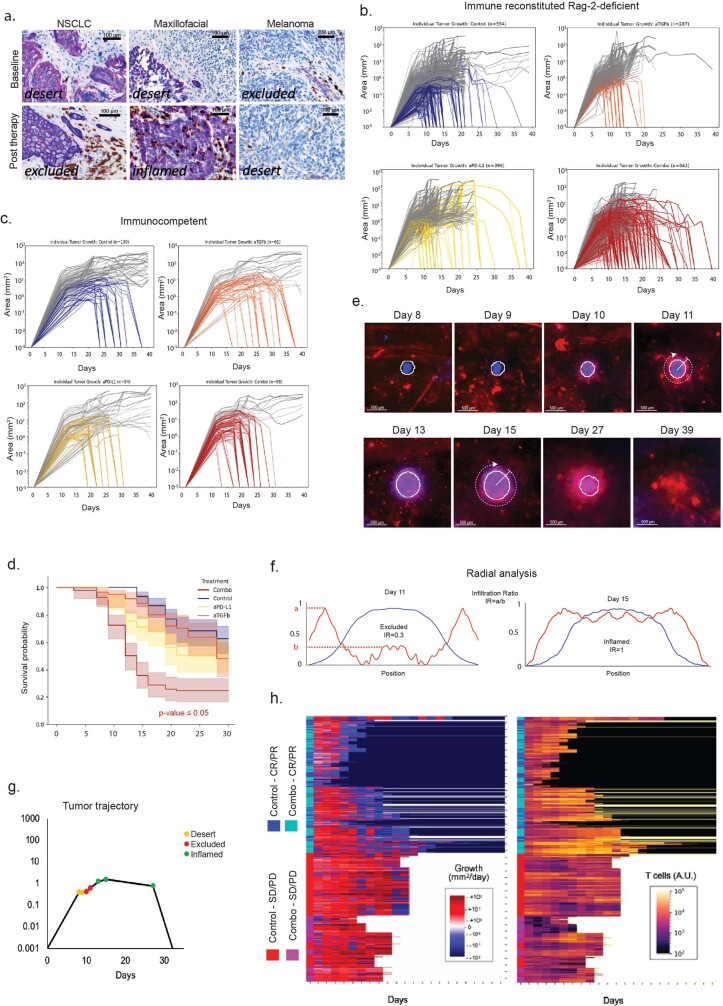
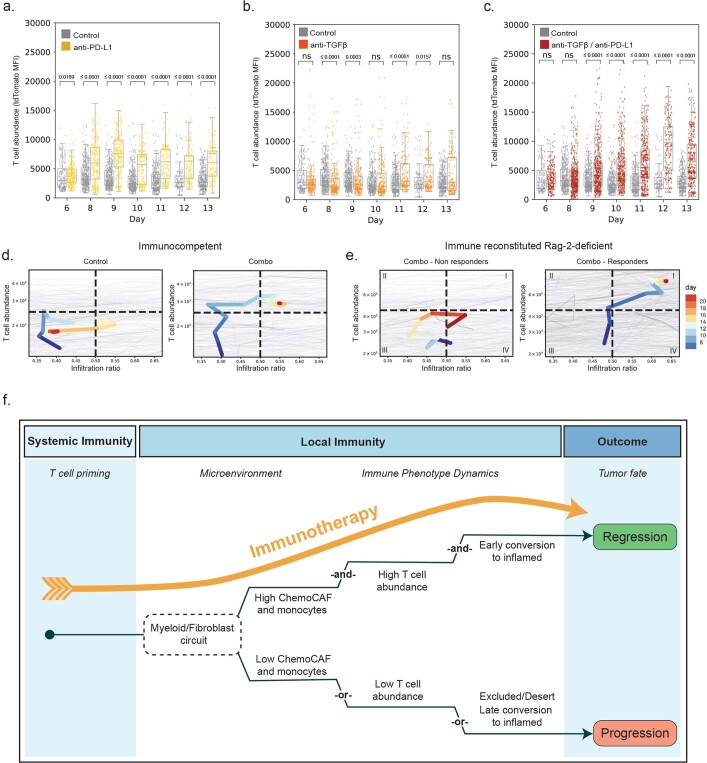
The immune phenotype of a tumour is a key predictor of its response to immunotherapy1-4. Patients who respond to checkpoint blockade generally present with immune-inflamed5-7 tumours that are highly infiltrated by T cells. However, not all inflamed tumours respond to therapy, and even lower response rates occur among tumours that lack T cells (immune desert) or that spatially exclude T cells to the periphery of the tumour lesion (immune excluded)8. Despite the importance of these tumour immune phenotypes in patients, little is known about their development, heterogeneity or dynamics owing to the technical difficulty of tracking these features in situ. Here we introduce skin tumour array by microporation (STAMP)-a preclinical approach that combines high-throughput time-lapse imaging with next-generation sequencing of tumour arrays. Using STAMP, we followed the development of thousands of arrayed tumours in vivo to show that tumour immune phenotypes and outcomes vary between adjacent tumours and are controlled by local factors within the tumour microenvironment. Particularly, the recruitment of T cells by fibroblasts and monocytes into the tumour core was supportive of T cell cytotoxic activity and tumour rejection. Tumour immune phenotypes were dynamic over time and an early conversion to an immune-inflamed phenotype was predictive of spontaneous or therapy-induced tumour rejection. Thus, STAMP captures the dynamic relationships of the spatial, cellular and molecular components of tumour rejection and has the potential to translate therapeutic concepts into successful clinical strategies.


Conflict of interest statement

G.O.-M., M.B., C.B.C., X.P.-J., V.R., H.L., D.N., L.D., A.T.R., A.Y., J.D., Y.W., S.M., S.D., Z.M., T.W., Q.S., B.H., R.P., S.J.T., I.M. and C.M. are employees of Genentech/Roche.

Figures

Fig. 1
Fig. 1. STAMP reveals local T-cell-mediated rejection of clonal skin tumour array.
a, The STAMP workflow. Skin microporation using the P.L.E.A.S.E. laser device and subsequent seeding of tumour arrays from cell suspension. Individual tumours of the array are longitudinally tracked using epifluorescence microscopy and the growth kinetics are analysed by automated computation. Scale bars, 4 mm. b, Automated analysis of the growth kinetics of individual KPP-eGFP tumours (area in mm2) inside the same tumour array implanted into RAG2-deficient (n = 179 tumours, n = 4 mice) or wild-type (WT) (n = 114 tumours, n = 3 mice) mice. Sampling is representative of n = 5 mice per group. The red lines indicate tumours that were rejected, and the grey lines indicate tumours that persist. c, The survival probability of individual tumours of KPP-eGFP arrays as described in b. The centre line shows the Kaplan–Meier curve and the shaded area shows the 95% confidence interval. Statistical analysis was performed using a log-rank test. d, The survival probability of individual tumours of KPP-eGFP arrays implanted into RAG2-deficient mice reconstituted by adoptive transfer of tdTomato+ T cells from either WT mice (n = 100 tumours, n = 2 mice) or OT-I mice (n = 88 tumours, n = 2 mice). Sampling is representative of n = 2 independent experiments, n = 7 mice per group. The centre line shows the Kaplan–Meier curve and the shaded area shows the 95% confidence interval. Statistical analysis was performed using log-rank tests. Source Data
Fig. 2
Fig. 2. Immune-inflamed phenotype supports T cell effector function and tumour rejection.
a, Representative image of a STAMP array of KPP-eGFP tumours at 8 days after tumour implantation in RAG2-deficient mice, reconstituted with tdTomato+ T cells. n = 50 mice, n = 10 independent experiments. Red, T cells; green, KPP-eGFP cells. Left, representation of the entire ear. Right, magnified images of individual tumours with different immune phenotypes. Scale bar, 2 mm. b, Heat map comparing the normalized enrichment scores for pathways that are significantly enriched across the immune-inflamed (infl.), immune-desert (des.) and immune-excluded (excl.) phenotypes from either human tumours from the ICON7 clinical trial or mouse STAMP tumours. Normalized enrichment scores were determined using clusterProfiler::GSEA using the false-discovery rate P-value adjustment method; Padj < 0.2 was considered to be significant. c, The abundance of T cell subsets was determined using scRNA-seq analysis of STAMP tumour biopsies pooled by immune phenotype. Treg cells, regulatory T cells. Mit., mitotic. d, The relative abundance of seven dominant T cell clonotypes across immune phenotypes. e, Schematic of cytotoxic T cell attack creating calcium-permeable pores in the tumour cell membrane, which triggers green fluorescence of the GCaMP6 calcium sensor in the tumour cell. f, Representative images of KPP-mTagBFP2-GCaMP6 STAMP tumours with the inflamed (top) or excluded (bottom) immune phenotype. n = 6 tumours. Red, T cells; green, GCaMP6. g, Time projection GCaMP6 fluorescent flashes of the tumour described in f. h, Correlation analysis of the GCaMP6 flashing index at 8 days after tumour implantation and the tumour growth fold change between day 8 and day 13 for immune-inflamed and immune-excluded tumours described in f. Pearson correlation was computed assuming a normal distribution. Statistical analysis was performed using two-tailed t-tests. i, Kaplan–Meier curve showing the survival probability of individual tumours of KPP-eGFP arrays that were immune phenotyped as immune-desert, immune-excluded or immune-inflamed by imaging 8 days after tumour implantation. n = 632 tumours, n = 10 mice. Statistical analysis was performed using a log-rank test (referenced to excluded tumours). For f and g, scale bars, 100 μm (inflamed) and 200 μm (excluded). Source Data
Fig. 3
Fig. 3. Myeloid and stromal cells control TIP and tumour fate.
a, The relative abundance of myeloid cell subclusters as determined by scRNA-seq analysis of STAMP tumour biopsies pooled by immune phenotype. DCs, dendritic cells; moDCs, monocyte-derived dendritic cells; mregDCs, mature DCs with immunoregulatory molecules; pDCs, plasmacytoid dendritic cells. b, The experimental design relating to ce. Neutrophils or monocytes were ablated using depleting antibodies (Gr1 or Ly6C, respectively) beginning 3 days before STAMP implantation of KPP-eGFP tumour arrays in E8I CD8-cre LSL-tdTomato immunocompetent mice. n = 6 isotype-control-treated mice, n = 319 tumours; n = 5 neutrophil-depleted (neut. depl.) mice, n = 187 tumours; n = 5 monocyte-depleted (mono. depl.) mice, n = 301 tumours. c, The survival probability of individual tumours of KPP-eGFP arrays related to b. The centre line shows the Kaplan–Meier curve and the shaded area shows the 95% confidence interval. Statistical analysis was performed using log-rank tests (referenced to the isotype control). d, Representative image of STAMP tumour arrays of non-depleted (left) neutrophil-depleted (middle) or monocyte-depleted (right) mice related to b at 11 days after tumour implantation. Red, T cells; green, KPP-eGFP. Scale bars, 2 mm. e, The proportion of immune-inflamed, immune-excluded and immune-desert tumours related to bd. f, The relative abundance of fibroblast subclusters determined by scRNA-seq analysis of STAMP tumour biopsies pooled by immune phenotype. g, The experimental design relating to hj. DPT+ fibroblasts  were ablated by tamoxifen and diphtheria toxin administration in Dpt-cre-ERT2 LSL-DTR mice before STAMP implantation of KPP-eGFP tumour arrays into mice reconstituted with tdTomato+ T cells. n = 5 control mice, n = 207 tumours; n = 7 fibroblast-depleted mice, n = 314 tumours. h, Representative image of STAMP tumour arrays of control (top) or fibroblast-depleted (bottom) mice at 11 days after tumour implantation. Red, T cells; green, KPP-eGFP. Scale bars, 1 mm. i, The proportion of Immune-inflamed, immune-excluded and immune-desert tumours related to g. j, Flow-cytometry-based monocyte and dendritic cell profiling of tumours in fibroblast-depleted versus control non-depleted mice related to g. Data are mean ± s.e.m. Statistical analysis was performed using a two-tailed Mann–Whitney U-test. Source Data
Fig. 4
Fig. 4. Early transition to an immune-inflamed phenotype predicts tumour response to immunotherapy.
a, The experimental design relating to the experiments shown in bf. KPP-eGFP STAMP tumour arrays were implanted into RAG2-deficient mice reconstituted with tdTomato+ T cells and treated at day 2 after implantation with isotype control antibodies (n = 554 tumours, n = 9 mice), anti-TGFβ (n = 287 tumours, n = 5 mice), anti-PD-L1 (n = 399 tumours, n = 6 mice), or a combination of anti-PD-L1 and anti-TGFβ (n = 642 tumours, n = 11 mice). b, The survival probability of individual tumours of KPP-eGFP arrays related to a. Statistical analysis was performed using a log-rank test (referenced to the isotype control). c, Hierarchical clustering of individual tumour trajectories related to a, showing immune phenotypes over time for tumours treated with isotype control or a combination of anti-PD-L1 and anti-TGFβ antibodies. Black, tumour resolved; white, mouse death/euthanasia; cyan, combination-treated responders (complete responders and partial responders (CR/PR)); magenta, combination-treated non-responders (stable disease and progressive disease (SD/PD)); blue, control responders (CR/PR); red, control non-responders (SD/PD). d, Markov chain showing the fold difference in the probabilities of transition between TIPs for combination anti-PD-L1/anti-TGFβ treatment versus the control condition. Bold indicates increased transition. Blue indicates decreased transition. ‘×’ is the fold change. e, Unsupervised clustering of individual tumour immune trajectories highlighting changes in T cell abundance and infiltration ratio over time. n = 6 isotype-treated control mice. n = 321 tumours. The median immune trajectory for each of the three identified classes is shown in bold, and the colour scale indicates time. The survival probability of individual tumours grouped by immune-trajectory class is shown at the bottom right. Statistical analysis was performed using a log-rank test (referenced to class I tumours). f, Immune trajectories of individual tumours grouped by treatment related to a. Median immune trajectories are shown in bold, and the colour scale indicates time. In b and the bottom right of e, the centre line shows the Kaplan–Meier curve and the shaded area shows the 95% confidence interval. Source Data
Extended Data Fig. 1
Extended Data Fig. 1. Implantation, inflammatory response, and growth analysis of STAMP microtumours.
a, Image of (i) ears after P.L.E.A.S.E.® Laser microporation, (ii) microporated ears covered with tumour cell suspension, (iii) microporated ear seeded with tumour cells and covered with Matrigel. b, Representative tumour arrays of different tumour cell lines, n ≧ 10 animals per group. c, Representative time course image series of orthotopic B16F10 model cell line growing in STAMP. n = 5 animals. d, Manual analysis of growth kinetics of individual B16F10 STAMP tumours using ellipsoid formula to calculate volumes over time (upper panel) and using tumour segmentation to calculate area over time (lower panel). n = 27 tumours, 2 animals pooled. e, Representative tumour segmentation performed on validation images. (i) Input images, (ii) manually generated classification mask, (iii) features extracted after the penultimate upsampling step, (iv) output segmentation mask. f-h, Validation of the high content image analysis pipeline. f, Manual analysis of growth kinetics of individual KPP-EGFP tumour volumes (mm3) using the ellipsoid formula. g, Manual analysis of growth kinetics of individual tumour areas (mm2) using tumour segmentation. h, Automated analysis of growth kinetics of individual tumour areas (mm2), f-h, n = 72 tumours, 3 animals pooled. i, Lymphoid and myeloid immune cell profiling of STAMP tumour array and subcutaneous tumours of KPP-EGFP cancer cells 18 days post tumour implantation and pooled. n = 6 ears, n = 3 mice for STAMP. n = 5 mice for subcutaneous tumours. j, Lymphoid and myeloid immune cell profiling of PBS or KPP-EGFP-seeded micropores. STAMP tumour arrays were harvested 18 days post tumour implantation and pooled by ear. n = 16 ears, n = 8 mice. Data are mean +/− s.d. Statistical analysis was performed using a two-tailed Mann-Whitney U-test. P values are shown in the graph. k, Principal Component Analysis (PCA) of the 200 most variable genes of the RNA-seq data from healthy skin, pores and KPP-EGFP microtumours biopsied at day 1, day 3 and day 8 after tumour seeding and/or laser poration. Samples are coloured according to day and experimental group (tumour, pores and healthy skin). Ellipses at 95% confidence level are shown for each group. The percentage of explained variance for each principal component is annotated on the principal component axes. j, Heatmap of the z-scored gene expression values for Tnf, Il6, Il1b. Columns are annotated as in k and rows are hierarchically clustered to show genes with similar patterns of expression across the samples. Source Data
Extended Data Fig. 2
Extended Data Fig. 2. KPP STAMP microtumour rejection is mediated by tumour antigen specific CD8 T cells.
a, Automated analysis of growth kinetics of KPP-EGFP total tumour array area (mm2) per animal in Rag-2-deficient and wild type animals as described in Fig. 1b, n = 5 animals per group. b, Representative images of KPP-EGFP tumour arrays in wild type (upper panel) or Rag-2-deficient (lower panel) mice at 6 and 14 days post tumour implantation related to b. Red encircled tumours are rejected and white encircled tumours are persistent between time points. c, Survival probability of individual tumours of KPP-EGFP arrays in mice treated with CD8 depleting (n = 318 tumours, 5 animals) or isotype control antibodies (n = 534 tumours, 5 animals). d, Automated analysis of growth kinetics of individual tumour area (mm2) for experiment as described in Fig. 1d. Red lines indicate tumours that are rejected, grey lines indicate tumours that persist. n = 100 tumours, n = 5 animals in Rag-2-deficient animals reconstituted with WT T cells, n = 88 tumours, n = 5 animals in Rag-2-deficient animals reconstituted with OT-I T cells. e, Representative images of STAMP tumour arrays for experiment as described in d. Red = T cells, green = KPP-EGFP. f, T cell infiltration kinetics of individual tumours measured by tdTomato MFI of T cells for experiment as described in d. n = 5 animals per group, n = 61 tumours in Rag-2-deficient animals reconstituted with WT T cells and n = 53 tumours in Rag-2-deficient animals reconstituted with OT-I T cells. Data are mean +/− s.e.m. Statistical analysis was performed using a two-tailed Mann-Whitney U-test. g, Representative image time course of KPP-OVA-EGFP tumour arrays in Rag-2-deficient animals reconstituted with wild type or OT-I T cells. n = 4 animals reconstituted with WT T cells, n = 5 animals reconstituted with OT-I T cells, n = 156 tumours in animals reconstituted with WT T cells, n = 93 tumours in animals reconstituted with OT-I T cells. Red = T cells, green=KPP-EGFP. h, Survival probability of individual tumours from mice bearing KPP-EGFP-OVA tumour in Rag-2-deficient animals reconstituted with wild type or OT-I T cells and treated with CD8 depleting or isotype control antibody. n = 4 WT-OVA isotype, n = 5 OT-I-OVA isotype and n = 5 OT-I-OVA anti-CD8 treated animals per group, n = 93 OT-I-OVA isotype, n = 156 WT-OVA isotype and n = 206 OT-I-OVA anti-CD8 treated tumours. Statistical analysis was performed with log-rank test (referenced to WT-OVA isotype). i, Frequency of tumour antigen (M86) specific T cells in M86-encoding RNA-LPX vaccinated or naive T cell donor mice shown as PD-1+ percent of CD8+ activated memory T cells. j, Survival probability of individual tumours from mice bearing KPP-M86-mTagBFP2 microtumours in Rag-2-deficient mice reconstituted with tumour antigen specific T cells (M86) from vaccinated mice or T cells from naive mice. n = 73 tumours in vaccinated animals, n = 72 tumours in naive animals, 4 animals per group pooled. c,f,h,i, P values are shown in the graph and colour-coded for the treatment group in h. c,h,j, The centre line shows the Kaplan-Meier curve, the shaded area shows the 95% confidence interval. Statistical analysis was performed with log-rank test. Source Data
Extended Data Fig. 3
Extended Data Fig. 3. Transcriptionally distinct lesions with inflamed, excluded, and desert immune phenotypes coexist in tumour arrays.
a, PCA of the top 1000 most variable genes of the bulk RNA-seq data of individually biopsied tumours with differential immune phenotype inflamed, desert, excluded. Ellipses at 95% confidence level are shown for each group. The percentage of explained variance for each principal component is annotated on the principal component axes. b, Detailed GSEA for selected pathways that are significantly enriched between three different immune phenotypes (inflamed, desert, excluded) from STAMP tumours. c, Representative STAMP tumour array of KPP-EGFP in Foxn1-Nude mice reconstituted with tdTomato +  T cells at 8 days post tumour implantation. Magenta = T cells, cyan = KPP-EGFP. n = 5 animals. d, Proportion of immune phenotypes present in STAMP arrays of three murine tumour models. NSCLC = non-small cell lung cancer (n = 175 tumours, n = 2 animals), KPP = pancreatic ductal adenocarcinoma (n = 240 tumours, n = 4 animals), and B16F10 = melanoma (n = 229 tumours, n = 4 animals). e, Representative images of STAMP tumour arrays of KPP-EGFP on abdominal skin of Rag-2-deficient mice reconstituted with tdTomato T cells, 8 days post tumour implantation, Red = T cells, green = KPP-EGFP. Overview of the entire abdominal tumour array (left panel), enlarged images of neighbouring tumours with inflamed, excluded, and desert immune phenotypes (right panels). n = 3 animals. f, Representative images of experimental lung metastases of KPP-EGFP in Rag-2-deficient mice reconstituted with tdTomato T cells, 8 days post tumour implantation. Red = T cells, green = KPP-EGFP. Overview of the entire lung lobe (left panel), enlarged images of metastatic lesions with inflamed, excluded, and desert immune phenotypes (right panel). n = 3 animals. Source Data
Extended Data Fig. 4
Extended Data Fig. 4. Inflamed, excluded, and desert immune phenotypes are not predetermined by genetic or non-genetic heterogeneity in the in vitro cultured cell line.
a, Histogram depicts variant allele frequency (VAF) detected by whole exome sequencing of the KPP-EGFP cell line before implantation. n = 3 replicates indicated by colour with a corresponding dashed line showing the median VAF of the distribution. Homozygous and the heterozygous peaks indicated by black dashed lines. b, Neutrality test of low frequency variants for each replicate in a. The coefficient of determination (R2) is shown to indicate goodness of fit. The ratio of the mutation rate (μ) and the effective division rate (β) is the slope of the least squares fitted line according to the neutral cumulative mutation distribution. c, UpsetR plot showing the number of potentially explanatory variants detected by whole exome sequencing of pooled tumour biopsies with different immune phenotypes (x-axis). Variants have been confirmed after manual curation using detailed inspection of the alignment reads with Integrative Genome Viewer. d, UMAP embedding showing the KPP tumour cell clusters of scRNA sequencing data from in vitro cultured cells pre-implantation in STAMP. e, UMAP embedding showing the KPP tumour cell clusters of scRNA sequencing data from in vivo STAMP tumours post-implantation. f, Alluvial plot depicting the relationship between single cells from KPP-EGFP post implantation and its corresponding phenotypes together with the most likely in vitro cluster assignment as determined by SingleR.
Extended Data Fig. 5
Extended Data Fig. 5. Desert, excluded or inflamed phenotypes are infiltrated by similar proportions of T cell subsets and clonotypes.
a, UMAP embedding of tdTomato+ T cell subclusters (indicated by colours) from pooled STAMP tumour biopsies. b, Dot plot showing the relative expression of important marker genes within T cell subclusters. Relative expression level indicated by colour, and percent of cells expressing the transcript indicated by circle size. c, Relative abundance for each T cell subcluster separated by immune phenotype. d, Flow cytometry-based T-lymphoid immune cell profiling of rejected, inflamed, excluded and desert tumours at day 10. Absolute frequency of CD3, CD4 and CD8 T cells (upper plot) and proportion of naive, activated/resident, effector memory, and central memory of CD4 or CD8 T cells (lower plot). n = 6 animals with 3 tumours pooled per phenotype per animal. Data are mean +/−s.d. Statistical analysis was performed using a two-tailed t-test. P values are shown at the top of the graph. e, TCR clonotype diversity indices for each immune phenotype. f, Cell number of each T cell clonotype with cluster identification. g, Pathway analysis comparing excluded vs inflamed for combined top clonotypes. p-values were fdr adjusted and reported if p-value adjusted < 0.1. Source Data
Extended Data Fig. 6
Extended Data Fig. 6. Spatial T cell patterns dictate efficiency of anti-tumour attack.
a-b, Representative in vitro time-lapse image series of KPP-GCaMP6-Her2-expressing tumour organoids cultured with TdTomato T cells in the absence (a) or presence (b) of anti-Her2/anti-CD3 T cell-dependent bispecific antibody (TDB). Green = GCaMP6, red = propidium iodide, magenta = T cells. n = 3 biological replicates. Representative trace showing flashing behaviour (delta MFI) of GCaMP6 (blue) and influx of PI (red) fluorescence over time in the absence (control, light colour) or presence (TDB, dark colour) of TDB as described in a and b. c, Average GCaMP6 deltaMFI (blue) and average PI deltaMFI (red) plotted against the time (min) in the absence (control, light colour) or presence (TDB, dark colour) of TDB as described in a and b. Data are mean +/− s.e.m. d, GCaMP6 flashing index in the absence (control) or presence of TDB as described in a and b. Data are mean +/− s.e.m. Statistical analysis was performed using a one-tailed Mann-Whitney U-test. e, PI influx in the absence (control) or presence of TDB as described in a and b. Data are mean +/− s.e.m. Statistical analysis was performed using a one-tailed Mann-Whitney U-test. f, Representative in vivo 2-photon time-lapse images of KPP-GCaMP6-mTagBFP2-Her2 STAMP tumours in Rag-2-deficient mice 12 days after tumour cell seeding and adoptive transfer of tdTomato+ T cells. Imaging before intravenous (I.V.) administration of TDB (upper panel, n = 3 animals), and after I.V. administration of TDB (lower panel, n = 2 animals). Green = GCaMP6 (KPP), blue = mTagBFP2 (KPP), red = tdTomato (T cells). g. GCaMP6 flashing index of STAMP tumours before TDB or after TDB administration, as described in f. Green = GCaMP6 (KPP), blue = mTagBFP2 (KPP), red = tdTomato (T cells). The centre line shows the median, the box limits show the minimum and maximum values. h, Representative in vivo 2-photon time-lapse images of KPP-GCaMP6-mtagBFP2-Her2 STAMP tumours in Rag-2-deficient mice with (upper panel) or without (lower panel) reconstitution with tdTomato + T cells and 12 days after tumour cell seeding. Green = GCaMP6 (KPP), blue = mTagBFP2 (KPP), red = tdTomato (T cells). n ≧ 3 animals. i, GCaMP6 flashing index of STAMP tumours in Rag-2-deficient mice with and without adoptive transfer of tdTomato+ T cells, as described in h. The centre line shows the median, the box limits show the minimum and maximum values. Statistical analysis was performed using a two-tailed Mann-Whitney U-test. j, T cell abundance (MFI) of inflamed and excluded KPP-GCaMP6-mtagBFP2-Her2 STAMP tumours in Rag-2-deficient mice 8 days after tumour cell seeding and adoptive transfer of tdTomato+ T cells. n = 6 excluded and n = 15 inflamed tumours. Data are mean +/− s.e.m. Statistical analysis was performed using a two-tailed Mann-Whitney U-test. k, GCaMP6 flashing index of inflamed and excluded STAMP tumours, as described in j. Data are mean +/− s.e.m. Statistical analysis was performed using a two-tailed Mann-Whitney U-test. l, Representative in vivo epifluorescence time-lapse images of GCaMP6-expression of inflamed KPP tumours. n = 15 tumours. Green = GCaMP6. m, Representative in vivo epifluorescence time-lapse images of GCaMP6-expression of excluded KPP tumours. n = 6 tumours. Green = GCaMP6. d, e, i, j, k, P values are shown at the top of the graph. Source Data
Extended Data Fig. 7
Extended Data Fig. 7. Myeloid depletion reduces T cell recruitment and transition towards inflamed phenotype.
a, STAMP scRNA-seq atlas UMAP embedding of innate, myeloid, and stromal cell clusters from STAMP single tumour biopsies pooled per immune phenotype. b, UMAP embedding for the myeloid compartment of the scRNA from single tumour biopsies pooled per immune phenotypes. c, Dot plot for expression of Cxcl9 and Cxcl10 across all cell clusters of the scRNA sequencing STAMP tumour atlas described in a. d, Flow cytometry-based myeloid cell profiling of 5 pooled tumour biopsies per immune phenotype at 10 days post tumour implantation. n = 6 animals. Data are mean +/− s.e.m. Statistical analysis was performed using a two-tailed Mann-Whitney U-test. P values are shown at the top of the graphs. e, Scores of myeloid signatures in bulk RNA-seq of tumours at 8 days post-implantation. n = 7 tumours per group (gene signatures for each myeloid population have been derived from the scRNA-seq myeloid STAMP Atlas). Box plots show quartiles of the dataset and whiskers show the rest of the distribution. Statistical analysis was performed using a two-tailed t-test with unequal variances, adjusted for false discovery rate. P values are at the top of the graphs. f. Total T cell abundance in individual tumours over time in control, Ly6C- and Gr1-depleted animals as described in Fig. 3b, n = 6 Isotype control-treated animals, n = 5 Ly6c- and n = 5 Gr1-depleted animals, n = 319 Isotype control-treated, n = 301 Ly6c- and n = 187 Gr1-depleted tumours. Box plots show quartiles of the dataset and whiskers show the rest of the distribution, excluding points determined to be outliers by exceeding 1.5x the interquartile range. Statistical analysis was performed using a two-tailed t-test (referenced to Isotype control treated tumours). P values are shown in the graph. g, Analysis of immune phenotype transition dynamics of tumours in Isotype control-treated, Ly6C- and Gr1-depleted animals related to f. Arrows represent fold changes in transition likelihood between control and depleted animals. Black = increased transition, blue = decreased transition. Source Data
Extended Data Fig. 8
Extended Data Fig. 8. Depletion of Dpt+ fibroblasts promotes immune desert phenotype in STAMP.
a, UMAP embedding for the fibroblast compartment for the scRNA from pooled single tumour STAMP biopsies. b, Dermatopontin (Dpt) expression overlaid on the fibroblast UMAP. c, Violinplot showing the expression levels of Dpt across fibroblast subclusters. d, Barplot showing the relative abundance of the fibroblast subclusters for microporated skin. e, Quantification of fibroblast frequency in skin of Dpt-CreERT2_LSL-DTR-YFP mice with and without Tamoxifen and/or Diphtheria toxin (DTX) treatment. n = 4 Tamoxifen/DTX-treated Control mice, n = 4 Tamoxifen-treated DTR-YFP mice and n = 5 Tamoxifen/DTX-treated DTR-YFP mice. Data are mean +/− s.e.m. Statistical analysis was performed using a two-tailed Mann-Whitney U-test. f, Total T cell abundance in individual tumours over time in control and Dpt-depleted animals as described in Fig. 3h. n = 5 control and n = 7 Dpt-depleted animals, n = 207 control and n = 314 Dpt-depleted tumours. Box plots show quartiles of the dataset and whiskers show the rest of the distribution, excluding points determined to be outliers by exceeding 1.5x the interquartile range. Statistical analysis was performed using a two-tailed t-test. g, Analysis of immune phenotype transition dynamics of tumours in Dpt-depleted animals related to f. Arrows represent fold changes in transition likelihood between control and depleted animals. Black = increased transition, Blue = decreased transition. h, Dot plot for expression of ligand-receptor pairs of the main secreted factors of the ChemoCAF for all of the fibroblast and myeloid populations from the scRNA sequencing STAMP tumour atlas. i-j, Communication probability estimated by CellChat for i, CXCL chemokine pathway with fibroblasts subclusters as the sender populations and myeloid subclusters as the receiver and j, CCL chemokine pathway with fibroblasts subclusters as the sender populations and myeloid subclusters as the receiver. k-l, Flow cytometry-based immune cell profiling of tumours in Dpt-depleted versus non-depleted animals. n = 6 control animals and n = 8 DTR animals. Data are mean +/− s.e.m. Statistical analysis was performed using a two-tailed Mann-Whitney U-test. k, Shows cell types with no significant change upon depletion. l, Shows cell types with significant differences between control and depletion. e,f,k,l, P values are shown at the top of the graphs. Source Data
Extended Data Fig. 9
Extended Data Fig. 9. Early transition to an inflamed phenotype predicts tumour response to immunotherapy.
a, Histology of patient paired tumour biopsies at baseline and at progression after treatment with checkpoint blockade. CD8 staining in brown, pan-cytokeratin staining in magenta. b, Individual tumour growth kinetics of KPP-GFP STAMP tumours for experiment with immune reconstituted animals described in Fig. 4a. c-d, STAMP arrays of KPP-EGFP were implanted in immunocompetent animals and treated 10 days post-implantation with isotype control antibodies (n = 130 tumours, 4 animals), anti–PD-L1 (n = 94 tumours, 4 animals), anti–TGF-β (n = 61 tumours, 3 animals) or a combination of anti–PD-L1 with anti–TGF-β (n = 99 tumours, 4 animals). c, Individual tumour growth kinetics (mm2) shown with coloured lines to indicate tumours that are rejected and grey lines to indicate tumours that persist. d, Survival probability of individual tumours described for c and d. The centre line shows the Kaplan-Meier curve, the shaded area shows the 95% confidence interval. Statistical analysis was performed with log-rank test. P value is shown in the graph and colour-coded for the treatment group. e, Image series of individual STAMP tumour over time. Red = T cells, blue = tumour cells. f, Quantification of median radial fluorescence profile for individual tumour shown in e to distinguish non-desert, T cell excluded phenotype (low T cell infiltration ratio, day 11) and T cell inflamed phenotype (high T cell infiltration ratio, day 15). g, Overlay of the automated classification of immune phenotypes with the individual tumour growth curve for the example in e. h, Hierarchical clustering of individual tumour immune growth rates (left) and T cell infiltration (right) for isotype control treated tumours and combo anti–PD-L1/anti–TGF-β treated tumours as described in Fig. 4a. Black = tumour resolved, white = mouse death/euthanasia. Cyan=combination treated responders (C.R. + P.R.), magenta = combination treated non-responders (S.D. + P.D.), blue = Control responders (C.R.+ P.R.), red = control non-responders (S.D. + P.D.). Source Data
Extended Data Fig. 10
Extended Data Fig. 10. Early transition to an inflamed phenotype predicts tumour response to immunotherapy.
a-c, Total T cell abundance (tdTomato MFI) for individual microtumours as described in Fig. 4a. Isotype control antibodies (n = 554 tumours, 9 animals, grey dots), a, anti–PD-L1 (n = 399 tumours, 6 animals, yellow dots), b, anti– TGF-β (n = 287 tumours, 5 animals, orange dots), or a c, combination of anti–PD-L1 with anti–TGF-β (n = 642 tumours, 11 animals, red dots). Box plots show quartiles of the dataset and whiskers show the rest of the distribution, excluding points determined to be outliers by exceeding 1.5x the interquartile range. Statistical analysis was performed using a two-tailed Mann-Whitney U-test. P values are shown in the graphs. d, Immune-histories of individual KPP-GFP STAMP tumours (grey lines) implanted in E8I.CD8A.Cre-Rosa26.LSL.tdTomato animals and treated at day 10 post-implantation with isotype control antibodies or combo anti-PD-L1/anti-TGF-b. n n ≧ 86 tumours per group and 3-4 animals per group. Average tumour trajectory changing T cell abundance (y-axis) and inflammation ratio (x-axis) over time for each treatment condition is shown in bold, with colour scale indicating time. e, Immune-histories for individual tumours of combination treated animals grouped as responders or non-responders for experiment described in Fig. 4a. Average immune-history for each class is shown in bold, with colour scale indicating time. f, Graphical summary of immune dynamics leading to tumour rejection or progression. Source Data

References

    1. Chen DS, Mellman I. Elements of cancer immunity and the cancer–immune set point. Nature. 2017;541:321–330. - PubMed
    1. Galon J, Bruni D. Approaches to treat immune hot, altered and cold tumours with combination immunotherapies. Nat. Rev. Drug Discov. 2019;18:197–218. - PubMed
    1. Galon J, et al. Type, density, and location of immune cells within human colorectal tumors predict clinical outcome. Science. 2006;313:1960–1964. - PubMed
    1. Bruni D, Angell HK, Galon J. The immune contexture and immunoscore in cancer prognosis and therapeutic efficacy. Nat. Rev. Cancer. 2020;20:662–680. - PubMed
    1. Tumeh PC, et al. PD-1 blockade induces responses by inhibiting adaptive immune resistance. Nature. 2014;515:568–571. - PMC - PubMed

Publication types

Substances