. 2023 Jun;618(7966):842-848.
doi: 10.1038/s41586-023-06133-1. Epub 2023 May 31.

Engineered tRNAs suppress nonsense mutations in cells and in vivo

Affiliations

Engineered tRNAs suppress nonsense mutations in cells and in vivo

Suki Albers et al. Nature. 2023 Jun.

Abstract

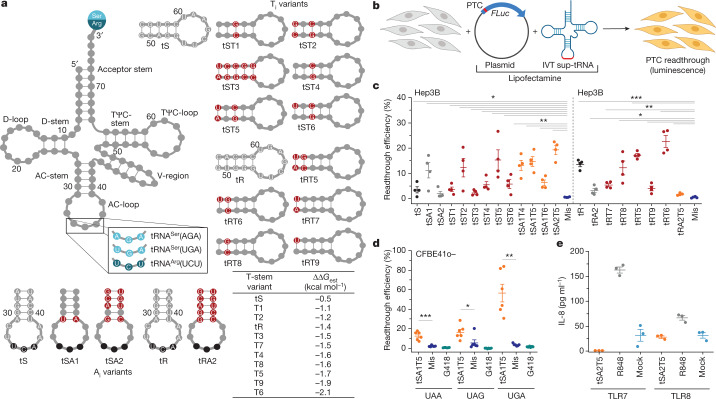
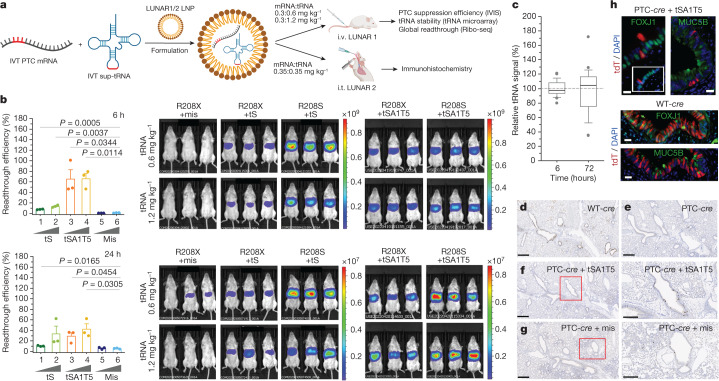
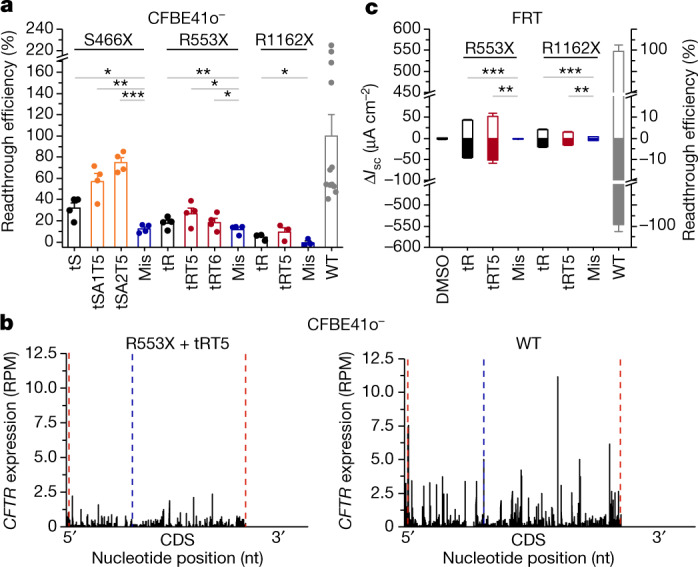
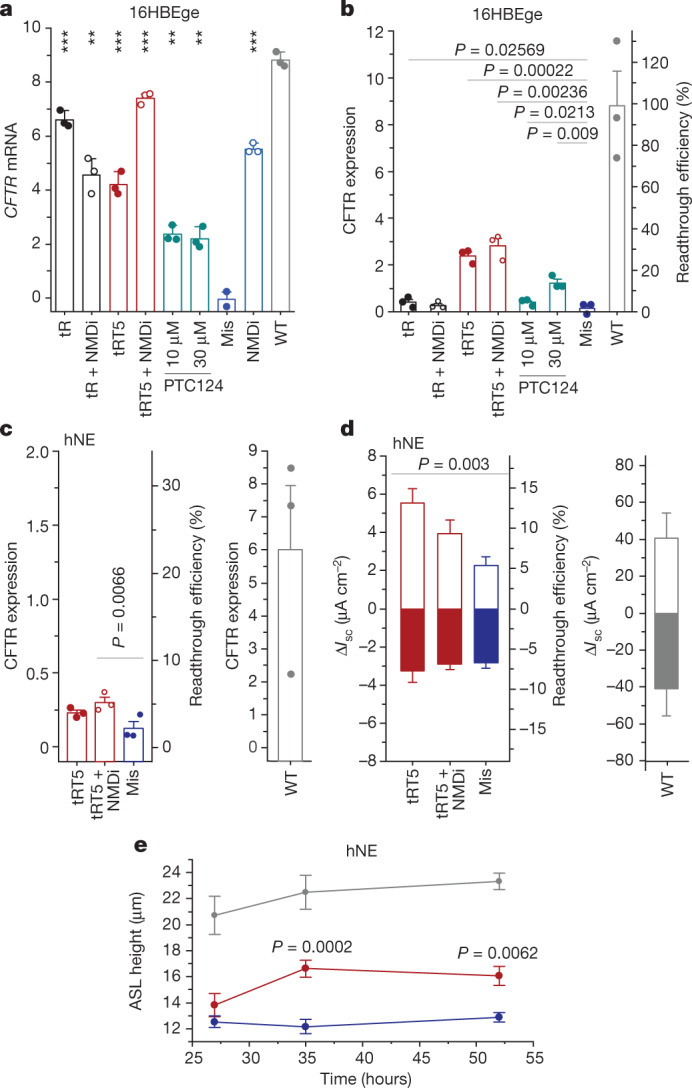
Nonsense mutations are the underlying cause of approximately 11% of all inherited genetic diseases1. Nonsense mutations convert a sense codon that is decoded by tRNA into a premature termination codon (PTC), resulting in an abrupt termination of translation. One strategy to suppress nonsense mutations is to use natural tRNAs with altered anticodons to base-pair to the newly emerged PTC and promote translation2-7. However, tRNA-based gene therapy has not yielded an optimal combination of clinical efficacy and safety and there is presently no treatment for individuals with nonsense mutations. Here we introduce a strategy based on altering native tRNAs into efficient suppressor tRNAs (sup-tRNAs) by individually fine-tuning their sequence to the physico-chemical properties of the amino acid that they carry. Intravenous and intratracheal lipid nanoparticle (LNP) administration of sup-tRNA in mice restored the production of functional proteins with nonsense mutations. LNP-sup-tRNA formulations caused no discernible readthrough at endogenous native stop codons, as determined by ribosome profiling. At clinically important PTCs in the cystic fibrosis transmembrane conductance regulator gene (CFTR), the sup-tRNAs re-established expression and function in cell systems and patient-derived nasal epithelia and restored airway volume homeostasis. These results provide a framework for the development of tRNA-based therapies with a high molecular safety profile and high efficacy in targeted PTC suppression.


Conflict of interest statement

Z.I., S.A., N.B. and M.D. are inventors on patents related to tRNA designs for PTC correction. Z.I. is also a scientific advisor for Tevard Biosciences. S.M.R. and G.J.T. are named on an unlicensed patent on the use of OCT for airway surface liquid measurements. S.M.R. is named on an unrelated patent on translational readthrough pharmacotherapy. E.J.S. is a non-voting board member of the Cystic Fibrosis Foundation. The LUNAR technology is proprietary to Arcturus Therapeutics. E.C.A., C.G.P.-G., R.M., B.M., K.K., M.A., K.J.-J.P., G.A., J.A.G., A.S., K.T., P.K., D.M. and P.C. are employees and have securities from Arcturus Therapeutics. The other authors declare no competing interests.

Figures

Fig. 1
Fig. 1. Sup-tRNA variants suppress different PTCs at Ser and Arg codons.
a, Schematic of a generic tRNA with the natural anticodon of human tRNASerUGA, tRNASerAGA or tRNAArgUCU (left). Nucleotide substitutions in the anticodon (AC)-stem (Ai variants; bottom) or the TΨC-stem (Ti variants; right) of tS or tR variants are highlighted in red. The table shows estimated ΔΔG values for binding affinities of eEF1A to the TΨC-stem. b, Schematic of the screening of sup-tRNAs with plasmid constructs encoding firefly luciferase (FLuc) with a PTC mutation (PTC-FLuc). IVT, in vitro-transcribed tRNA. c, Suppression efficacy of tS or tR variants in human liver Hep3B cells at FLuc(R208X) (in which X represents UGA), normalized to wild-type FLuc. Mis, mismatch tRNA. Data are mean ± s.e.m. (n = 4 independent replicates). d, tSA1T5 targets PTCs with different stop codon identities, as tested with Fluc(S466X) in human bronchial epithelial CFBE41o cells and normalized to wild-type FLuc. G418 (geneticin) is a low molecular mass readthrough-promoting agent. Data are mean ± s.e.m. (n = 6 independent replicates). e, TLR-dependent activation by tSA2T5 was monitored in human TLR-transformed HEK293 cells. R848 agonist, which activates both TLR7 and TLR8, served as a positive control. Mock, mock-transfected cells. Data are mean ± s.e.m. (n = 3 independent replicates). *P < 0.05, **P < 0.01, ***P < 0.001. One-sided t-test. Source Data
Fig. 2
Fig. 2. In vivo PTC suppression by LUNAR-encapsulated sup-tRNAs in mice.
a, Workflow of intravenous (i.v.) or intratracheal (i.t.) administration of LUNAR LNPs with co-encapsulated PTC reporter mRNA and sup-tRNA. For intravenous administration, aLucR208X (X represents UGA) reporter and two different concentrations of tS or tSA1T5 were administered in Balb/C mice. For intratracheal administration, PTC-cre reporter (S69X/S82X, where X represents UGA) and tSA1T5 were administered in transgenic flox-tdTomato mice. Ribo-seq, ribosome sequencing. b, Quantification of the PTC readthrough (left) represented as a ratio of the signal from aLuc(R208X) mice relative to the corresponding aLuc(R208S) mice treated with sup-tRNA from IVIS in vivo images (right). Groups 1–6 were co-administered with aLucR208X mRNA. Groups 1, 3, 5: 0.6 mg kg−1 sup-tRNA; groups 2, 4, 6: 1.2 mg kg−1 sup-tRNA. The mean value of the corresponding aLuc(R208S) plus sup-tRNA group is set to 100%. Data are mean ± s.e.m. (n = 3 per group). One-sided t-test. c, sup-tRNA stability in liver monitored with tRNA microarrays represented as a box plot (36 probes on each array, n = 2 independent replicates) normalized to the mean of the signal at 6 h after intravenous administration, which is set as 100% (horizontal line). The centre line indicates the median, box edges bound 10th to 90th centiles, and whiskers represent the range of the remaining data without exclusion of outliers. dg, Bright-field immunohistochemistry showing tdTomato expression (dark brown spots) in lungs from transgenic mice treated with LUNAR2 LNPs carrying a wild-type cre (WT-cre) (d), PTC-cre (e) or PTC-cre with tSA1T5 treatment (f) or mismatch tRNA (g). In f,g, images on the right are magnified views of the outlined region in the left image. n = 4 mice in each group (Extended Data Fig. 7). Scale bars, 500 µm; magnified images (f, g, right), 300 µm. h, Immunofluorescence of tdTomato (tdT) and ciliated (FOXJ1) and secretory (MUC5B) epithelial cell markers in a mouse dosed with a LUNAR2 formulation carrying wild-type cre or PTC-cre with tSA1T5 treatment. Nuclei were counterstained with DAPI. Scale bars, 25 µm. Source Data
Fig. 3
Fig. 3. PTC suppression and restoration of mRNA translation and protein function in cell models.
a, Efficacy of tS and tR variants in restoring expression of full-length CFTR from CFTR(S466X), CFTR(R533X) or CFTR(R1162X) (where X represents the UGA codon) in CFBE41o cells, monitored by immunoblot (Extended Data Fig. 9a). Full-length CFTR (band C) expression is normalized to that in CFBE41o cells with wild-type CFTR. Data are mean ± s.e.m. S466X and R553X: n = 4; R1162X: n = 3; wild type: n = 12 independent replicates). One-sided t-test. b, Ribosome density profile of tRT5-suppressed CFTRR553X mRNA translation monitored by ribosome profiling (total expression, 27 reads per kilobase per million mapped reads (RPKM)) compared with wild-type CFTR mRNA (129 RPKM) in CFBE41o cells. Red dashed lines denote the start and stop of CFTR coding sequence (CDS); blue dashed line denotes the first nucleotide of the UGA PTC. RPM, reads per million mapped reads. c, Short-circuit current (ΔIsc) of CFTR(R553X)- and CFTR(R1162X)-expressing FRT cell monolayers transfected with tR or tRT5 compared with cells expressing wild-type CFTR. Positive values (white bars) indicate ΔIsc following CFTR activation (with forskolin and VX-770) and negative (solid bars) indicate ΔIsc following CFTR inhibition (with Inh-172 inhibitor). Data are mean ± s.e.m. DMSO: n = 5; R553X, mismatch, n = 5; R553X, tRT5: n = 4; R553X, tR: n = 3; R1162X, tRT5: n = 4; R1162X, mismatch: n = 4; R1162X, tR: n = 7; wild type: n = 3 independent replicates. One-sided t-test. For gel source data, see Supplementary Fig. 1. Source Data
Fig. 4
Fig. 4. Restoration of CFTR expression and activity by outcompeting NMD.
a,b, Efficacy of tR or tRT5 with or without NMD inhibitor (NMDi, 5 µM NMD14) compared with treatment with PTC124 in augmenting CFTR mRNA (a) or CFTR(R1162X) protein (b; band C) expression in 16HBEge cells (cells were wild type or CFTRR1162X/−, where X represents UGA). a, CFTR mRNA level was normalized to that in untreated cells. b, Band C intensity was normalized to the total protein (left y-axis) and to wild-type CFTR (right y-axis). Data are mean ± s.d. of n = 2 independent replicates for mismatch (a) and mean ± s.e.m. of n = 3 independent replicates for all other data in a,b. One-sided t-test. c, Left, efficacy of tRT5 with and without NMD inhibitor (5 µM NMD14) for restoration of CFTR protein expression (band C is normalized to total protein (left y-axis)) in CFTRR1162X/R1162X hNE cells (X represents UGA), monitored by immunoblot. Right, CFTR expression in hNE cells from non-cystic fibrosis individuals who are wild-type for the CFTR gene. Data are mean ± s.e.m. (n = 3 independent replicates) and are shown as a percentage of the mean expression in CFTR wild-type cells. One-sided t-test. d, Left, short-circuit current measurements in CFTRR1162X/R1162X hNE cells (X represents UGA) with tRT5 alone or with tRT5 plus NMD inhibitor (0.5 µM SMG1) (right). Right, short-circuit currents in hNE cells from non-cystic fibrosis individuals who are wild-type for the CFTR gene. Positive values (white bars) indicate ΔIsc following CFTR activation with forskolin and VX-770 and negative values (solid bars) indicate ΔIsc following CFTR inhibition with Inh-172. Data are mean ± s.e.m. (tRT5 and mis: n = 8; tRT5 + NMDi and wild type: n = 4, independent replicates) and are shown as a percentage of the mean of CFTR expression in wild-type cells. One-sided t-test. e, ASL height measurement on CFTRR1162X/R1162X hNE cells (X represents UGA) co-transfected with tRT5 or mismatch tRNA, compared with CFTR expression in wild-type cells. Data are mean ± s.e.m. (n = 5 independent replicates). Two-way ANOVA with Sidak’s multiple comparisons. For gel source data see Supplementary Fig. 1. Source Data
Extended Data Fig. 1
Extended Data Fig. 1. tRNA designs to suppress PTCs at Gly codons.
a, Cloverleaf structure (left) of the human tRNAGlyUCC which is represented by two isodecoders that share the same anticodon to decode GGA codon, but differ by a single nucleotide (red) in their sequence. The anticodon of both tRNAGly isodecoders were mutated to pair to the UGA PTC yielding tG1 and tG2 (Supplementary Table 1); nucleotide substitutions in TΨC stem yielding the Ti variants (right) are highlighted in red. b, Suppression efficiency of tG variants at UGA PTC monitored with R208X-FLuc in Hep3B cells and normalized to wild-type FLuc expression. In vitro transcribed tG variants were co-transfected with plasmid-borne FLucR208C reporter construct (schematic Fig. 1b). Anticodon-edited tG1 and tG2, black; TΨC-stem edited variants of tG1 and tG2, red; mismatch tRNA that does not pair to UGA PTC, dark blue. Data are means ± s.e.m. (n = 4 biologically independent experiments). Source Data
Extended Data Fig. 2
Extended Data Fig. 2. In vitro transcription generates high quality functional tRNAs with functionally homogenous 3′ ends in Hepa1-6 cells.
a, b, Purified in vitro transcribed tRNAs are homogenous as monitored by denaturing polyacrylamide gel (a) or capillary electrophoresis (b) as exemplified by tS and tSA1T5. Left lane on the polyacrylamide gel, RNA ladder (Low Range ssRNA ladder, NEB). LM, lower marker. Analysis performed once with a randomly chosen batch. c, Readthrough efficacy of tSA1T5 transcribed with conventional primer (closed circles) is comparable to that of the tSA1T5 produced using 3′-modified (2′-OMe) primer (open circles) which enables precise termination of in vitro tRNA transcription. Data are means ± e.e.m. (n = 3 biologically independent experiments). For gel source data to panel a see Supplementary Fig. 2. Source Data
Extended Data Fig. 3
Extended Data Fig. 3. tSA1T5 incorporates only Ser in place of the UGA stop codon.
a, b, Hepa 1-6 cells co-transfected with in vitro transcribed tSA1T5 and FLucR208X-RLuc mRNA (a) or WT FLucR208-RLuc mRNA (b) and analyzed by 2D-nano PRM LC-MS/MS. Extracted Ion Chromatograms (EICs) (a,b upper panels) and MS/MS spectra (a,b lower panels). Peptides with m/z 685.8089 and 642.2929 correspond to the double-charged Luc-derived peptides. Peptide SYNLTSQDEDAK is identified in R208X-FLuc expressing cells transfected with tSA1T5, indicating the incorporation of Ser at the UGA stop codon. Sequence parts of tSA1T5 originate from tRNAThrGCU, yet they do not compromise the fidelity of seryl-tRNA-synthetase, as no threonine incorporation was detected (Supplementary Table 1). No tryptophan or selenocysteine was detected either despite the intrinsic tendency of tRNATrp or tRNASec to pair to UGA codon. Wild-type FLuc-derived peptides from the FLuc-R208-RLuc reporter without PTC were cleaved directly after the Arg208 residue generating the peptide YNLTSQDEDAK. The experiment serves as a quality check and hence, was performed as a single experiment.
Extended Data Fig. 4
Extended Data Fig. 4. Dose-dependent suppression activity of sup-tRNA and cell viability.
a, Suppression activity monitored by co-transfecting different concentrations of in vitro transcribed tS (black) or tSA1T5 (orange) suppressor tRNAs . PTC suppression activity is represented as a ratio of the normalized PTC-FLuc reporter activity from FLuc-R208X-RLuc mRNA to that of the reporter without PTC (FLuc(R208S)-RLuc). Data are means ± s.e.m. (n = 3 biologically independent experiments). b, Cell viability assay 24 h post transfection of CFBE41o- cells transfected with different tS (black) and tSA1T5 (orange) concentrations. The signal was normalized to mock-transfected cells and the signal with the lowest tRNA concentration was set as 100%. Data are means ± s.e.m (n = 3 biologically independent experiments). c, Schematic of screening by co-transfecting of in vitro transcribed (IVT) sup-tRNA and PTC-FLuc-RLuc reporter mRNA. FLuc signal was normalized on the RLuc, both of which encoded within the same reporter but expressed from independent promoters. RLuc uses cap-independent IRES . d, tSA1T5 targets PTCs with different stop codon identities tested in murine Hepa 1-6 cells in the setup introduced in panel c. PTC suppression activity was calculated using the ratio of the normalized PTC-FLuc reporter activity from FLuc(R208X)-RLuc mRNA to that of a reporter without PTC (FLuc-R208S-RLuc), and represented as % readthrough efficiency at the PTC. Data are means ± s.e.m. (n = 3 biologically independent experiments). **P < 0.01, ***P < 0.001 (one-sided t test). e, Comparison of PTC suppression efficiency by co-transfecting tSA1T5 (orange) with the PTC (UGA) reporter as either mRNA (c), or DNA (schematic, Fig. 1b). mis (dark blue) designates mismatch tRNA that does not pair to any PTC. Data are means ± s.e.m. (for mRNA – n = 3, for DNA – n = 4, for mis combined n = 7 biologically independent experiments). Source Data
Extended Data Fig. 5
Extended Data Fig. 5. Stability of the administered mRNA and sup-tRNA.
a, The amount of the control aLucR208S mRNA inferred by aLuc activity in mice decreased by two orders of magnitude within 24 h. Quantification of aLuc activity expressed from aLucR208S mRNA post i.v. injection from the IVIS images of the Balb/C mice (Fig. 2b) at 6 h (open bars) or 24 h (filled bars). aLucR208S mRNA was co-encapsulated with tS (groups 7, 8) or tSA1T5 (groups 9, 10) at 0.6 mg/kg sup-tRNA (group 7, 9) or 1.2 mg/kg sup-tRNA (group 8, 10). Data are means ± s.e.m. (n = 3 mice in each group). b, Representative block from the tRNA-tailored microarray to detect sup-tRNA with high sensitivity. Full-length tDNA probes complementary to tSA2T5 were used to detect sup-tRNA (white squares). Each array consists of 12 such blocks, each of which contains a duplicate of three distinct probes recognizing all tRNASer isoacceptors, i.e. tRNASer(wGA), a combined probe for tRNASerAGA and tRNASerUGA (recognizing UCU, UCC and UCA codons; both probes at the bottom right), tRNASerGCU (pairing to AGU and AGC codons; probes - upper right), and tRNASerCGA (reading codon UCG, bottom left flanking the spike-ins). Blue squares, spike-ins or non-human tRNAs, used for signal normalization. tSA2T5 share some sequence similarity with tRNASerAGA and tRNASerUGA whose backbone was the starting sequence for tSA2T5 (Supplementary Table 1). In the control group, untreated with sup-tRNA, none of the natural tRNASer isoacceptors (purple squares) hybridize to tSA2T5 probe suggesting high specific of detection. c, sup-tRNA stability in gene-edited 16HBEge cells (16HBEgeR1162X/−) monitored with tRNA microarrays represented as box plot (n = 2 independent replicates) and normalized to the mean of the signal at first time point (5 h) post transfection which was set as 100 % (horizontal line). The center line indicates the median, box ends are 10%-90%, and the whiskers – the range of the remaining data without exclusion of outliers. Source Data
Extended Data Fig. 6
Extended Data Fig. 6. Cre-lox system is suitable to monitor PTC suppression.
a, Schematic of the Cre-lox system. eGFP will be only expressed if full-length Cre recombinase is expressed, which through subsequent recombination removes DsRed gene from the original cassette. Each fluorescent protein is color coded and captures the corresponding fluorescence pattern on the images. Arrow and triangle designate the CMV and loxP promoters, respectively. b, c Time course of DsRed and eGFP expression HEK293T cells stably expressing the floxed-DsRed-floxed-eGFP cassette and transfected with Cre mRNA and tRNA variants. Integrated fluorescence (b) and representative microscopy images at day 4 post transfection (c). A PTC-Cre mRNA with two UGA PTCs (S69X-S82X; blue) was used for co-transfection with tS variants designed to suppress UGA, UAA or UAG codons, respectively. Wild-type Cre mRNA without PTC (black) and mock (m) transfected cells (grey) served as positive and negative control of Cre-lox recombination, respectively. Notably, we observed elevation of eGFP signals along with simultaneous reduction of DsRed only in cells co-transfected with PTC-Cre mRNAs and PTC-matching tRNA (tS::UGA) suggesting efficient PTC correction and expression of full-length Cre recombinase. The eGFP signal decreased at day 4, likely because of degradation and/or decreased protein expression in general, since the DsRed signal also decreased. Data are means ± s.e.m. (n = 3 biologically independent experiments). Scale bar, 200 µM. Source Data
Extended Data Fig. 7
Extended Data Fig. 7. In vivo PTC suppression in lung by LUNAR-formulated tSA1T5 in a transgenic Flox-tdTomato mouse model.
Brightfield immunohistochemical images for tdTomato expression in lungs from mice (n = 4 mice in each group) intratracheally dosed with LUNAR2-LNPs that were formulated with WT-Cre mRNA (no PTC), PTC-Cre mRNA with UGA at S69X-S82X with or without tSA1T5 with an anticodon pairing to UGA or a mismatch tRNA (mis). Control mice with PTC-Cre mRNA administered only were used to establish any background tdTomato that might be present as reported by the transgenic line producer (Jackson Laboratories, USA). Mouse lung treated with PBS served as a negative control. Without a suppressor tRNA, PTC-CreS69X-S82X mRNA did not result in tdTomato expression and is indistinguishable from the negative control (PBS). tdTomato expression is detectable as dark brown spots and seen only in the WT-Cre mRNA or following suppression with tSA1T5. Representative image from each mouse of each group is included. Square in the whole image (bottom right) points location of each panel. Scale bar, 250 µM. Successful PTC suppression is indicated by the higher numbers of cells expressing tdTomato (red arrow on the magnified images, scale bar, 100 µM). Very low background of tdTomato expression from mice dosed with PTC-CreS69X-S82X mRNA and non-matching mismatch tRNA (mis) was observed (red arrow on the magnified images, scale bar, 100 µM), likely due to a low Cre-independent tdTomato background reported for these transgenic mice. Images designated with * in the right corner are the ones shown in Fig. 2d–g.
Extended Data Fig. 8
Extended Data Fig. 8. Suppressor tRNAs do not induce readthrough at native UGA codons in mice and cell culture.
a-b, Marginal but comparable readthrough at all three natural stop codons (including the unspecific ones UAA and UAG not targeted by the sup-tRNA) detected in the cumulative coverage plots (upper panels), the ribosome readthrough score (RRTS, lower panels) and Venn diagrams of the top 10% transcripts with the highest RRTS (on the right) in lung tissue of mice treated by i.t. microsprayer instillation with nanoparticulated tSA1T5 (a), liver tissue from mice treated by i.v. with nanoparticulated tSA1T5 (b). The center line indicates the median, the box ends – the first and third quartiles, and the whiskers – the range of the remaining data without exclusion of outliers. (b). Insets, box-plots as in the main plot without the outliers to visualize the median values. Control, mice treated with PBS; R#1 and R#2 indicate two mice used as independent replicates. The RRTS is a comparison between tRNA-treated samples compared to the corresponding tissue of a control mice (a,b). We noted that all detected transcript with a high RRTS (Venn diagrams) are within 10%ile of genes with highest expression level, suggesting a high proportion of false positives. c,d, Suppressor tRNA do not enhance the readthrough at internal UGA stop codons. RRTS in lung tissue of mice treated by i.t. with nanoparticulated tSA1T5 (c) and liver tissue from mice treated by i.v. with nanoparticulated tSA1T5 (d). The RRTS is a comparison between tRNA-treated samples compared to the corresponding tissue of a control mice (c,d). Note that different number of genes with internal UGA stop codons were detected as expressed in different tissues (i.e. 11 internal stop codons in mouse liver, 2 in lung tissue). Source Data
Extended Data Fig. 9
Extended Data Fig. 9. Efficiency of tS and tR variants in suppressing PTCs in CFTR-expressing immortalized cell lines.
a,b, Suppression activity in full-length CFTR was monitored by automated immunoblotting (JESS system) using monoclonal CFTR-NBD2 antibody (1:100 dilution, #596) in CFBE41o cells co-transfected with plasmid-encoded CFTRS466X, CFTRR553X, CFTRR1162X and the corresponding in vitro transcribed tRNA variant, using lipofectamine as transfection reagent. The immunofluorescence signal of the mature fully glycosylated CFTR (band C) was normalized against signal from the total protein staining (blue). mis, PTC-CFTR variants co-transfected with mismatch tRNA which does not pair to the PTC. Lower molecular weight bands are likely CFTR degradation or incompletely synthesized products. b, c, Representative Ussing chamber tracings obtained from FRTR553X (b) and FRTR1162X (c) cells transfected with tRT5 (red) or mismatch tRNA (blue) using lipofectamine. Forskolin, CFTR activator; VX-770, potentiator, Inh-172, CFTR inhibitor. Statistically insignificant (minimally negative) VX-770 deflections were noted in some tracings after peak CFTR stimulation by forskolin. Gel source data to panel a included in Supplementary Fig.1. Source Data
Extended Data Fig. 10
Extended Data Fig. 10. Restoration of CFTR expression and activity by tRT5 or by co-treatment with NMD inhibitor in patient-derived hNE (R1162X/R1162X) cells.
a, Representative immunoblots (automated immunoblotting, JESS system) using monoclonal CFTR-NBD2 antibody (1:100 dilution, #596) in 16HBEgeR1162X/− and hNER1162X/R1162X transfected with sup-tRNA alone using lipofectamine or treated with 5µM NMD14. PTC124 (ataluren). b, Wild-type (WT) CFTR expression (band C normalized to total protein) in hNE derived from healthy individuals with and without treatment with NMDi, (NMD14 (5 µM)) for 24h. Data are means ± s.e.m. (n = 3 biologically independent replicates). Statistics, one-sided t test. NMD alone decreases the WT-CFTR expression most likely owning to alterations of hNE viability following NMD treatment. c, Representative short-circuit current traces obtained from hNER1162X/R1162X cells transfected with tRT5 (red) or mismatch tRNA (blue). Forskolin, CFTR activator; VX-770, potentiator, Inh-172, CFTR inhibitor. Gel source data to panel a included in Supplementary Fig. 1. Source Data

Comment in

References

    1. Mort M, Ivanov D, Cooper DN, Chuzhanova NA. A meta-analysis of nonsense mutations causing human genetic disease. Hum. Mutat. 2008;29:1037–1047. - PubMed
    1. Bordeira-Carrico R, et al. Rescue of wild-type E-cadherin expression from nonsense-mutated cancer cells by a suppressor-tRNA. Eur. J. Hum. Genet. 2014;22:1085–1092. - PMC - PubMed
    1. Chang JC, Temple GF, Trecartin RF, Kan YW. Suppression of the nonsense mutation in homozygous β0 thalassaemia. Nature. 1979;281:602–603. - PubMed
    1. Lueck JD, et al. Engineered transfer RNAs for suppression of premature termination codons. Nat. Commun. 2019;10:822. - PMC - PubMed
    1. Porter JJ, Heil CS, Lueck JD. Therapeutic promise of engineered nonsense suppressor tRNAs. Wiley Interdiscip. Rev. RNA. 2021;12:e1641. - PMC - PubMed

Publication types

MeSH terms