. 2023 Jun;618(7965):590-597.
doi: 10.1038/s41586-023-06136-y. Epub 2023 May 31.

A pan-influenza antibody inhibiting neuraminidase via receptor mimicry

Affiliations

A pan-influenza antibody inhibiting neuraminidase via receptor mimicry

Corey Momont et al. Nature. 2023 Jun.

Erratum in

  • Author Correction: A pan-influenza antibody inhibiting neuraminidase via receptor mimicry.
    Momont C, Dang HV, Zatta F, Hauser K, Wang C, di Iulio J, Minola A, Czudnochowski N, De Marco A, Branch K, Donermeyer D, Vyas S, Chen A, Ferri E, Guarino B, Powell AE, Spreafico R, Yim SS, Balce DR, Bartha I, Meury M, Croll TI, Belnap DM, Schmid MA, Schaiff WT, Miller JL, Cameroni E, Telenti A, Virgin HW, Rosen LE, Purcell LA, Lanzavecchia A, Snell G, Corti D, Pizzuto MS. Momont C, et al. Nature. 2023 Jul;619(7970):E50. doi: 10.1038/s41586-023-06385-x. Nature. 2023. PMID: 37407829 Free PMC article. No abstract available.

Abstract

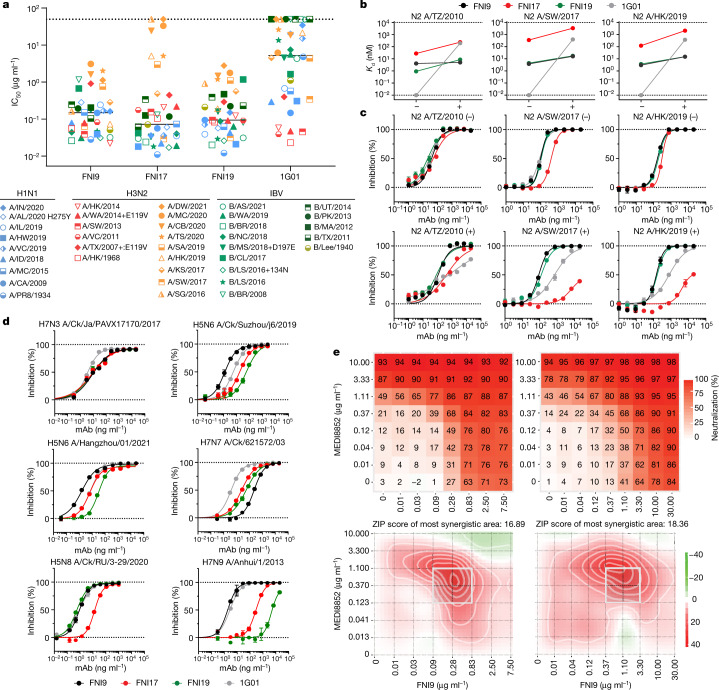
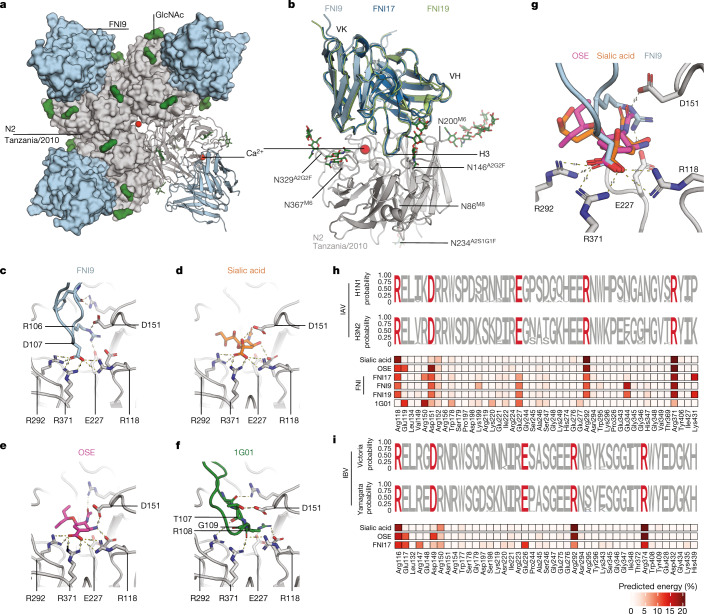
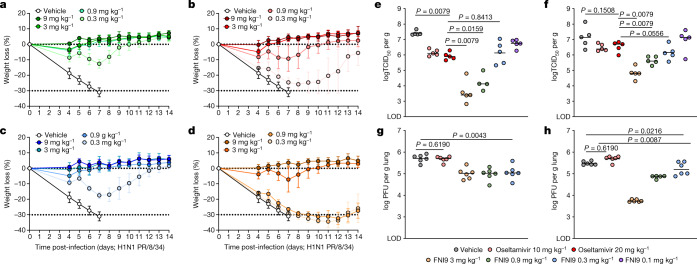
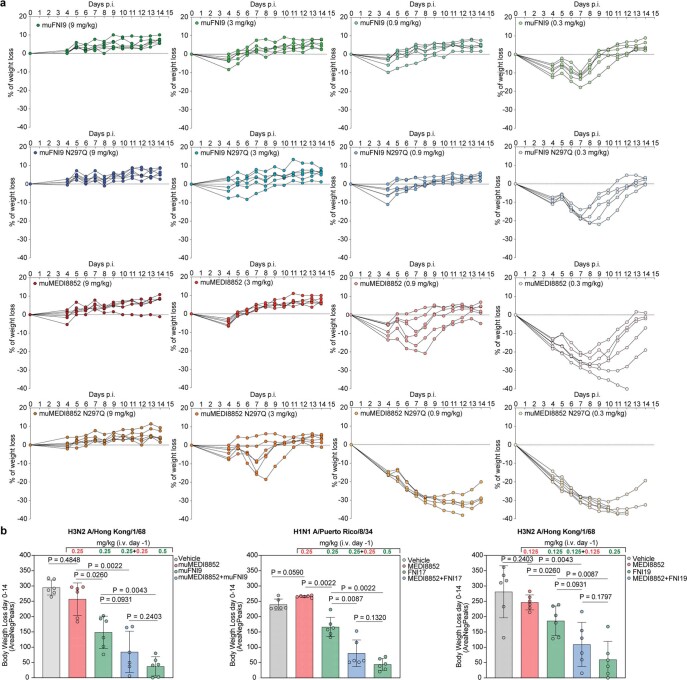
Rapidly evolving influenza A viruses (IAVs) and influenza B viruses (IBVs) are major causes of recurrent lower respiratory tract infections. Current influenza vaccines elicit antibodies predominantly to the highly variable head region of haemagglutinin and their effectiveness is limited by viral drift1 and suboptimal immune responses2. Here we describe a neuraminidase-targeting monoclonal antibody, FNI9, that potently inhibits the enzymatic activity of all group 1 and group 2 IAVs, as well as Victoria/2/87-like, Yamagata/16/88-like and ancestral IBVs. FNI9 broadly neutralizes seasonal IAVs and IBVs, including the immune-evading H3N2 strains bearing an N-glycan at position 245, and shows synergistic activity when combined with anti-haemagglutinin stem-directed antibodies. Structural analysis reveals that D107 in the FNI9 heavy chain complementarity-determinant region 3 mimics the interaction of the sialic acid carboxyl group with the three highly conserved arginine residues (R118, R292 and R371) of the neuraminidase catalytic site. FNI9 demonstrates potent prophylactic activity against lethal IAV and IBV infections in mice. The unprecedented breadth and potency of the FNI9 monoclonal antibody supports its development for the prevention of influenza illness by seasonal and pandemic viruses.


Conflict of interest statement

C.M., H.V.D., F.Z., K.H., C.W., J.d.I., A.M., N.C., A.D.M., K.B., D.D., S.V., A.C., B.G., A.E.P., S.S.Y., D.R.B., I.B., M.M., M.A.S., W.T.S., J.L.M., E.C., A.T., L.E.R., L.A.P., A.L., G.S., D.C. and M.S.P. are employees of and may hold shares in Vir Biotechnology. D.C., M.S.P., A.M., E.C., G.S., K.H., C.M. and E.F. are currently listed as inventors on multiple patent applications, which disclose the subject matter described in this paper. E.F., A.E.P., R.S. and H.W.V. are former employees of VIR Biotechnology. E.F. is currently an employee at and hold stocks in Amgen. Amgen provided no funding for this work. T.I.C. is a consultant for Vir Biotechnology and receives royalties from licensing of ISOLDE software used for molecular modelling. D.M.B. received research funding from VIR Biotechnology. L.A.P. is a former employee and shareholder of Regeneron Pharmaceuticals and is a member of the Scientific Advisory Board AI-driven structure-enabled antiviral platform (ASAP). Regeneron provided no funding for this work. H.W.V. is a founder of PierianDx and Casma Therapeutics. Neither company provided funding for this work. The remaining authors declare that the research was conducted in the absence of any commercial or financial relationships that could be construed as a potential competing interest.

Figures

Fig. 1
Fig. 1. Breadth of FNI9, FNI17 and FNI19 anti-NA mAbs across IAVs and IBVs.
a, Phylogenetic tree of IAV and IBV NAs constructed using maximum likelihood analysis of amino acid sequences. The scale bar indicates the average number of amino acid substitutions per site. b, Heat map of mAb binding to cell-surface-expressed NAs representative of IAV and IBV strains by flow cytometry. Coloured boxes represent the lowest concentration at which mAb binding (expressed as mean fluorescence intensity) was measurable.
Fig. 2
Fig. 2. In vitro characterization of FNI9, FNI17 and FNI19 mAbs.
a, FNI9, FNI17, FNI19 and 1G01 mAbs neutralization half-maximal inhibitory concentration (IC50) values against a panel of seasonal IAVs (H1N1 is blue; H3N2 pre-2015 is in red and H3N2 post-2015 is in orange) and IBVs (B/Victoria/2/87-like viruses are in light green, B/Yamagata/16/88-like viruses are in dark green and ancestral is in olive). Full viral strain designations and IC50 values are listed in Supplementary Table 3. Geometric mean of n = 2 independent experiments for each strain is shown. The black solid line indicates the median IC50 for each mAb. Symbols on the dotted line represent strains against which the mAbs did not reach IC50 at the concentrations tested in the assay (see Supplementary Table 3). b, Binding affinity (Kd) of anti-NA Fab fragments to N2 NA antigens not bearing (−) or bearing (+) glycan at position 245 as measured by SPR. Full details of the antigens tested and Kd values are reported in Supplementary Table 4. Results represent an average of at least two technical replicates from one independent experiment. Dotted lines represent the limits of detection. c, Inhibition of enzymatic activity, as measured by ELLA, exerted by anti-NA mAbs on NA antigens not bearing (−) or bearing (+) N245 glycan. Full details of the antigens used are reported in Supplementary Table 4. d, Inhibition of enzymatic activity, as measured by ELLA, exerted by anti-NA mAbs against NA-only based pseudoparticles bearing N3, N6, N7, N8 or N9 representative of zoonotic isolates. Dotted lines in c and d represent the minimum and maximum percentage of inhibition. Results represent two technical replicates from one independent experiment out of two. Error bars indicate s.d. of technical duplicates. e, In vitro neutralization matrixes (top panels) and synergy plots (bottom panels) reporting combination activity of anti-HA stem-directed MEDI8852 and anti-NA FNI9 mAbs to H1N1 A/Puerto Rico/8/34 (left) and H3N2 A/Tasmania/503/2020 (right) viruses. Neutralization matrixes were performed in technical triplicates with one of two independent experiments shown. Source Data
Fig. 3
Fig. 3. Structure of anti-NA mAbs targeting the SA-binding site.
a, Topology of the complex formed by FNI9 (light blue) binding to NA (grey). Representative calcium ions at the centre of the tetramer and in the NA–Fab interface are represented as red spheres. Glycans decorating each NA protomer are shown in green (see Extended Data Fig. 7). b, Binding of FNI9 (light blue), FNI17 (dark blue) and FNI19 (light green) to the NA (grey) SA-binding pocket. Only the variable domains of the mAbs are shown. VH, variable domain heavy chain; VK, variable domain kappa light chain. c, Network of salt bridges and hydrogen bond interactions between R106 and D107 (light blue sticks) in the HCDR3 of FNI9 and R118, D151, E227, R292 and R371 in NA (grey sticks). The dashed lines depict interactions within 3.5 Å. d, Network of salt bridges and hydrogen bonds between SA (orange) and NA-binding pocket residues (grey) based on PDB: 4GZQ. The dashed lines are depicted as in c. e, Network of salt bridges and hydrogen bonds between oseltamivir (OSE; pink) and NA-binding pocket residues (grey) based on PDB: 4GZP. The dashed lines are depicted as in c. f, Hydrogen bonds between residues T107, R108 and G109 (green) in the HCDR3 of 1G01 (PDB: 6Q23) and the NA-binding pocket residues (grey). The dashed lines are depicted as in c. g, Overlay of SA, OSE and the HCDR3 of FNI9 illustrates the molecular mimicry of their carboxylates participating in a tridentate salt bridge with R118, R292 and R371. The dashed lines are depicted as in c. h,i, Logo plot amino acid conservation of SA, OSE, FNI9, FNI17, FNI19 and 1G01 epitopes based on available NA sequences from human seasonal H1N1 (n = 64,476) and H3N2 (n = 91,754) IAVs (h) and Victoria/2/87-like (n = 23,787) and Yamagata/16/88-like (n = 17,769) IBVs (i). Key contact residues are shown in red. The binding energies of epitope residues (as a percentage of the total) are shown in the heat map; for the IBV analyses, PDB 1NSC (SA, B/Beijing/1/87) and 4CPY (OSE, B/Lyon/CHU/15.216/2011) were used. Source Data
Fig. 4
Fig. 4. FNI mAbs induce a conformational change in the 242/252 loop when N245 is glycosylated.
a, 2D and 3D classifications and percentages of classes of FNI9–NA (N2 A/Hong Kong/2019) showing four, three and zero Fabs bound to the tetramer (the condition with a single Fab bound is not shown: 1.33%), FNI17–NA (N2 A/Tanzania/2010 with S245N and S247T) showing one and zero Fabs bound to the NA tetramer, and FNI19–NA (N2 A/Hong Kong/2019) with zero, three and four Fabs bound to the NA tetramer. b, N245 glycosylated (+Glyc245; grey) and non-glycosylated (−Glyc245; brown) NAs reveal very similar conformations of the 242/252 loop in the unbound state. Overlay of the FNI9 Fab (light blue, translucent surface) indicates the steric hindrance with the N245 glycan (light green surface), which would occur without a rearrangement of the 242/252 loop and the glycan. c, Overlays of N2 A/Tanzania/2010 NA (−Glyc245) with (+FNI9, gold) and without (−FNI9, brown) Fab bound reveal that the NAs adopt indistinguishable conformations; the FNI9 Fab is shown as a light blue surface. d, Overlays of N245-glycosylated NA structures with (+FNI9, dark green) and without (−FNI9, grey) Fab bound illustrate the influence of the Fab on inducing a conformational change in the 242/252 loop. Although the peptide mapping liquid chromatography–mass spectrometry in Extended Data Fig. 7 revealed that position 245 bears an A2G2F glycan, only the two GlcNAcs and fucose resolved by cryo-electron microscopy are shown in the figure. Source Data
Fig. 5
Fig. 5. FNI9 mAb protects mice from seasonal IAV and IBV lethal challenges.
ad, Percentage of body weight loss of BALB/c mice (n = 6 mice per group) prophylactically administered with murinized anti-NA FNI9 mAb (a), anti-HA stem-directed MEDI8852 mAb (b) and the same mAbs bearing the N297Q Fc mutation (c,d) 24 h before lethal infection with H1N1 A/Puerto Rico/8/34. Doses are reported in different colours and the average body weight loss for each dose group is shown. Error bars represent standard deviations. The 0% dotted line indicates baseline body weight loss; the −30% dotted line indicates body weight loss % for euthanasia based on lead veterinarian assessment as described in the ethical statement. eh, Replicating virus titres in the lungs of BALB/c mice measured 4 days post-infection with H1N1 A/Puerto Rico/8/34 (e), H3N2 A/Singapore/INFIMH-16-0019/2016 (f) (n = 5 mice per group), B/Victoria/504/2000 (Yamagato linage) (g) and B/Brisbane/60/2008 (Victoria lineage) (h) (n = 6 mice per group) following prophylactic administration of FNI9 at 3, 0.9, 0.3 mg kg−1 (eh) and 0.1 mg kg−1 (e,f). Each panel presents data derived from n = 1 independent experiment. Two-tailed Mann–Whitney test was used for statistical analysis of significance. LOD, limit of detection; TCID, tissue culture infectious dose. Source Data
Extended Data Fig. 1
Extended Data Fig. 1. Clonal evolution of FNI mAbs.
a, b, Graphical representation of the FNI clonal evolution based on the VH (a) and VK (b) generated by the graphic user interface (GUI) AncesTree. Branch lengths are denoted on the lines connecting the branching points with both the total number of nucleotide and amino acid changes, the latter in parentheses. c, Phylogenetic tree of the concatenated heavy and light chain sequences generated using raxml-ng assuming the same single somatic substitution process across both heavy and light chain genes. Each heavy chain sequence was appended to the light chain sequence of the same clone for the purpose of phylogenetic reconstruction under the assumption of a single substitution process. Branch points represent hypothetical bifurcations during the evolution of the antibody sequences. Scale represents the number of amino acid changes per site. d, e, Amino acid sequence alignment of FNI clonal family VH (d) and VK (e) with respective unmutated common ancestor (UCA).
Extended Data Fig. 2
Extended Data Fig. 2. Breadth of FNI mAbs across the Influenza A and B viruses.
a, FACS gating strategy used to assess binding of FNI and 1G01 mAbs to NA transiently expressed in mammalian cells. b, Inhibition of NA enzymatic activity by the anti-NA mAbs against group 1 (N1), group 2 (N2) IAV and B/Victoria/2/87-like (Vic) and B/Yamagata/16/88-like (Yam) IBV NA antigens as measured by MUNANA assay. Data represent n = 1 biologically independent experiment out of two. c, Introduction and spreading of the 245 glycosylation motif in H3N2 seasonal viruses. GISAID analysis (2011–2022) of the N2 NAs from seasonal H3N2 strains bearing S245N and S247T mutations, which results in the introduction of the N245 glycosylation site. X represents strains selected for inclusion in the vaccine formulations. Source: Nextstrain (https://nextstrain.org/flu/seasonal/h3n2/na/12y?c=gt-NA_245,247&dmin=2004-10-11). Source Data
Extended Data Fig. 3
Extended Data Fig. 3. NAI activity of FNI and 1G01 mAbs against pseudoparticles bearing NAs from avian and mammalian influenza A viruses.
a, Inhibition of sialidase activity of FNI and 1G01 mAbs versus NA-based pseudoparticles bearing N1 from highly pathogenic H5N1 A/Mink/Spain/3691-8_22VIR10586-10/2022 (clade 2.3.4.4) as measure by MUNANA assay. b, Inhibition of neuraminidase enzymatic activity, as measured by ELLA, exerted by anti-NA mAbs against NA-based pseudoparticles bearing N3, N4, or N5 representative of enzootic low pathogenic avian influenza A viruses. c, Inhibition of sialidase activity of FNI and 1G01 mAbs versus NA-only based pseudoparticles bearing NA representative of enzootic swine or canine influenza A viruses as measured by MUNANA assay. Data from n = 1 biologically independent experiment out of two are shown. Source Data
Extended Data Fig. 4
Extended Data Fig. 4. FNI9 mAb mediates activation of CDC, ADCC and ADCP.
a,d, CDC with a serial dilution of FNI9 (red) and anti-HA MEDI8852 (green) mAbs on MDCK-LN cells infected with H1N1 PR8 in the presence of guinea pig complement. b,e, ADCC with FNI9 (red) and anti-HA MEDI8852 (green) mAbs on A549 cells infected with H1N1 PR8 in the presence of freshly isolated human NK cells. c,f, ADCP with serial dilution of FNI9 mAb (red) using peripheral blood mononuclear cells (PBMCs as source of monocytes) as effector cells, and PKH67-labelled ExpiCHO cells expressing N2 NA as target cells. The y-axis indicates the percentage of monocytes double positive for CD14 and PKH67. For all assays FNI9-GRLR (red empty circle) is used as Fc-silent negative control and results are shown both as dose-response curves (a-c) and as area under the curve (AUC) (d-f). Results are representative of n = 1 (d, e) or n = 2 (f) biological replicates (black dots). Source Data
Extended Data Fig. 5
Extended Data Fig. 5. Conservation analysis of FNI mAbs key contact residues on the NA of IAVs and IBVs.
Mean conservation percentage (2009–2022) of key NA contacting residues (R118, D151, E227, R292, and R371) per year (red line). The number of sequences analysed per year is shown (black bars). Sequences retrieved for H1N1, H3N2 and IBV isolates are of human origin, while those for H5N1, H7N9, H5N8 and H5N6 viruses are of both human and animal origin. Sequences were retrieved from GISAID database. IAV sequences conservation was measured against A/New York/392/2004 reference strain. IBV sequences conservation was measured against B/Yamagata/16/88 reference strain. Source Data
Extended Data Fig. 6
Extended Data Fig. 6. Escape mutants, frequency and fitness cost.
a, Summary table showing amino acid substitutions identified in resistance studies with H1N1 and H3N2 viruses, the number of virus passages that were required to observe the mutation, the neutralization IC50s against the mutants and the frequency of the mutation in all IAVs deposited in GISAID between 2000–2022. NT*: not tested as R152I and D199N mutants were not rescued following virus propagation in vitro. Note: IC50s observed with S247R/I223R and K431E mutants are in the range of the overall IC50s observed for FNI9 with seasonal IAVs and IBVs (see Fig. 2a). b, Mutations reducing FNI9 binding to N1 from H1N1 A/California/07/2009 identified by DMS. Only amino acid substitutions that do not result in strong reduction of expression are reported in the red colour scale (darker red, more expression; lighter red, less expression in comparison to synonymous mutations). N1 numbering is used on the x-axis along with N2 numbering below. N2 positions identified as epitope residues by static structural analysis are highlighted with black dots (‘Epi’) and additional positions identified by dynamic analysis (MD) are highlighted with red dots. Potential escape mutations flagged by DMS (top row of black dots, ‘Esc’) not identified as epitope residues have low frequencies in GISAID (see below). c, Static epitope analysis of SA, oseltamivir (OSE), FNI9, FNI17, FNI19, and 1G01 shown as in Fig. 3h, where lighter red is a weaker interaction and darker red is a stronger interaction. d, Logo plot of N1 sequences in GISAID shows the frequencies of all residues at each position across all species (n = 79,316). N1 numbering is used on the x-axis and the y-axis extends from a cumulative frequency of zero to one. The potential escape mutants in (b) are too infrequent to be seen in (d). e, Frequency of only the DMS-identified potential escapes appearing in GISAID for N1 across all species and all time windows (n = 79,316) shown as a logo plot. N1 numbering is used on the x-axis and the y-axis extends from a cumulative frequency of zero to 10−3. f, Enzymatic activity, as measured by MUNANA, of N1 antigen from H5N1 A/Vietnam/1203/2004 or N2 antigen from H3N2 A/Hong Kong/2671/2019 bearing amino acid substitutions identified via resistance studies (a) in comparison to the sialidase activity of the wild type NAs. A detailed list of the mutations and NA antigens in which they were introduced is reported in Supplemetary Table 4. g, Enzymatic activity, as measured by MUNANA, of pseudoparticles bearing N1 from H1N1 A/California/07/09 with amino acid substitutions retrieved from DMS (b-e) in comparison to pseudoparticles presenting the parental NA. h,i, Inhibition of neuraminidase enzymatic activity by FNI and 1G01 mAbs, as measured by MUNANA, of a panel of NA bearing mutations identified through resistance studies (h) or DMS (i). Data for n = 1 biologically independent experiment are shown. Source Data
Extended Data Fig. 7
Extended Data Fig. 7. Glycan profiling of neuraminidase with peptide mapping LC-MS.
a, Glycan profile of N2 A/Tanzania/2010 with pie charts depicting the percent distributions of glycans. The most abundant glycan (red font) is illustrated; the monosaccharide units resolved by cryoEM are outlined in red. The most abundant glycan at each position in N2 was modelled onto cryoEM structures to prepare the MD simulations (see Methods for details). b, Glycan profile of N2 A/Hong Kong/2019 depicted as in (a). Oxford glycan notation is used; nG, no glycan. Source Data
Extended Data Fig. 8
Extended Data Fig. 8. Detailed structural analysis of FNI9 and FNI17 mAbs binding to NA.
a, Static epitope analysis of FNI9:NA (left) and FNI17:NA (right) on N2 A/Tanzania/2010 depicted as a heatmap whose color scale is MOE kcal/mol energy; x-axis delineates epitope residues; and y-axis delineates paratope residues. FNI9 and FNI17 sequence differences are specified by grey dots along the y-axes and total binding energies are reported. b, Dynamic epitope analysis of FNI9:NA (left) and FNI17:NA (right) on N2 A/Tanzania/2010 depicted as in (a) using energies derived from 11.5 µs MD simulations. Red squares depict epitope-paratope residue contacts present in the FNI9:NA complex that are absent in the FNI17:NA complex. Dynamic total binding energies are reported. c, Percent occupancy of epitope-paratope interactions (within 5 Å) of FNI9:NA (left) and FNI17:NA (right) on N2 A/Tanzania/2010 in the 11.5 µs MD simulations. Percentage of total occupancy is reported. d, Comparison of FNI9 and FNI17 paratopes using dynamic analysis; FNI9 and FNI17 sequence differences are specified by grey dots along the x-axis. e, Comparison of FNI9 and FNI17 epitopes using dynamic analysis; NA residues depicted along the x-axis. Source Data
Extended Data Fig. 9
Extended Data Fig. 9. Contribution of effector functions and combination studies in vivo.
a, Body weight loss of BALB/c mice (n = 6 mice/group) related to Fig. 5a–d. Body weight loss percentage for single BALB/c mice prophylactically administered with muFNI9, muFNI9 N297Q, muMEDI8852, and muMEDI8852 N297Q mAbs at 9, 3, 0.9, and 0.3 mg/kg and infected with a lethal dose of H1N1 A/Puerto Rico/8/34. b, Area of negative peaks of the body weigh loss measured for the BALB/c mice (n = 6 mice/group) prophylactically administered with murinized MEDI8852 (muMEDI8852), murinized FNI9 (muFNI9), MEDI8852, FNI17, FNI9 and the combination of the anti-HA and anti-NA mAbs in a 1:1 ratio against H1N1 A/Puerto Rico/8/34 or H3N2 A/Hong Kong/1/1968 as indicated in the graphs. The area of the negative peaks is defined as the area between the body weight loss line of each animal over 14 days and the 0% body weight loss baseline. Data from n = 1 independent experiment for each anti-NA mAb are presented. Two-tailed Mann–Whitney test was used for statistical analysis of significance. Errors bars indicate S.D. Source Data
Extended Data Fig. 10
Extended Data Fig. 10. Correlation between mAb concentration at Day 0 and virus lung titres related to Fig. 5e–h.
Replicating virus titres in the lungs of BALB/c mice at 4 days after challenge plotted against serum mAb concentrations measured 2 h before infection with H1N1 A/Puerto Rico/8/34, H3N2 A/Singapore/2016, B/Victoria/504/2000, or B/Brisbane/60/2008 viruses. Dotted red lines represent viral lung titre reductions produced by oseltamivir. Details on the mAb quantification are reported in the corresponding material and method section. Source Data

References

    1. Kirkpatrick E, Qiu X, Wilson PC, Bahl J, Krammer F. The influenza virus hemagglutinin head evolves faster than the stalk domain. Sci. Rep. 2018;8:10432. doi: 10.1038/s41598-018-28706-1. - DOI - PMC - PubMed
    1. Paules CI, Sullivan SG, Subbarao K, Fauci AS. Chasing seasonal influenza—the need for a universal influenza vaccine. N. Engl. J. Med. 2018;378:7–9. doi: 10.1056/NEJMp1714916. - DOI - PubMed
    1. GBD 2017 Influenza Collaborators. Mortality, morbidity, and hospitalisations due to influenza lower respiratory tract infections, 2017: an analysis for the Global Burden of Disease Study 2017. Lancet Respir. Med. 2019;7:69–89. doi: 10.1016/S2213-2600(18)30496-X. - DOI - PMC - PubMed
    1. Subbarao K. The critical interspecies transmission barrier at the animal–human interface. Trop. Med. Infect. Dis. 2019;4:72. doi: 10.3390/tropicalmed4020072. - DOI - PMC - PubMed
    1. Zaraket H, Hurt AC, Clinch B, Barr I, Lee N. Burden of influenza B virus infection and considerations for clinical management. Antiviral Res. 2021;185:104970. doi: 10.1016/j.antiviral.2020.104970. - DOI - PubMed

MeSH terms