. 2023 Jun;618(7964):349-357.
doi: 10.1038/s41586-023-06120-6. Epub 2023 May 31.

Myelin dysfunction drives amyloid-β deposition in models of Alzheimer's disease

Affiliations

Myelin dysfunction drives amyloid-β deposition in models of Alzheimer's disease

Constanze Depp et al. Nature. 2023 Jun.

Abstract

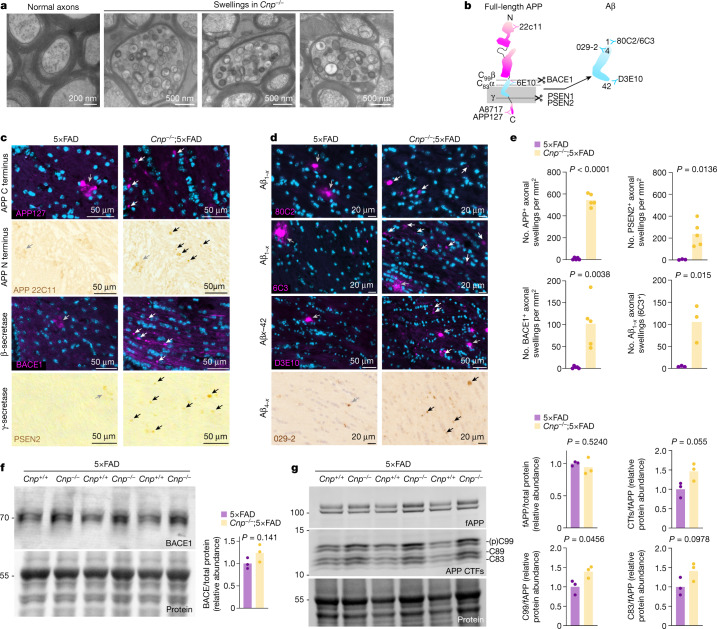
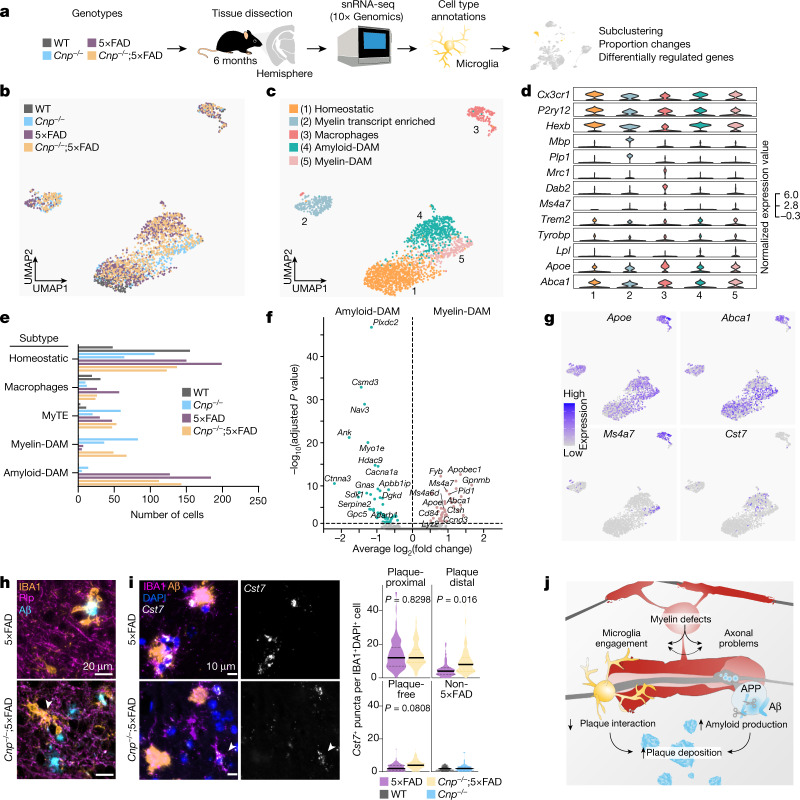
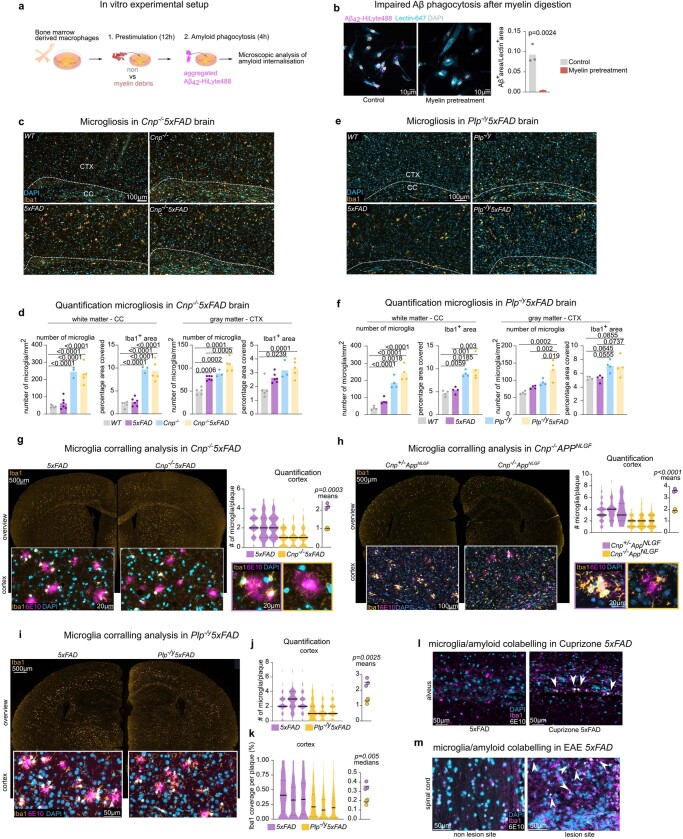
The incidence of Alzheimer's disease (AD), the leading cause of dementia, increases rapidly with age, but why age constitutes the main risk factor is still poorly understood. Brain ageing affects oligodendrocytes and the structural integrity of myelin sheaths1, the latter of which is associated with secondary neuroinflammation2,3. As oligodendrocytes support axonal energy metabolism and neuronal health4-7, we hypothesized that loss of myelin integrity could be an upstream risk factor for neuronal amyloid-β (Aβ) deposition, the central neuropathological hallmark of AD. Here we identify genetic pathways of myelin dysfunction and demyelinating injuries as potent drivers of amyloid deposition in mouse models of AD. Mechanistically, myelin dysfunction causes the accumulation of the Aβ-producing machinery within axonal swellings and increases the cleavage of cortical amyloid precursor protein. Suprisingly, AD mice with dysfunctional myelin lack plaque-corralling microglia despite an overall increase in their numbers. Bulk and single-cell transcriptomics of AD mouse models with myelin defects show that there is a concomitant induction of highly similar but distinct disease-associated microglia signatures specific to myelin damage and amyloid plaques, respectively. Despite successful induction, amyloid disease-associated microglia (DAM) that usually clear amyloid plaques are apparently distracted to nearby myelin damage. Our data suggest a working model whereby age-dependent structural defects of myelin promote Aβ plaque formation directly and indirectly and are therefore an upstream AD risk factor. Improving oligodendrocyte health and myelin integrity could be a promising target to delay development and slow progression of AD.


Conflict of interest statement

The authors declare no competing interests.

Figures

Fig. 1
Fig. 1. Myelin damage in patients with AD.
Fluorescent immunolabelling of CNP and PLP (myelinated fibres) and IBA1 (microglia) and Me-04 staining (Aβ plaques) in the medial temporal lobe of patients with AD and in unaffected individuals (non-AD). a, Annotated overview image of the medial temporal lobe of a patient with AD indicating the location of magnified images. b, Magnified images of the upper cortical layers in the transentorhinal cortex in patients with AD and in unaffected individuals (n = 3 per group). CA, cornu ammonis; Coll sul: collateral sulcus; DG, dentate gyrus; EC, entorhinal cortex; Fi, fimbria; FusGy, fusiform gyrus; PHg, parahippocampal gyrus; PRC, perirhinal cortex; Sub, subiculum.
Fig. 2
Fig. 2. Dysmyelination and demyelination enhance amyloid plaque deposition in 5×FAD mice.
ad, LSM analysis of 6-month-old Cnp+/+;5xFAD and Cnp−/−;5xFAD mouse brains stained for Congo red. a, Representative LSM 2D single planes. Inlays show close-up images of the cortex and alveus. Arrowheads indicate small amyloid deposits in the alveus. b, 3D representation of hippocampal, isocortical and alveus plaques represented as coloured centroids. c, 3D cropped regions of interest (ROIs) of a representative brain rendered in maximum intensity modus. d, 3D quantification of plaque load in the indicated ROIs normalized to the controls. n = 8 for control, n = 7 for mutant. Ctrl, control; KO, knockout. e, Left, 2D immunostaining images of microglia (IBA1) and Aβ plaques with Me-04 (top two rows) or antibody-labelling (bottom row) in the alveus of cuprizone-treated 5×FAD mice (cuprizone 5×FAD) and control animals (5xFAD). Right, quantification of amyloid-positive deposits in the alveus. n = 4 for control, n = 5 for cuprizone treatment. f, Left, 2D immunostaining images of amyloid using antibody labelling (top two rows) or the β-sheet dye Me-04 (bottom row). EAE lesions are indicated by nuclei accumulations (DAPI or ToPro3 labelling) and marked by dashed lines. EAE control animals are shown to rule out nonspecific staining of lesion sites in EAE. Right, quantification of amyloid-positive deposits in the lesion environment. n = 5 for control, n = 5 for EAE treatment. For df, statistical analysis: two-sided, unpaired Student’s t-test (P values are indicated in the graphs). Bars represent the means, dots represent biological replicates/mice/n. Source data
Fig. 3
Fig. 3. Myelin dysfunction alters APP processing.
a, High-pressure freezing EM of optic nerves from 6-month-old WT and Cnp−/− mice. Nerves from Cnp−/− mice show (plaque-independent) axonal swellings with accumulation of endosomal and lysosomal structures and multivesicular bodies. The same observations were made in three independent samples per mice per group. b, Schematic representation of APP cleavage and binding sites of anti-APP and anti-Aβ antibodies used. c, Fluorescent and chromogenic immunostaining images of APP and APP cleavage enzymes BACE1 (β-secretase) and PSEN2 (as part of the γ-secretase complex) in white matter (fimbria) from Cnp−/−;5×FAD mice. Grey arrowheads mark plaque-associated axonal swellings typically forming a corona. Black and white arrowheads indicate plaque-independent axonal swellings as observed in Cnp−/− mice. d, Fluorescent and chromogenic immunostainings of Aβ peptides in white matter (fimbria) of Cnp−/−;5×FAD mice and 5×FAD mice. Grey arrowheads indicate proper amyloid plaques, typically stained intensely. White arrows indicate swellings stained positive by the respective Aβ-antibody, but typically stained less intensely and more round in structure. e, Quantification of axonal swellings positive for APP, BACE1, PSEN2 and Aβ (6C3) in white matter (fimbria) of 5×FAD control mice and Cnp−/−;5xFAD mice. For BACE1 and APP quantification, n = 5 for 5×FAD and Cnp−/−;5×FAD. For PSEN2 quantification, n = 3 for 5×FAD and n = 5 for Cnp−/−;5×FAD. For 6C3, n = 3 for 5×FAD and Cnp−/−;5×FAD. f, Fluorescent immunoblot analysis of BACE1 levels in microdissected cortex of Cnp−/−;5×FAD mice and 5×FAD mice. g, Fluorescent immunoblot analysis of APP fragmentation in the membrane-bound fraction of microdissected cortical tissue of Cnp−/−;5×FAD mice and 5×FAD control mice. (p)C99, phospho-C99. For f and g, the molecular weight marker (in kDa) is indicated on the left. For quantifications in f and g, full-length APP (fAPP) and BACE1 levels were normalized to total protein stain. CTF levels were normalized to fAPP. n = 3 per group. For eg, statistical analysis: two-sided, unpaired Student’s t-test (P values are indicated in the graphs). Bars represent means, dots represent biological replicates/mice/lanes/n. Source data are given in Supplementary Fig. 1. Source data
Fig. 4
Fig. 4. Loss of microglial corralling around amyloid plaques in myelin mutant mice.
a, 2D immunofluorescence analysis of microglial reaction to amyloid plaques in Cnp−/−;5×FAD and 5×FAD mice by IBA1 and amyloid co-staining (Me-04). b, Left, automated quantification of IBA1 plaque coverage in the cortex. Each violin plot represents a single animal/biological replicate/n. n = 5 per group. Black lines represent medians. In total, 2,017 individual cortical plaques were analysed in 5×FAD brain slices and 2,190 in Cnp−/−;5×FAD brain slices. Middle, graph shows distribution of medians. Lines indicate means. Statistical analysis: two-sided, unpaired Student’s t-test (P values are indicated on the graphs) on biological replicate data. Right, two representative plaques for each genotype. c, Experimental setup for microglia bulk RNA-seq. Microglia were isolated from hemispheres of 6-month-old WT, Cnp−/−, 5×FAD and Cnp−/−;5×FAD animals and subjected to RNA-seq (biological replicates, n = 4 for each genotype). d, PCA was used for evaluating relative distances between normalized RNA transcripts per kilobase million (TPM) profiles. Dots represent biological replicates. Principal component 1 (PC1) explained 80.1% of data variability and strongly reflected Cnp−/−-dominated microglia transcriptome changes. e, Heatmap of top genes contributing to PC1 variability. f, Normalized expression level for selected genes (homeostatic marker P2ry12, DAM signature Trem2, Tyrobp, Axl and Clec7a, and differential regulated genes in Cnp−/−;5×FAD mice (Apoc1, ApoE, Ms4a7 and Mmp12)). Bars represent means, dots represent mice/biological replicates/n (n = 4 per group). g, ApoE enrichment in microglia in white matter from Cnp−/−;5×FAD mice. Immunofluorescence staining of ApoE and IBA1 to mark microglia. The same observations were made in three independent samples per mice per group. h, Left, microscopy analysis of plaque-associated ApoE in cortical plaques in 5×FAD mice and Cnp−/−;5xFAD mice pseudo-coloured according to a rainbow lookup table. Right, violin plots of mean ApoE fluorescence intensity per plaque. Each violin plot represents a single animal. Black lines indicate medians. Statistical analysis: unpaired, two-tailed Student’s t-test on biological replicate data. n = 3 per genotype, 703 plaques for 5×FAD, 846 plaques for Cnp−/−;5×FAD in total. Source data
Fig. 5
Fig. 5. Myelin dysfunction induces a DAM-like state distinct to amyloid deposition as determined by snRNA-seq.
a, Experimental setup for studying microglia states associated with myelin disease (myelin-DAM) and amyloid-disease (amyloid-DAM) and in combination. Brain hemispheres were isolated from 6-month-old WT, Cnp−/−, 5×FAD and Cnp−/−;5×FAD mice and subjected to snRNA-seq. Cell types were identified on the basis of marker genes, and microglia were subset for further analysis. b,c, Uniform manifold approximation and projection (UMAP) visualization of microglia subsets coloured by genotypes (b) or subpopulations (c). d, Violin plots showing expression of microglia subpopulation marker genes. e, Bar plot showing the distribution of microglia subpopulations across genotypes. MyTE, myelin transcripts enriched. f, Differentially regulated genes between amyloid-DAM and myelin-DAM. g, Feature plots showing expression of Apoe, Abca1, Ms4a7 and Cst7 in microglia subpopulations. h, Representative example images of microglia distraction in Cnp−/−;5×FAD mice. The arrowhead in the bottom panel highlights an activated microglial cell that is engaged in myelin phagocytosis and does not react to nearby plaques. The same observations were made in five independent samples per mice per group. i, Left, amyloid and microglia immunostaining and single-molecule fluorescence in situ hybridization for the amyloid-DAM marker Cst7. Right, violin plots show the amount of Cst7 signal per microglia. Microglia were separated into groups according to their location in relation to amyloid plaques (plaque-proximal, plaque-distant and plaque-free regions). The following number of microglia were analysed: 5×FAD: plaque-proximal = 161, plaque-distant = 111, plaque-free = 128; Cnp−/−;5×FAD: plaque-proximal = 136, plaque-distant = 184, plaque-free = 184 from 3 mice per replicates per group (n = 3). For Cnp−/−, n = 61 and for WT, n = 63 from one animal each. Black lines indicate medians. Statistical analysis: two-sided, unpaired Student’s t-test (P values are indicated in the graphs) on biological replicate data. j, Scheme illustrating how myelin dysfunction acts as an AD risk factor. Upstream myelin defects cause microglia engagement and axonal transport problems. The two downstream pathologies are probably interrelated (dashed arrow). Axonal problems lead to endosome and lysosome accumulation and enhanced amyloid production. Simultaneously, microglia become increasingly engaged with defective myelin, which reduces their interaction with amyloid plaques. Both processes contribute to the enhanced deposition of amyloid. Source data
Extended Data Fig. 1
Extended Data Fig. 1. Cortical myelin levels and gliosis in AD patients, aged wildtype mice and myelin mutants.
Continuation of Fig. 1. (a) Merge and single channel images showing microglia (stained with Iba1) and myelin levels (stained with PLP/CNP) as shown in Fig. 1. (b) Quantification of microgliosis and myelin levels in AD patients and non-AD controls as percentage area covered in the cortical areas examined. Bars represent means; dots represent individual patients/biological replicate/n (n = 3 per group). Statistical analysis: two-sided, unpaired Student’s t-test (p-value is given in graph). (c) Experimental setup to study the effect of myelin dysfunction on amyloid plaque load in AD mouse models. Models of genetic myelin dysfunction, acute demyelination and genetic amyelination were combined with the 5xFAD and AppNLGF model of AD and effects on amyloid deposition were investigated in toto by tissue clearing and light sheet microscopy (LSM). (d) Myelin defects drive a premature ageing phenotype in mice. Panels show microscopic images of immunolabellings against MBP (Myelin), GFAP (Astrogliosis), and Iba1 (Microgliosis) in 6-month-old wildtype, 24-month-old wildtype, 6-month-old myelin mutant (Cnp−/− and Plp−/y) mice. Regions of interest (ROI) analysed are indicated on the left. Dashed lines in the upper panel mark the pial surface above the cortex (CTX). Dashed lines in lower panels outline the corpus callosum (CC). (e) Heatmap representation of the quantification of myelin pathology and gliosis immunostainings as shown in (c) in myelin mutants (Cnp−/− and Plp−/y) and wildtype mice at 3-months (3m), 6-months (6m) and 24-months (24m). The percentage area covered was quantified in the indicated ROIs and is presented as fold-change (FC) with respect to the 3-month-old data set. Each heatmap tile represents a single animal/biological replicate/n (n = 3 per group) and is colour-coded according to the row minimum-maximum lookup table shown below. Statistical analysis and raw values are given in Supplementary Fig. 2. Source data
Extended Data Fig. 2
Extended Data Fig. 2. Microscopic analysis of plaque changes induced by genetic dysmyelination at 3 months of age in 5xFAD mice, 6-month old AppNLGF mice and myelin mutants on a WT background.
Extension of Fig. 2. (a-d) LSM analysis of 6-month-old Plp+/y5xFAD and Plp−/y5xFAD brains stained for Congo Red. (a) Representative LSM 2D single planes Inlays show closeup images of the cortex (Ctx) and alveus (Alv). Arrows indicate small amyloid deposits in the alveus. (b) 3D representation of hippocampal, isocortical and alveus plaques represented as coloured centroids. (c) 3D cropped regions of interest of brains rendered in maximum intensity modus. (d) 3D quantification of plaque load in the three regions of interest normalised to the respective region in control animals. Bars represent means; dots represent biological replicates/mice/n (n = 10 for control, n = 6 for mutant). Statistical analysis: two-sided, unpaired Student’s t-test (p-values are given above bars). (e) Quantifications of light sheet microscopic analysis of 3-months-old Cnp−/−5xFAD mice. Bars represent means; dots represent biological replicates/mice/n (n = 5 for control, n = 5 for KO). Statistical analysis: two-sided, unpaired Student’s t-test (p-values are given above bars). (f) Quantifications of light sheet microscopic analysis of 3-months-old Plp−/y5xFAD mice. Bars represent means; dots represent biological replicates/mice/n (n = 4 for control, n = 3 for KO). Statistical analysis: two-sided, unpaired Student’s t-test (p-values are given above bars). (g) Light sheet microscopic single plane closeup of the alveus region of Congo red stained brains of 3-month old 5xFAD control mice, Cnp−/−5xFAD, and Plp−/y5xFAD myelin mutants. Note the absence of plaques in the alveus at this age. Arrowheads indicate the alveus. CC:Corpus callosum, Alv: Alveus. Ctx: Cortex. Hip: Hippocampus. (h) Light sheet microscopic analysis of Cnp−/−AppNLGF brains shows enhanced plaque deposition at 6-month of age when compared to Cnp+/−AppNLGF controls. Left panel shows LSM single plane and a closeup of a cortical region. Right panel shows 3D maximum intensity projection of the cropped isocortical ROI. Plaque burden was quantified using machine-learning-based segmentation of amyloid plaques. Bars represent means; dots represent biological replicates/mice/n (n = 3 per group). Statistical analysis: two-sided, unpaired Student’s t-test (p-value is given in graph). (i) Light sheet microscopic analysis of plaque burden in aged (14-months old) Plp−/y brains on a WT background. As a positive control, a 14-months old 5xFAD brain with ample plaque pathology is shown. In aged WT and Plp−/y only non-specific nuclei or lipofuscin signals can be observed. No plaque-like structures could be identified in the whole brain. The same observations were made in three independent samples/mice for WT and Plp−/y. (j) Immunofluorescence staining of β-sheet positive plaques (Methoxy-04) and amyloid-β (4G8) in aged (22-months old) forebrain-specific PLP knockout animals (Emx-Cre Plpfl/fl). Note ample lipofuscin accumulation (autofluorescence) colocalising fully with signal in the 4G8 channel. No plaque-like structures could be identified in both groups. The same observations were made for four independent samples/mice per group. Source data
Extended Data Fig. 3
Extended Data Fig. 3. Myelin status in AD mouse models and myelin mutant crossbreedings and their behavioural analysis.
(a) Representative EM images of regions of the cingulate cortex and medial corpus callosum in AppNLGF and 5xFAD mice at 6 months of age. (b) Quantification of myelinated axon counts per field of view (FOV) of EM images as shown in (a). Dots represent single micrographs analysed. 5 images per animal/biological replicat/n were analysed (n = 5 for WT and AppNLGF, n = 6 for 5xFAD). Contoured dots represent the mean for each biological replicate. Statistical analysis: ordinary one-way ANOVA (p-value given in graphs) with Tukey’s multiple comparisons (no significant differences were found). (c) Analysis of myelin thickness by g-ratio measurements of single axons in the medial corpus callosum of WT, 5xFAD and AppNLGF mice at 6 months of age. Dots represent single axons analysed (WT = 477, 5xFAD = 512, AppNLGF = 533 from 3 animal/biological replicat/n per group); lines represent linear regression, dotted line represent 95% confidence bands. In the bar graph, bars represent means and dots represent biological replicates/mice/n (n = 3). Statistical analysis: ordinary one-way ANOVA (p-value given in graphs) with Tukey’s multiple comparisons. (d) Western blot analysis of myelin proteins MBP and CNP in 5xFAD and AppNLGF mice at 6 months of age in different brain regions (hemisphere, cortex, hippocampus). Molecular weight marker (in kDa) is indicated on the left. (e) Quantification of western blot analysis shown in (d). Relative protein abundance was determined by normalisation to total protein staining and wildtype levels. Bars represent means; dots represent biological replicates/mice/n (n = 4 per group). Statistical analysis: ordinary one-way ANOVA per group (antibody, brain region). p-values are given above bar graphs. (f) Closeups of myelin (anti-MBP) labelling in 6-months old WT, 5xFAD and AppNLGF mice in (DG), cornu ammonis (CA1), corpus callosum (CC), and cortex (CTX). (g) Quantification of myelin profiles (MBP+ area) in DG, CA1 and CTX and intensity in CC. Bars represent means; dots represent biological replicates/mice/n (n = 6 for WT, n = 6 for 5xFAD, n = 5 for AppNLGF). Statistical analysis: ordinary one-way ANOVA with Tukey’s multiple comparison test was performed. No significant (p < 0.05) differences were found. (h) Immunofluorescence closeups of myelin (MBP labelled) in plaque proximity (labelled with 6E10) in WT, 5xFAD and AppNLGF cortex. The same observations were made in different independent samples/mice per group (n = 6 for WT, n = 6 for 5xFAD, n = 5 for AppNLGF). (i) Closeups of myelin (anti-PLP) labelling in Cnp−/−5xFAD mice, corresponding single mutants (Cnp−/− and 5xFAD) and wildtype (WT) controls in the CA1, CTX and CC at 6 months of age. (j) Closeups of myelin (anti-CNP labelling in Plp−/y5xFAD mice, corresponding single mutants (Plp−/y and 5xFAD) and wildtype (WT) controls in the CA1, CTX and CC region at 6 month of age. (k) Quantification of myelin profiles (PLP+ area) in CA1 and CTX in Cnp−/−5xFAD brains shown in (i). Bars represent means; dots represent biological replicates/mice/n (n = 5 for WT, n = 6 for 5xFAD, n = 3 for Cnp−/−, n = 5 for Cnp−/−5xFAD). Statistical analysis: ordinary one-way ANOVA with Tukey’s multiple comparison tests. P-values for p < 0.05 are shown in the bar graph. Non-significant p-values are not shown. (l) Quantification of myelin profiles (CNP+ area) in CA1 and CTX in Plp−/y5xFAD brains shown in (j). Bars represent means; dots represent biological replicates/mice/n (n = 4 per group). Statistical analysis: ordinary one-way ANOVA with Tukey’s multiple comparison tests. P-values for p < 0.05 are shown in the bar graph. Non-significant p-values are not shown. (m) Representative tracks and images for the behaviour of Cnp−/−5xFAD female mice in the elevated plus maze (EPM), Y maze (YM) and the clasping test paradigms. (n) Quantification of the behaviour of Cnp−/−5xFAD female mice in the paradigms shown in (m). Bars represent means; dots represent biological replicates/mice/n (n = 10 for WT, n = 8 for 5xFAD, n = 9 for Cnp−/−, n = 10 for Cnp−/−5xFAD). (o) Representative tracks and images for the behaviour of Plp/y5xFAD male mice in the elevated plus maze (EPM), Y maze (YM) and the clasping test paradigms. (p) Quantification of the behaviour of Plp−/−5xFAD female mice in the paradigms shown in (m). Bars represent means; dots represent biological replicates/mice/n (n = 10 for WT, n = 8 for 5xFAD, n = 8 for Plp−/y, n = 10 for Plp−/y5xFAD). Statistical analysis for (n) and (p): two-way type III ANOVAs probing the main effects for the 5xFAD genotype (pAD) and the respective myelin-mutant genotype (pMY) as well as their interaction (pINT) followed by Tukey’s multiple comparisons posthoc test (p-value is given in the bar graphs). Source data
Extended Data Fig. 4
Extended Data Fig. 4. Cuprizone and EAE induced changes in brain myelin status and its influence on brain plaque burden.
(a) Histological analysis of Cuprizone-induced brain demyelination and microglia/macrophage infiltration after 4-week Cuprizone treatment by Iba1 and PLP immunostaining. Dashed lines border indicated ROIs: latCC = lateral corpus callosum. medCC = medial corpus callosum. Alv = Alveus. Fim = Fimbria. Closeup of immunostaining showing specific demyelination and microglia/macrophage accumulation of the medial corpus callosum and alveus after 4 weeks of Cuprizone treatment. Quantification of immunostaining for PLP (myelin) and microglia/macrophage (Iba1) in the alveus as shown in (a) throughout 2, 3 and 4 weeks of Cuprizone treatment. Bars represent means; dots represent biological replicates/mice/n (n = 3 per group). Dashed line represents mean background fluorescence of PLP staining. (b) Histological analysis of remyelination after a 4-week recovery period after Cuprizone withdrawal by Iba1 and PLP immunostaining. Bars represent means; dots represent biological replicates/mice/n (n = 6 per group). FStatistical analysis: two-sided, unpaired Student’s t-test (p-value is given in graph). (c) LSM single plane of Congo Red stained brains and closeups of the subiculum and a cortical region. Middle panel shows 3D distribution of isocortical and hippocampal plaques represented as centroids. Lower panel shows 3D maximum intensity projection of cropped regions of interest. Right lower panel shows 3D quantifications of plaque burden parameters in hippocampus and isocortex. Bars represent means; dots represent biological replicates/mice/n (n = 6 for control, n = 5 for Cup). Statistical analysis: two-sided, unpaired Student’s t-test (p-value is given in graph). (d) Neurological scoring shows successful EAE-induction in 5xFAD animals with typical disease onset at around day 10 post induction (dpi 10). Lines represent time courses for single animals/replicates/mice/n (n = 5). Dots represent daily scores. (e) 3D quantifications of plaque burden in the brain of EAE 5xFAD animals 4 weeks dpi (age 14 weeks). Bars represent means; dots represent biological replicates/mice/n (n = 4 for control, n = 5 for EAE 5xFAD). Statistical analysis: two-sided, unpaired Student’s t-test (p-value is given in graph). (f) Immunofluorescence analysis of potential brain lesions in the EAE brain using nuclei staining (DAPI) and anti-MBP staining. No classical lesions (accumulation of nuclei and corresponding loss of myelin) were observed in the brain. Lower panel shows closeup of the area indicated in the middle panel. (g) Immunofluorescence analysis of gliosis in the EAE brain using Iba1 and GFAP staining. (h) Quantification of myelin content and gliosis (as shown in (f) and (g)) in cortex and corpus callosum of the EAE brain. Bars represent means; dots represent biological replicates/mice/n (n = 3 for control, n = 4 for EAE). Statistical analysis: two-sided, unpaired Student’s t-test (p-value is given in graph). (i) Light sheet microscopic analysis of plaque burden in the lumbar spinal cord of EAE 5xFAD mice. No typical grey matter plaques could be detected in 14 week old 5xFAD or EAE 5xFAD mice. The lumbar spinal cord was heavily affected by EAE lesions as visualised by Iba1 staining.The same observations were made in three independent samples/mice per group (n = 4 for control, n = 5 for EAE 5xFAD). (j) As a positive control for successful detection of spinal cord plaques by light sheet microscopy, a cervical spinal cord of a 6-month-old 5xFAD animal is shown. Source data
Extended Data Fig. 5
Extended Data Fig. 5. Recombination territories and plaque load in forebrain shiverer 5xFAD mice.
(a) Basic characterisation of myelination in Emx-Cre Mbpfl/fl5xFAD mice. Autofluorescence shows a clear lack of myelinated profiles in the corpus callosum (arrows) while the thalamus and striatum show normal myelin profiles. The lower panel shows closeup images of anti-CNP and MBP co-immunolabelling in Emx-Cre Mbpfl/fl5xFAD. Lack of myelin compaction (MBPCNP+) throughout the cortex, hippocampus and subcortical white matter. Compaction of myelin is unaffected in other brain regions such as the thalamus and striatum (MBP+CNP+). The same observations were made in 5 independent samples/mice per group. (b-d) In toto plaque load in 3-month-old forebrain shiverer 5xFAD (Emx-Cre Mbpfl/fl 5xFAD). (b) Representative LSM 2D single planes show closeup images of the cortex (Ctx) and alveus (Alv). (c) 3D representation of hippocampal and isocortical represented as coloured centroids. (d) 3D cropped regions of interest of brains rendered in maximum intensity modus and 3D quantification of plaque load in the three regions of interest normalised to the respective region in control animals. Bars represent means; dots represent biological replicates/mice/n (n = 9 for control, n = 9 for mutant). Statistical analysis: two-sided, unpaired Student’s t-test (p-value is given in graph). (e) Quantification of light sheet microscopic analysis of plaque load in 6-month-old Emx-Cre Mbpfl/fl5xFAD mice. Bars represent means; dots represent biological replicates/mice/n (n = 4 per group). Statistical analysis: two-sided, unpaired Student’s t-test (p-value is given in graph). (f) Immunofluorescence labelling of amyloid plaques in the white matter of 6-month old 5xFAD control mice and different myelin mutant 5xFAD crossbreedings. Note the differences of white matter plaques in the amyelination model (Emx-Cre Mbpfl/fl5xFAD) versus dysmyelination models (Cnp−/−/Plp−/y 5xFAD) in regards to their distribution and appearance: While in Cnp−/− and Plp−/y crossbreedings enhanced plaque deposition is restricted to the alveus (two lower dashed lines), in Emx-Cre Mbpfl/f 5xFAD mice enhanced plaque deposition can also be seen in the corpus callosum (upper two dashed lines). Plaques in the alveus of Cnp−/− and Plp−/y crossbreedings appeared smaller and more numerous (white arrowheads), while alveus plaques in Emx-Cre Mbpfl/fl appeared bigger in size and more isolated (black contoured arrow heads). cc:corpus callosum, alv: alveus. The same observations were made in three independent samples/mice per group. Source data
Extended Data Fig. 6
Extended Data Fig. 6. Myelin dysfunction alters APP processing in Cnp−/−5xFAD and Plp−/y5xFAD mice.
Continuation from Fig. 3. (a) Overview of APP-stained swellings in the fimbria of 5xFAD control and Cnp−/−5xFAD mice. Hip: Hippocampus. Fim: Fimbria. The same observations were made in 5 independent samples/mice per group. (b) Colocalisation of APP and NF200 (axonal cytoskeletal marker) in swellings confirming their axonal origin in Cnp−/−5xFAD mice. White arrowheads indicate swellings double-positive for APP and NF200. Black-contured arrows indicate swellings that are solely positive for APP. This is likely a result of cytoskeletal breakdown in axonal swellings. The same observations were made in 3 independent samples/mice per group. (c) Distinction of plaque-associated axonal swellings induced by the 5xFAD genotype and myelin-damage-associated swellings induced by the Cnp−/− genotype. Upper panels are closeups of images shown in Fig. 3c. Lower panels show a mask indicating axonal swellings. Note that plaque-associated swellings form a circular arrangement of multiple swellings (corona) around a plaque centre (asteriks). In contrast, myelin damage-associated axonal swellings occur isolated/scattered. (d) Schematic representation of plaque-associated axonal swellings and myelin damage-associated swellings, and typical stainings observed with antibodies shown in Fig. 3b. D3E10, 80C2 and 6C3 do not show cross-reactivity to full length APP and typically only very weakly stain APP-positive plaque-associated swellings, but robustly stain swellings in Cnp−/−5xFAD mice. (e) Left panels shows positive staining controls for APP processing machinery antibodies used in Fig. 3 in the 5xFAD grey matter. For APP, BACE1 and PSEN2 typical plaque-corona staining (contoured arrowheads) can be observed. For APP and BACE1 additional neuronal cell body staining (n) can be observed. Right panel shows positive staining controls for amyloid antibodies used in Fig. 3 in the 5xFAD grey matter. Contoured arrowheads indicate proper amyloid plaques, typically stained very intensely. 029-2 and 6E10 antibodies show cross-reactivity to full-length APP and also stain plaque-associated axonal swellings (white arrowheads) and neurons (n). (f) 6E10 and sAPPβswe (soluble cleavage product after β-cleavage of APP) labelling of axonal swellings in Cnp−/−5xFAD fimbria. Figure 4d continued. Quantifications are shown on the right. Bars represent means; dots represent biological replicates/mice (for sAPPβswe, n = 4 for each group; for 6E10 labelling, n = 3 for 5xFAD controls and n = 5 for Cnp−/−5xFAD). Statistical analysis: two-sided, unpaired Student’s t-test (p-value is given in graphs). (g) Colocalisation of BACE1 and APP/Aβ in axonal swellings in Cnp−/−5xFAD white matter/fimbria. APP/Aβ was visualised using the 6E10 antibody. White arrowheads indicate swellings that are double-positive (to various degrees) for BACE1 and 6E10. Contoured black arrowheads indicate swellings single-positive for either 6E10 or BACE1. The same observations were made in 3 independent samples/mice per group. (h) sAPPβswe staining in cortical tissue of Cnp−/−5xFAD mice and 5xFAD controls. Staining reveals abundant plaque-associated swellings arranged in a swelling corona in 5xFAD mice. In Cnp−/−5xFAD both plaque-associated swellings and numerous plaque-independent swellings (i.e. myelin-damage-associated swellings) can be found. Quantification of sAPPβswe covered area is shown on the right. Bars represent means; dots represent biological replicates/mice/n (n = 4 per group). Statistical analysis: two-sided, unpaired Student’s t-test (p-value is given in graph). (i) Immunostaining analysis of APP/Amyloid-β and BACE1 in axonal swellings in Plp−/y5xFAD white matter (fimbria). (j) Quantifications of immunostainings shown in (i). Bars represent means; dots represent biological replicates/mice/n (n = 3 per group). Statistical analysis: two-sided, unpaired Student’s t-test (p-value is given in graph). (k) Colocalisation of BACE1 and APP/Aβ in axonal swellings in Plp−/y5xFAD mice. White arrows indicate a number of swellings in which colocalisation occurs. Contoured black arrows indicate swellings without colocalisation. The same observations were made in 3 independent samples/mice per group. (l) Fluorescent immunoblot analysis of BACE1 levels in the micro-dissected white matter of Cnp−/−5xFAD and 5xFAD mice. Molecular weight marker (in kDa) is indicated on the left. Bars represent means; dots represent biological replicates/lanes/mice/n (n = 3 per group). Statistical analysis: two-sided, unpaired Student’s t-test (p-value is given in graph). Source data are given in Supplementary Fig. 1. (m) Immunoblot analysis of APP processing using the 6E10 antibody. Molecular weight marker (in kDa) is indicated on the left. Anti-c-terminal APP labelling was applied to identify different APP CTF fragments: (p)C99 6E10 and A8717 double-positive; C89 and C83 6E10 negative and A8717 positive. Bars represent means; dots represent biological replicates/lanes/mice/n (n = 3 per group). Statistical analysis: two-sided, unpaired Student’s t-test (p-value is given in graph). Source data are given in Supplementary Fig. 3. (n) Fluorescent immunoblot analysis of APP fragmentation in the membrane-bound fraction of micro-dissected white matter (corpus callosum + alveus) of Cnp−/− 5xFAD and 5xFAD control mice. Molecular weight marker (in kDa) is indicated on the left. (o) Quantification of western blot analysis shown in (n). Bars represent means; dots represent biological replicates/lanes/mice/n (n = 3 per group). Statistical analysis: two-sided, unpaired Student’s t-test (p-value is given in graph). Source data are given in Supplementary Fig. 1. Source data
Extended Data Fig. 7
Extended Data Fig. 7. In vitro and in vivo analysis of microglia challenged by myelin and amyloid.
(a) Scheme illustrating the experimental setup to study amyloid phagocytosis after myelin digestion. Bone marrow-derived macrophages (BMDMs) were isolated and treated with myelin debris for 12h (1) prior to incubation with HiLyte488-labelled Aβ42 for 4h (2). The internalisation of Aβ42 was assessed by microscopy. (b) Representative immunofluorescence images of BMDMs treated with HiLyte488-labelled Aβ42 with and without (control) prior myelin treatment. Quantification of amyloid internalisation normalised to Lectin+ area is given on the right. Bars represent means; dots represent replicates/coverslips/n. (n = 3 per group, with 2-3 quantified images per coverslips). Statistical analysis: two-sided, unpaired Student’s t-test (p-value is given in graph). (c) Representative images of microglia immunostainings (Iba1 and DAPI) in 6-months old Cnp−/−5xFAD mice and respective controls (WT, Cnp−/− and 5xFAD). Dotted line highlights the border between cortical (CTX) and callosal tissue (CC). (d) Quantification of microgliosis (number of microglia, Iba1+ area) in 6-months old Cnp−/−5xFAD mice and respective controls (WT, Cnp−/− and 5xFAD) in the corpus callosum (CC) and cortex (CTX). Bars represent means; dots represent biological replicates/mice (n = 5 for WT, n = 6 for 5xFAD, n = 3 for Cnp−/−, n = 5 for Cnp−/−5xFAD) Statistical analysis: ordinary one-way ANOVA with Tukey’s posthoc test for multiple comparisons (p-values for the posthoc test for all p < 0.05 are given in the graphs). (e) Representative images of microglia immunostainings (Iba1 and DAPI) in 6-months old Plp−/y5xFAD mice and respective controls (WT, Plp−/y and 5xFAD). Dotted line highlights the border between cortical (CTX) and callosal tissue (CC). (f) Quantification of microgliosis (number of microglia, Iba1+ area) in 6-months old Plp−/y5xFAD mice and respective controls (WT, Plp−/y and 5xFAD) in the corpus callosum (CC) and cortex (CTX). Bars represent means; dots represent biological replicates/mice (n = 4 for each experimental group). Statistical analysis: ordinary one-way ANOVA with Tukey’s posthoc test for multiple comparisons (p-values for the posthoc test for all p < 0.1 are given in the graphs). (g) Microscopic analysis of microglial corralling by amyloid (6E10), microglia (Iba1) and nucleus (DAPI) co-labelling in 6-month-old Cnp−/−5xFAD and 5xFAD control mice. Upper panel: overview images of the Iba1 staining. Lower panel: closeup of a cortical region. Quantification of microglia corralling (number of microglia per plaque) in the cortex is given on the right. Violin plots show the distributions for single biological replicates/mice/n (n = 3 per genotype, 50 plaques per replicate). Black lines in violin plots indicate medians. Bar graph on the right shows the comparison of means (n = 3 per genotype, 50 plaques per replicate). Statistical analysis: Two-sided, unpaired Student’s t-test (p-value is given above graph). Right, lower panel: closeup of a representative microglia-plaque interaction in each genotype. (h) Microscopic analysis of microglial corralling by amyloid (6E10), microglia (Iba1) and nucleus (DAPI) co-labelling in 6-month-old Cnp−/−AppNLGF and Cnp+/−AppNLGF control mice. Upper panel: overview images of the Iba1 staining. Lower panel: closeup of a cortical region. Quantification of microglia corralling (number of microglia per plaque) in the cortex of Cnp−/−AppNLGF and Cnp+/−AppNLGF. Violin plots show the distributions for single biological replicates/mice/n (n = 3 per genotype, 50 plaques per replicate). Black lines in violin plots indicate medians. Bar graph on the right shows the comparison of means (n = 3 per genotype, 50 plaques per replicate). Line indicates means. Statistical analysis: Two-sided, unpaired Student’s t-test (p-value is given above graph). Right, lower panel: closeup of a representative microglia-plaque interaction per genotype. (i) Microscopic analysis of microglial corralling by amyloid (6E10), microglia (Iba1) and nucleus (DAPI) co-labelling in 6-month-old Plp−/y5xFAD and 5xFAD control mice. Upper panel: overview images of the Iba1 staining. Lower panel: closeup of a cortical region. (j) Quantification of microglia corralling (number of microglia per plaque) in the cortex of 6-month old Plp−/y5xFAD and 5xFAD. Violin plots show the distributions for single biological replicates/mice/n (n = 3 per genotype, 50 plaques per replicate). Black line in violin plots indicate medians. Bar graph on the right shows the comparison of means (n = 3 per genotype, 50 plaques per replicate). Line indicates mean. Statistical analysis: Two-sided, unpaired Student’s t-test (p-value is given above graph). (k) Quantifications of microglia corralling (microglia coverage per plaque) in the cortex of 6-month-old Plp−/y5xFAD and 5xFAD. Violin plots show the distributions for single biological replicates/mice/n (n = 3 per genotype; 2010 plaques for 5xFAD and 2529 plaques for Plp−/y5xFAD genotype in total). Black line in violin plots indicate medians. Bar graph on the right shows the comparison of medians (n = 3 per genotype). Line indicates mean. Statistical analysis: Two-sided, unpaired Student’s t-test (p-value is given above graph). (l) Microscopic analysis of microglial corralling in Cuprizone-treated 5xFAD animals by amyloid (6E10), microglia (Iba1) and nucleus (DAPI) co-labelling. Note residual white matter gliosis in Cuprizone 5xFAD mice and small amyloid deposits highlighted by white arrowheads. The same observations were made in different independent samples/mice per group (n = 4 for 5xFAD and n = 5 for Cuprizone 5xFAD). (m) Microscopic analysis of microglial corralling in EAE 5xFAD animals by amyloid (6E10), microglia (Iba1) and nucleus (DAPI) co-labelling. A comparison of a non-lesion site versus a lesion site is shown. Note the massive microglia/macrophage infiltration at the lesion site that made corralling analysis difficult. The same observations were made in different independent samples/mice per group (n = 5 for 5xFAD and n = 5 for Cuprizone 5xFAD). Source data
Extended Data Fig. 8
Extended Data Fig. 8. Analysis of microglia bulk RNA sequencing data from Cnp−/−5xFAD, single mutants and WT controls.
Extension of Fig. 4. (a) Venn diagram presentation of shared/unique differentially expressed genes (DEGs) between experimental groups (compared to WT). (b) Myelin-related transcript cluster in the top100 gene list contributing to principal component 1 (PC1). Note that the detection of myelin-related transcripts most likely results from myelin contamination in the CD11b-MACS purified fraction. Decreased contamination (i.e. higher purity) in 5xFAD, Cnp−/− and Cnp−/−5xFAD is presumably linked to the increased number of microglia cells and advanced tissue disintegration in inflammatory conditions. Each heatmap tile represents a single animal/biological replicate/n (n = 4 per genotype). (c) Volcano plot representation of differentially expressed genes in single mutants (5xFAD, Cnp−/−) and double mutant Cnp−/−5xFAD in comparison to WT animals (significant cutoff adjP < 0.01, log2FC > 1.0), (d) Line plots for the 10 DEG groups identified by k-means clustering (based on scaled TPM values) with unique trajectories throughout genotypes/experimental groups. Lines represent connections between individual genotype data. Error bars represent SD. (e) Heatmap of normalised mean expression pattern in the 10 DEG clusters across different genotypes. Each cluster of genes underwent GO enrichment analysis using gprofiler2, and significantly enriched terms were analysed for their similarities. The left-side coloured heatmap indicates GO term significant levels across each cluster. The adjacent grayscale heatmap shows cluster similarities based on their enriched GO terms. Most representative keywords shared by enriched GO terms are given in the text boxes on the right side. (f) Volcano plot representation of differentially expressed genes between Cnp−/−5xFAD and 5xFAD microglia (significant cutoff adjP < 0.01, log2FC > 1.0). (g) Top100 differentially regulated genes (based on significant levels) between Cnp−/−5xFAD and 5xFAD microglia. Left panel shows genes upregulated in Cnp−/−5xFAD. Right panel shows genes downregulated in Cnp−/−5xFAD. (h) Correlation analysis of DEGs in Cnp−/−5xFAD and 5xFAD in comparison to WT, respectively, reveals highly correlated gene regulations. Pearson correlation coefficient (R) and corresponding p-value is given in the graph. (i) Functional enrichment analysis of DEGs from Cnp−/−5xFAD vs 5xFAD using gprofiler and gene set enrichment analysis (GSEA). For each analysis, gene ontology biological process and pathway enrichment is given, and the top 20 significant terms are presented as barplots. The colour indicates the proportion of genes involved in each enriched term. (j) STRING interaction analysis of DEGs (significant cutoff adjP < 0.01) between Cnp−/−5xFAD and 5xFAD (confidence 0.9, n = 219 nodes with connections are displayed). The colours of the edges indicate interaction form. Source data
Extended Data Fig. 9
Extended Data Fig. 9. snRNA-seq analysis of Cnp−/−5xFAD and respective single mutant controls.
Continuation of Fig. 5. (a) Left panel shows Western blot analysis of Trem2 levels in WT vs 5xFAD mice demonstrating clear induction of full length Trem2 (30–60 kDa, glycosylated forms) and enhanced Trem2 cleavage (~12 kDa) in 5xFAD mice. Lanes present single animals/biological replicates/n (n = 3 per group). The right panel shows Western blot analysis of Trem2 levels in Cnp−/− 5xFAD and 5xFAD mice. No differences in Trem2 cleavage could be detected. Total protein fastgreen staining is shown as loading control. Lanes present single animals/biological replicates/n (n = 3 per group). Source data are given in Supplementary Fig. 3. (b) Cell type distribution and annotations from 6-month-old mouse brain hemisphere snRNA-seq data visualised in the UMAP space. In total 4 genotypes (WT, Cnp−/−, 5xFAD, and Cnp−/−5xFAD) were included and 61,949 cells passed quality controls for downstream analysis. Right panel shows microglial cells highlighted in yellow in UMAP space. (c) Heatmap visualisation of scaled marker gene expressions at single-cell level. For each cell population, a random n = 1000 cells were selected to be displayed. For NFOL and pericyte, all cells are shown (total cell numbers from both populations were under 1000). (d) Violin plots showing gene expressions across oligodendroglia and microglia subpopulations (microglia detailed subpopulations annotated in Fig. 5b). (e) Ms4a7 fluorescent single molecule in situ hybridisation (RNAscope) in combination with Iba1 immunostaining on 5xFAD and Cnp−/−5xFAD brain tissue. The same observations were made in different independent samples/mice per group (n = 3 per group). (f) 2D zoom in on UMAP representation of amyloid and myelin DAM colour coded to cluster annotation (left panel) or genotype (right panel). (g) 3D representation of DAM clusters colour-coded according to genotype. (h) Volcano plot representation of DEGs between DAM subclusters and between genotypes within Amyloid- and Myelin-DAM clusters. (i) Heatmap representation of genes commonly regulated in-between DAM clusters and between genotypes in specific DAM clusters. (j) Immunofluorescence analysis of myelin phagocytosis (PLP+) by microglia (Iba1+) in the cortex of Cnp−/−5xFAD mice. Quantification on the right shows the number of myelin-positive(PLP+) microglia (Iba1+). Bars represent means, dots represent single mice/biological replicates/n (n = 3 for 5xFAD, n = 4 for Cnp−/−5xFAD). Statistical analysis: Two-sided, unpaired Student’s t-test (p-value is given in the graph). Source data
Extended Data Fig. 10
Extended Data Fig. 10. Lack of microglia activation and APP metabolism changes in forebrain shiverer 5xFAD mice and MS4A cluster gene expression in human AD microglia.
(a) Experimental setup to study microglia states in FB-shiv (forebrain shiverer) in comparison to wildtype controls and Cnp−/− brain by snRNAseq at 3 months of age. (b) Identification of microglia/macrophage subpopulations and genotype distribution visualised in the UMAP space. (c) Marker gene expression for the four identified clusters visualised in violin plots. (d) Number of microglia per microglia subtype and genotype. Different bars represent single animals/biological replicates (n = 2 per group). (e) Assessment of microglia coverage and morphology by Iba1 stainings in 3-month-old FB shiverer 5xFAD mice. Lower panel shows closeups of cells delineated by dashed lines in the upper panel. As a comparison and positive control for activated microglia a micrograph of Cnp−/−5xFAD is shown on the right. Bargraphs show quantification of Iba1+ area and microglia number in the cortex (CTX) and corpus callosum (CC). Bars represent means, dots represent animals/biological repolicates/n (n = 4 for control and n = 3 for FB shiverer mice). Statistical analysis: two-sided Student’s t-test (p-value is given in the graph). (f) Assessment of APP+ axonal swellings in the fimbria (FIM) of 3-month-old FB shiverer 5xFAD by 4G8 (APP/Aβ) immunolabeling. In both control 5xFAD mice and FB shiverer 5xFAD APP+ swellings were rarely or not found. The contoured arrow in the left micrograph highlights an amyloid plaque. As a comparison and positive control for APP+ swellings a micrograph of Cnp−/−5xFAD is shown on the right. Swellings are highlighted by arrowheads. Bars represent means, dots represent animals/biological repolicates/n (n = 4 for control and n = 3 for FB shiverer mice). Statistical analysis: two-sided Student’s t-test (p-value is given in the graph). (g) Western blot analysis of APP processing in FB shiverer 5xFAD mice. Bands for full-length APP (fAPP) and c-terminal fragments (CTFs) are shown. n = 3 biological replicates/mice/lanes per group. Source data are given in Supplementary Fig. 1. Molecular weight marker (in kDa) is given on the left. (h-k) Reanalysis of microglia subcluster of Mathys et al.. (h) Genotype and clustering distribution of the microglia/leukocyte subset in the Mathys et al. snRNA-seq dataset visualised in the UMAP space. Hom = homeostatic microglia, DAM = Disease-associated microglia, Ribo high = high in ribosomal transcripts. (i) Histogram representation of cell numbers in each subcluster according to sample condition (control versus AD). Bars represent cell numbers. (j) Expression analysis of classical DAM marker genes (TREM2, SPP1, APOE) and MS4A6A in the main microglial subcluster (leukocytes not shown) visualised in the UMAP space (left) and by dot plot representation (right). (k) Co-expression analysis of MS4A6A and SPP1 at the single-cell level visualised in the UMAP space. Colour indicates gene expression and co-expression level according to the colour scale shown on the right. (l-o) Reanalysis of microglia subcluster of and Zhou et al.. (l) Genotype and clustering distribution of the microglia/leukocyte subset in the Zhou et al. snRNA-seq dataset visualised in the UMAP space. Hom = homeostatic microglia, DAM = Disease-associated microglia, Histone high = high in histone transcript, MyTE = Myelin transcript enriched. (m) Histogram representation of cell numbers in each subcluster according to sample condition (control versus AD). (n) Expression analysis of classical DAM marker genes (TREM2, APOE), ABCA1, and MS4A6A in the main microglial subcluster (leukocytes, monocytes and MyTE not shown) visualised in the UMAP space (left) and by dot plot representation (right). (o) Co-expression analysis of MS4A7 and TREM2 at the single-cell level visualised in the UMAP space. Colour indicates gene expression and co-expression level according to the colour scale shown on the right. The results published here are in whole or in part based on data obtained from the AD Knowledge Portal (https://adknowledgeportal.org). Source data

Comment in

References

    1. Bowley MP, Cabral H, Rosene DL, Peters A. Age changes in myelinated nerve fibers of the cingulate bundle and corpus callosum in the rhesus monkey. J. Comp. Neurol. 2010;518:3046–3064. doi: 10.1002/cne.22379. - DOI - PMC - PubMed
    1. Safaiyan S, et al. Age-related myelin degradation burdens the clearance function of microglia during aging. Nat. Neurosci. 2016;19:995–998. doi: 10.1038/nn.4325. - DOI - PMC - PubMed
    1. Safaiyan S, et al. White matter aging drives microglial diversity. Neuron. 2021;109:1100–1117.e10. doi: 10.1016/j.neuron.2021.01.027. - DOI - PubMed
    1. Griffiths I, et al. Axonal swellings and degeneration in mice lacking the major proteolipid of myelin. Science. 1998;280:1610–1613. doi: 10.1126/science.280.5369.1610. - DOI - PubMed
    1. Fünfschilling U, et al. Glycolytic oligodendrocytes maintain myelin and long-term axonal integrity. Nature. 2012;485:517–521. doi: 10.1038/nature11007. - DOI - PMC - PubMed

Publication types

LinkOut - more resources