. 2023 Jun;618(7965):616-624.
doi: 10.1038/s41586-023-06139-9. Epub 2023 May 31.

Transfer learning enables predictions in network biology

Affiliations

Transfer learning enables predictions in network biology

Christina V Theodoris et al. Nature. 2023 Jun.

Abstract

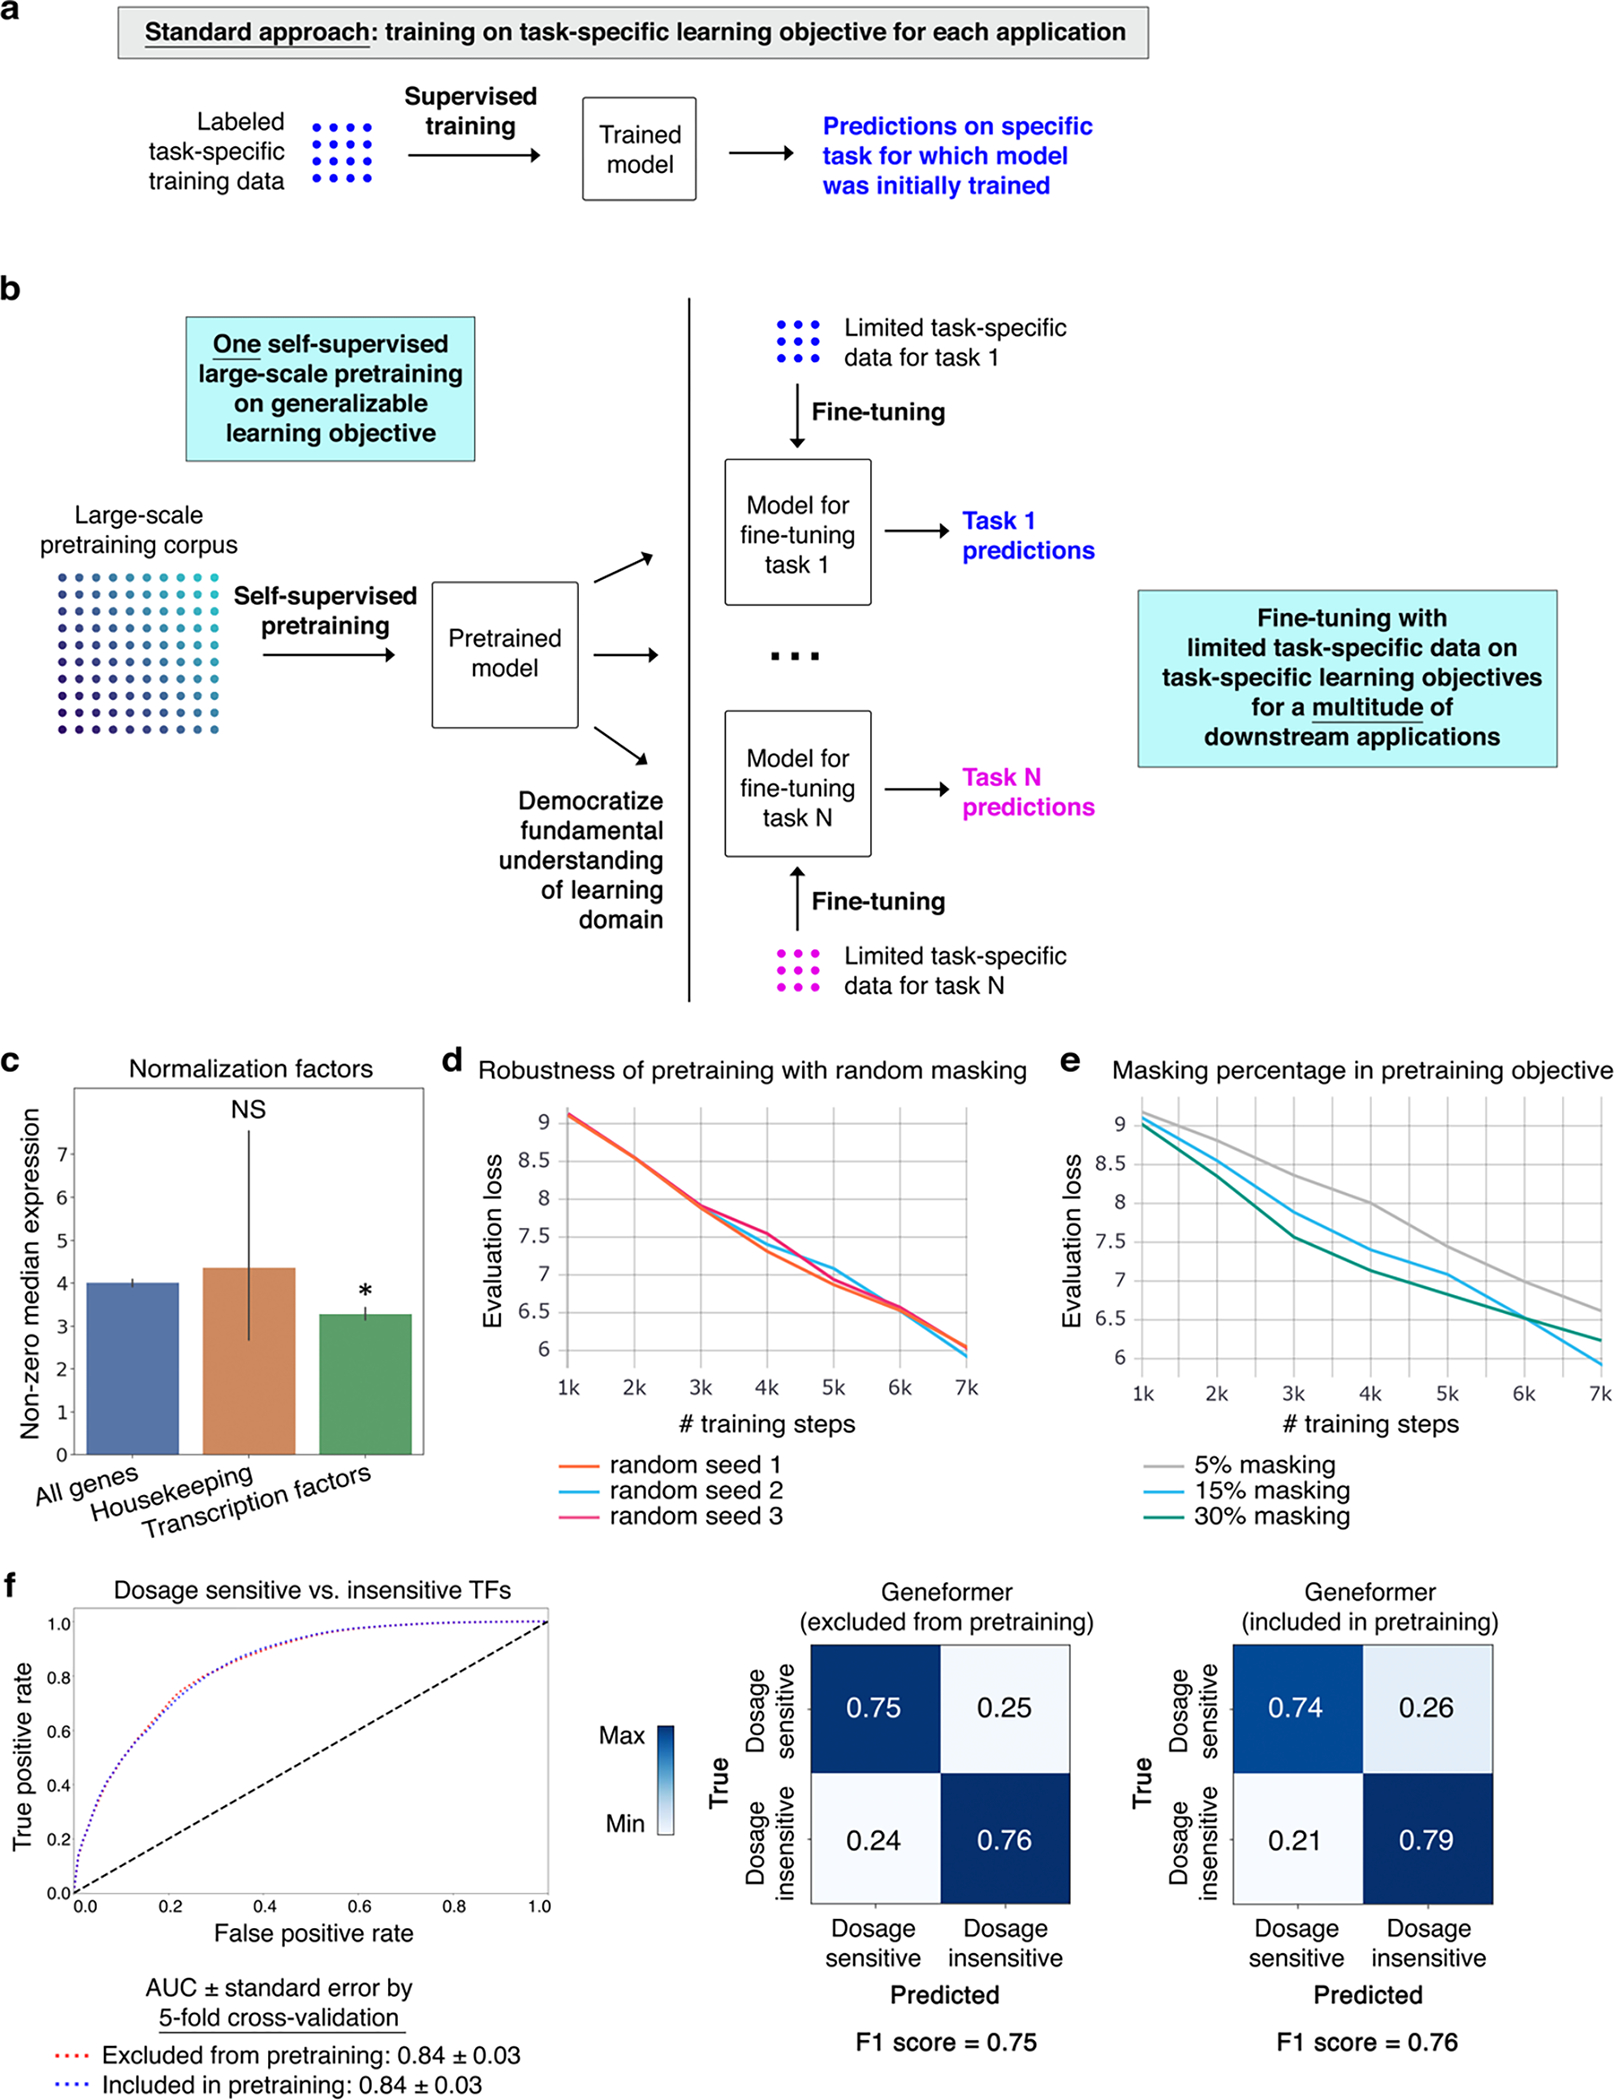
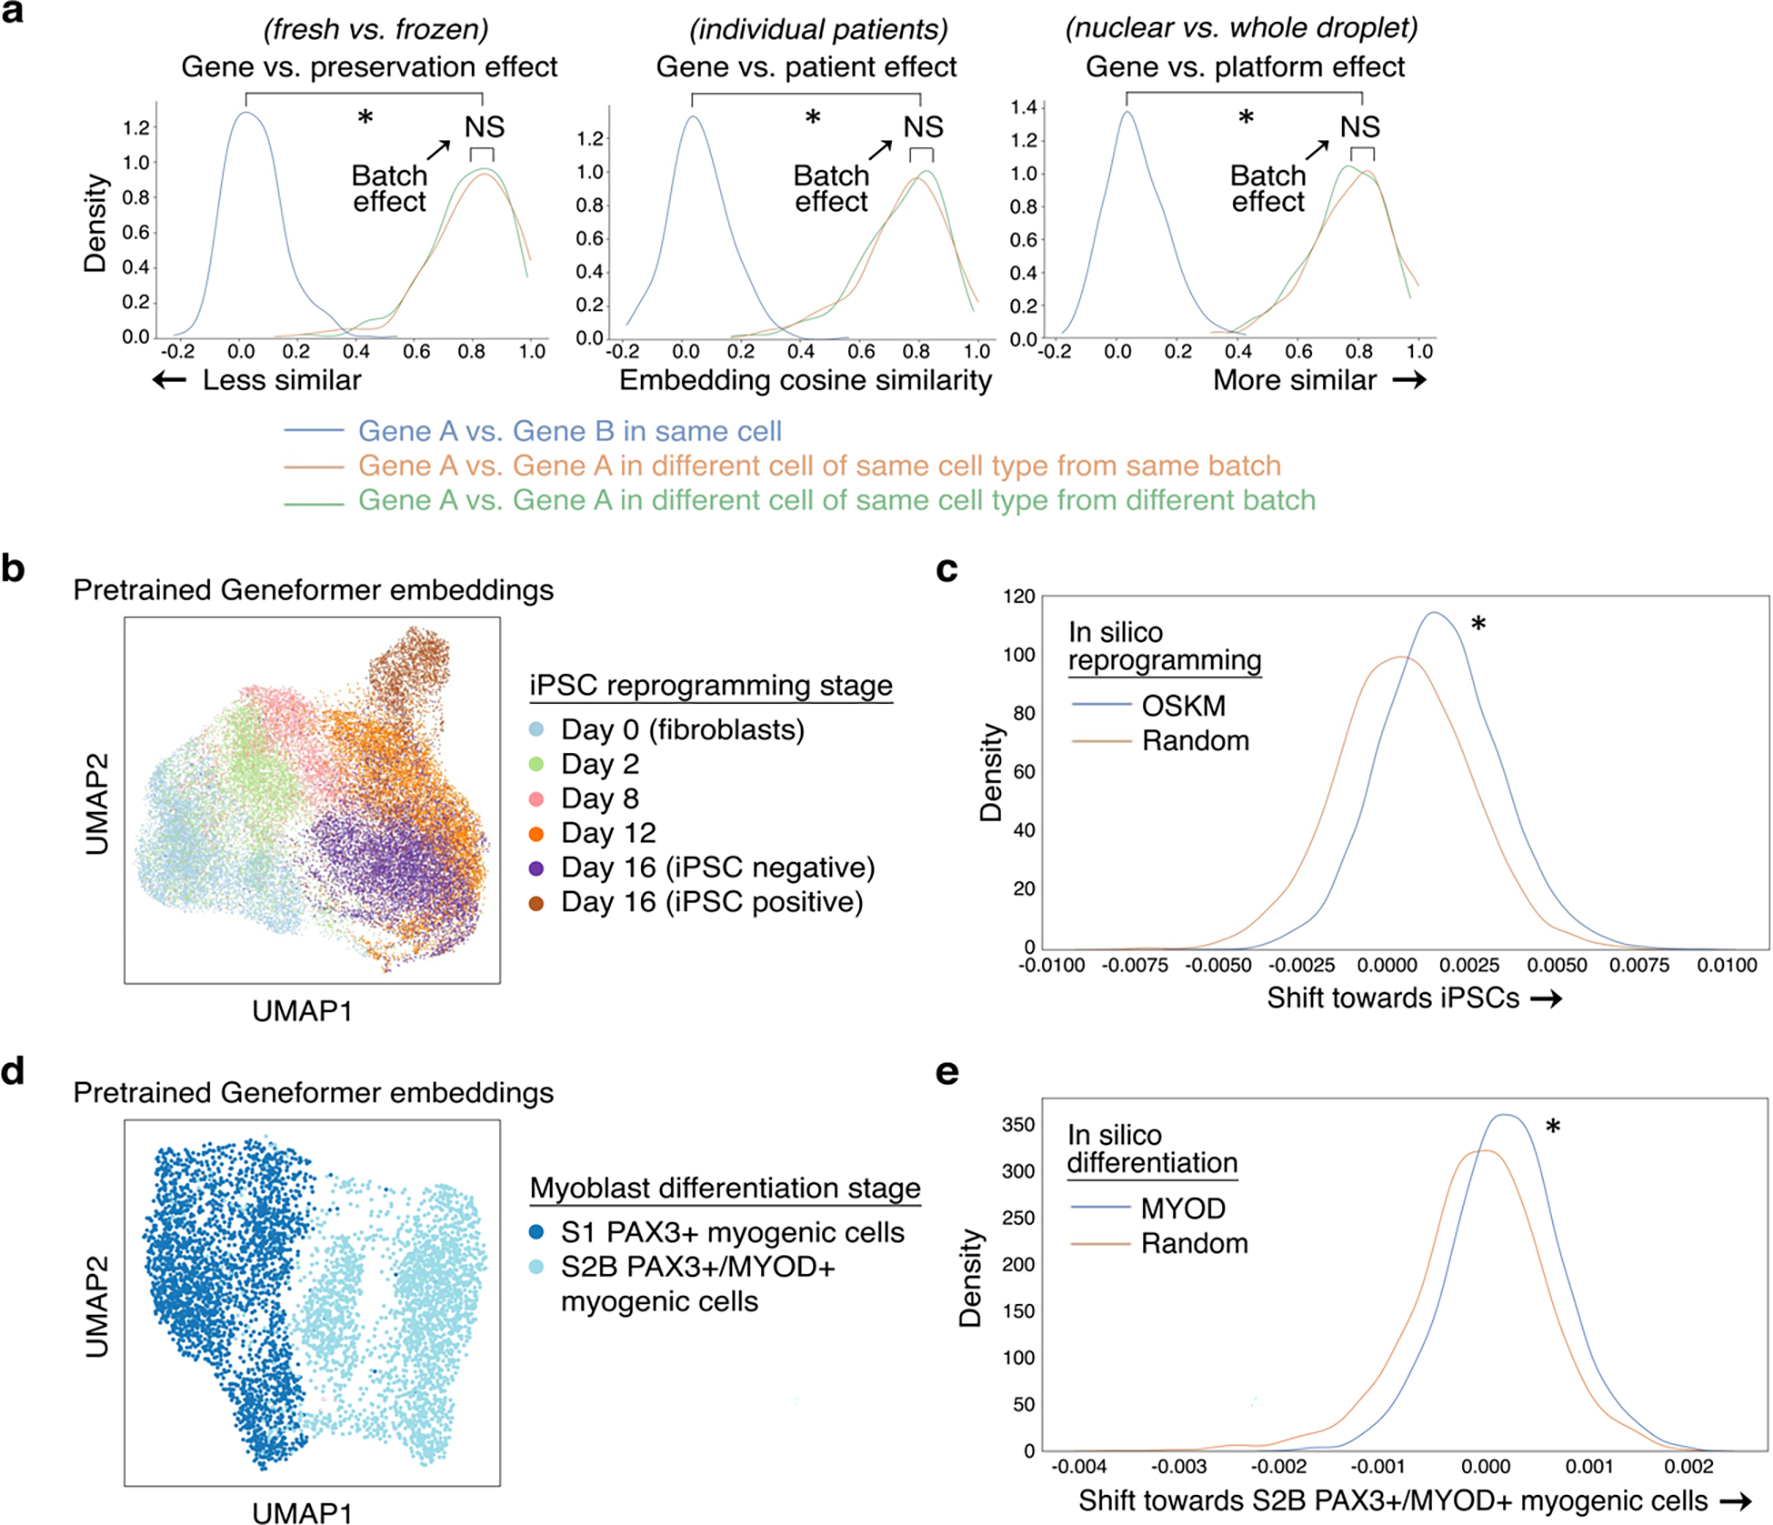
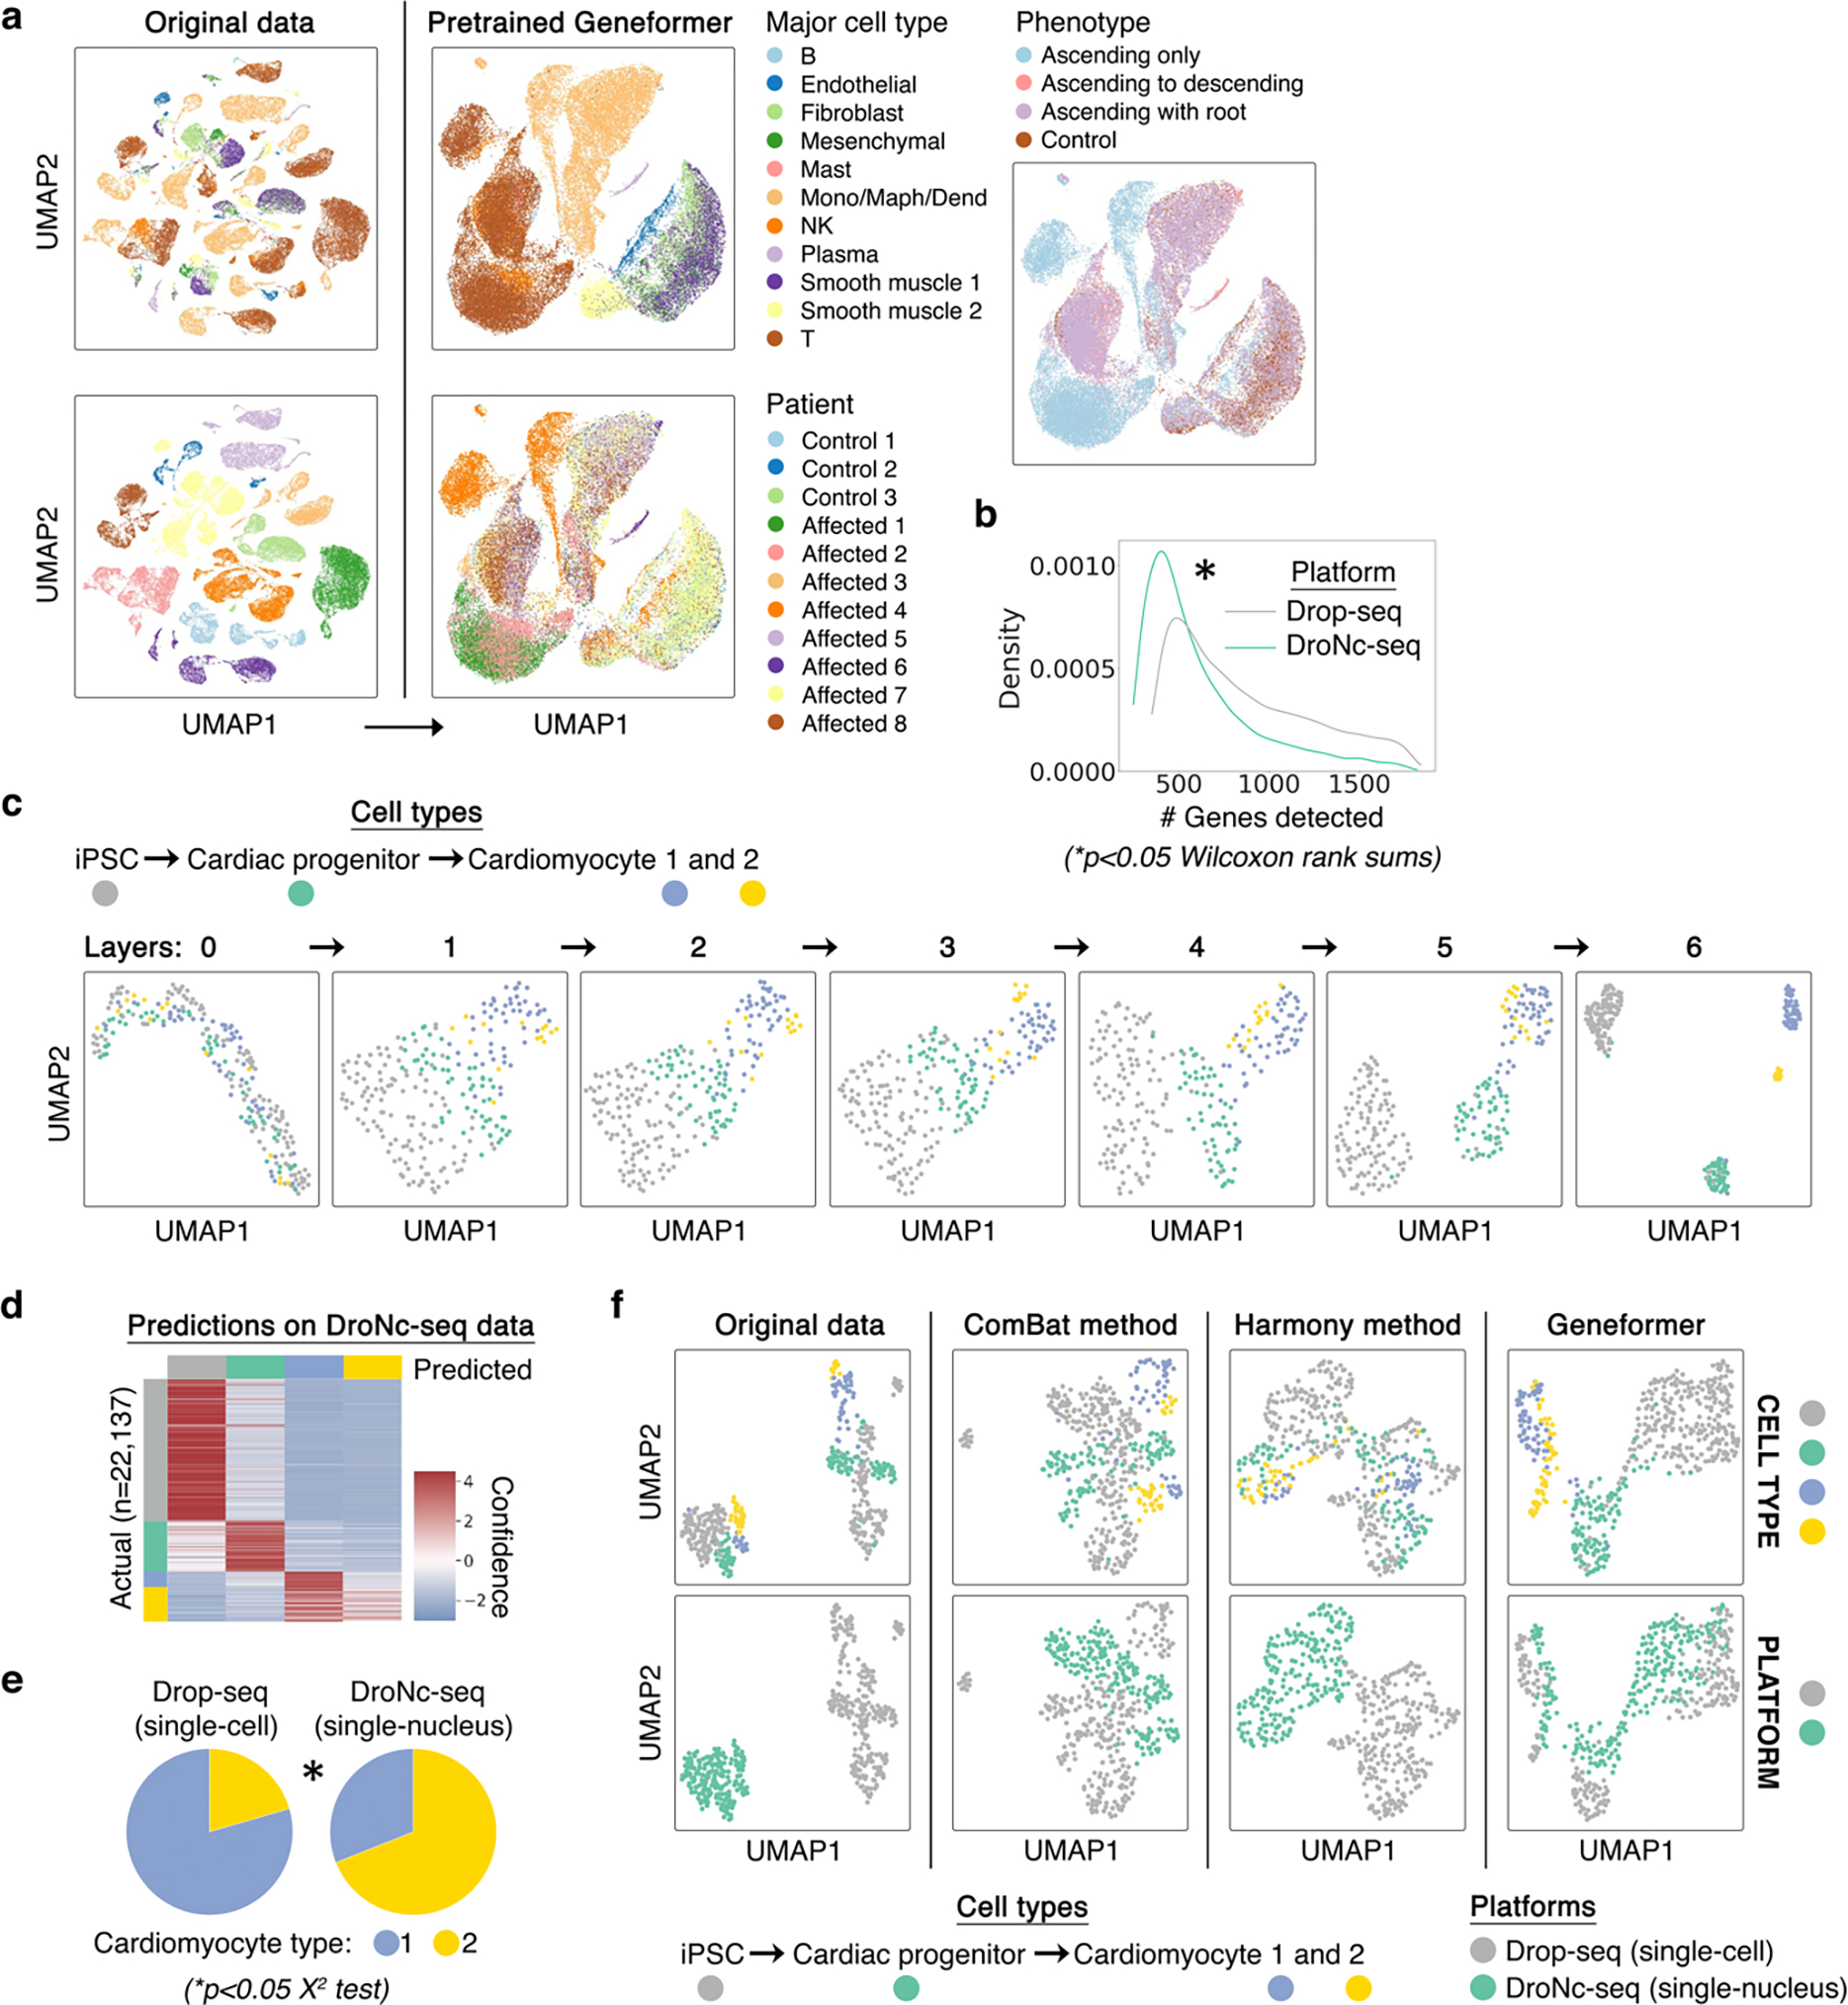
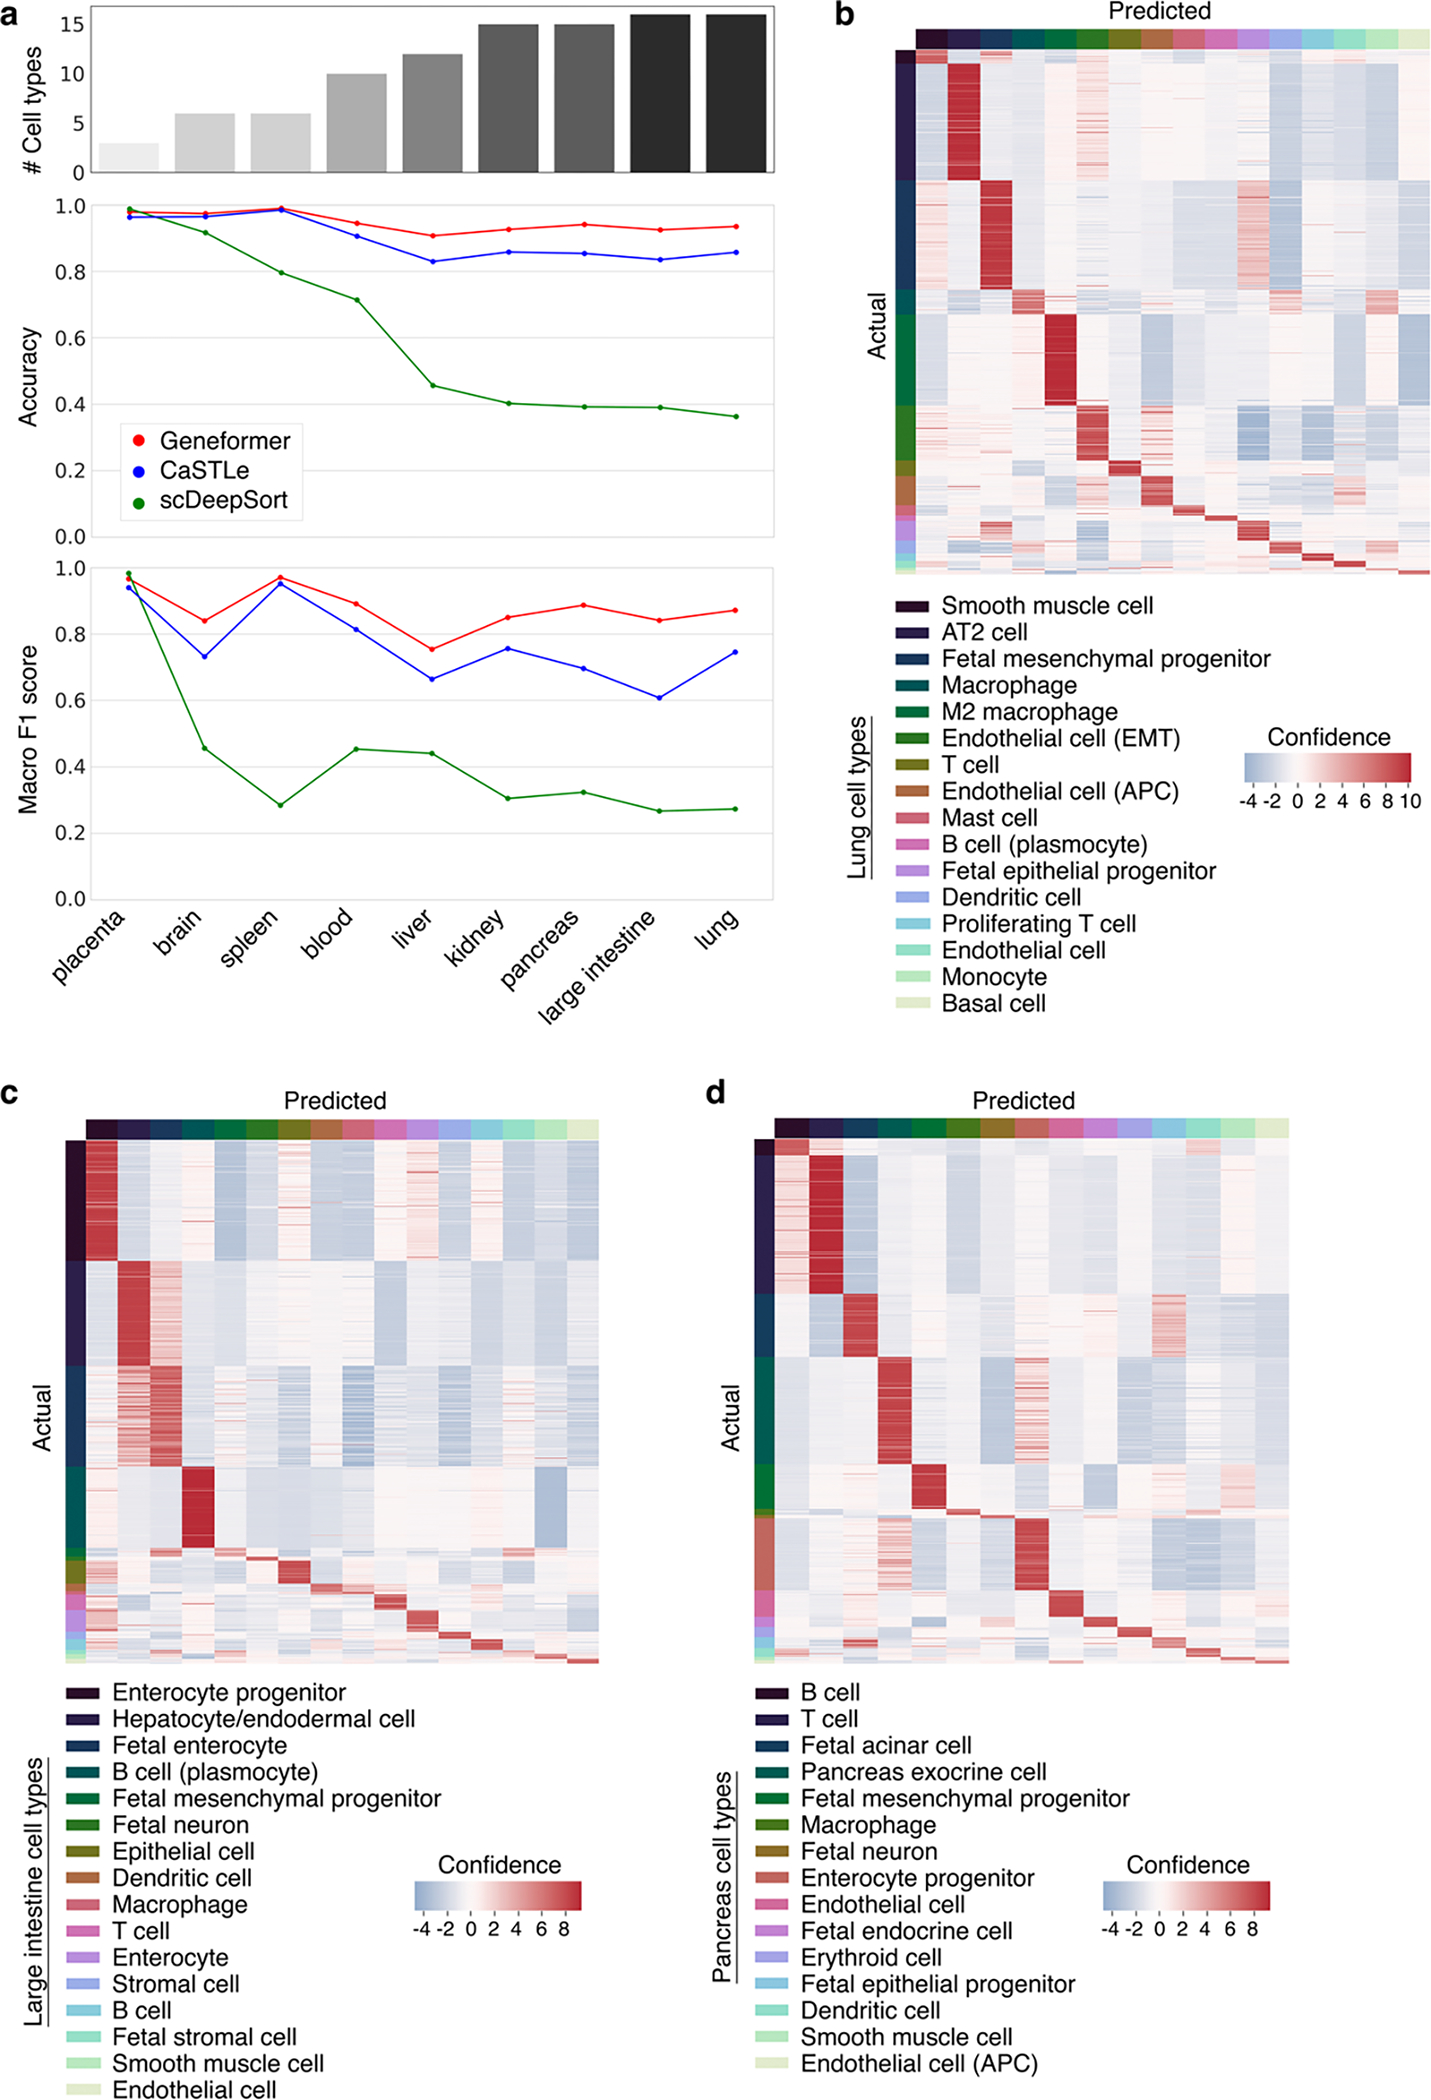
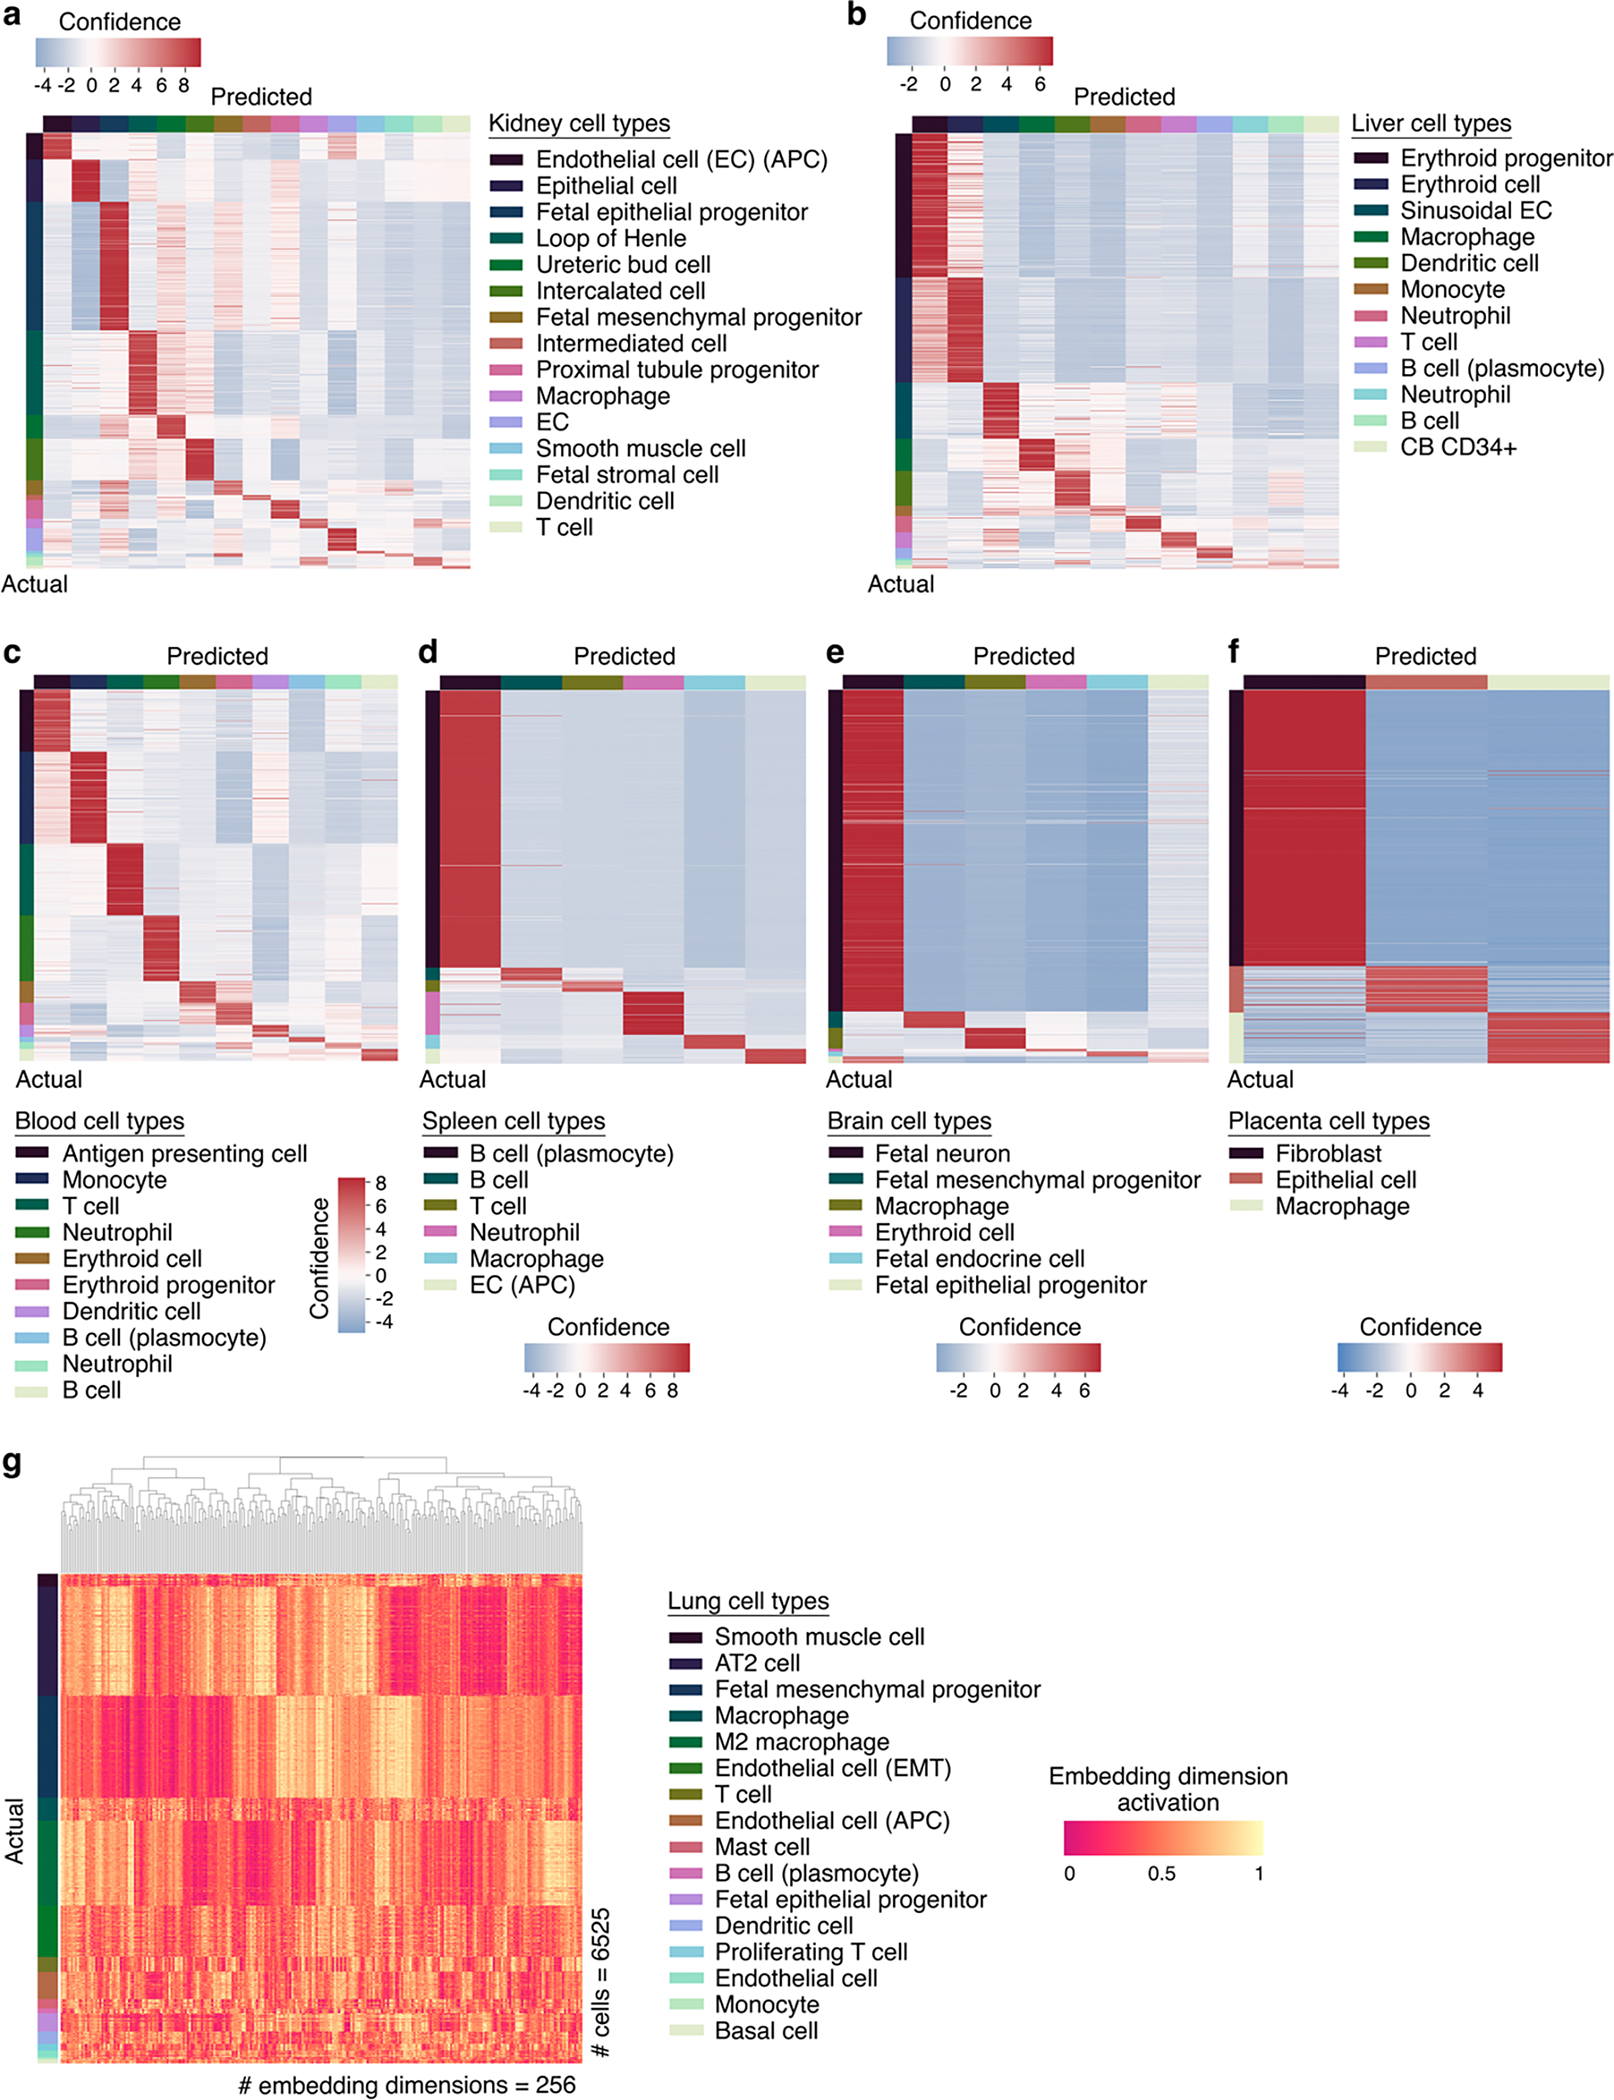
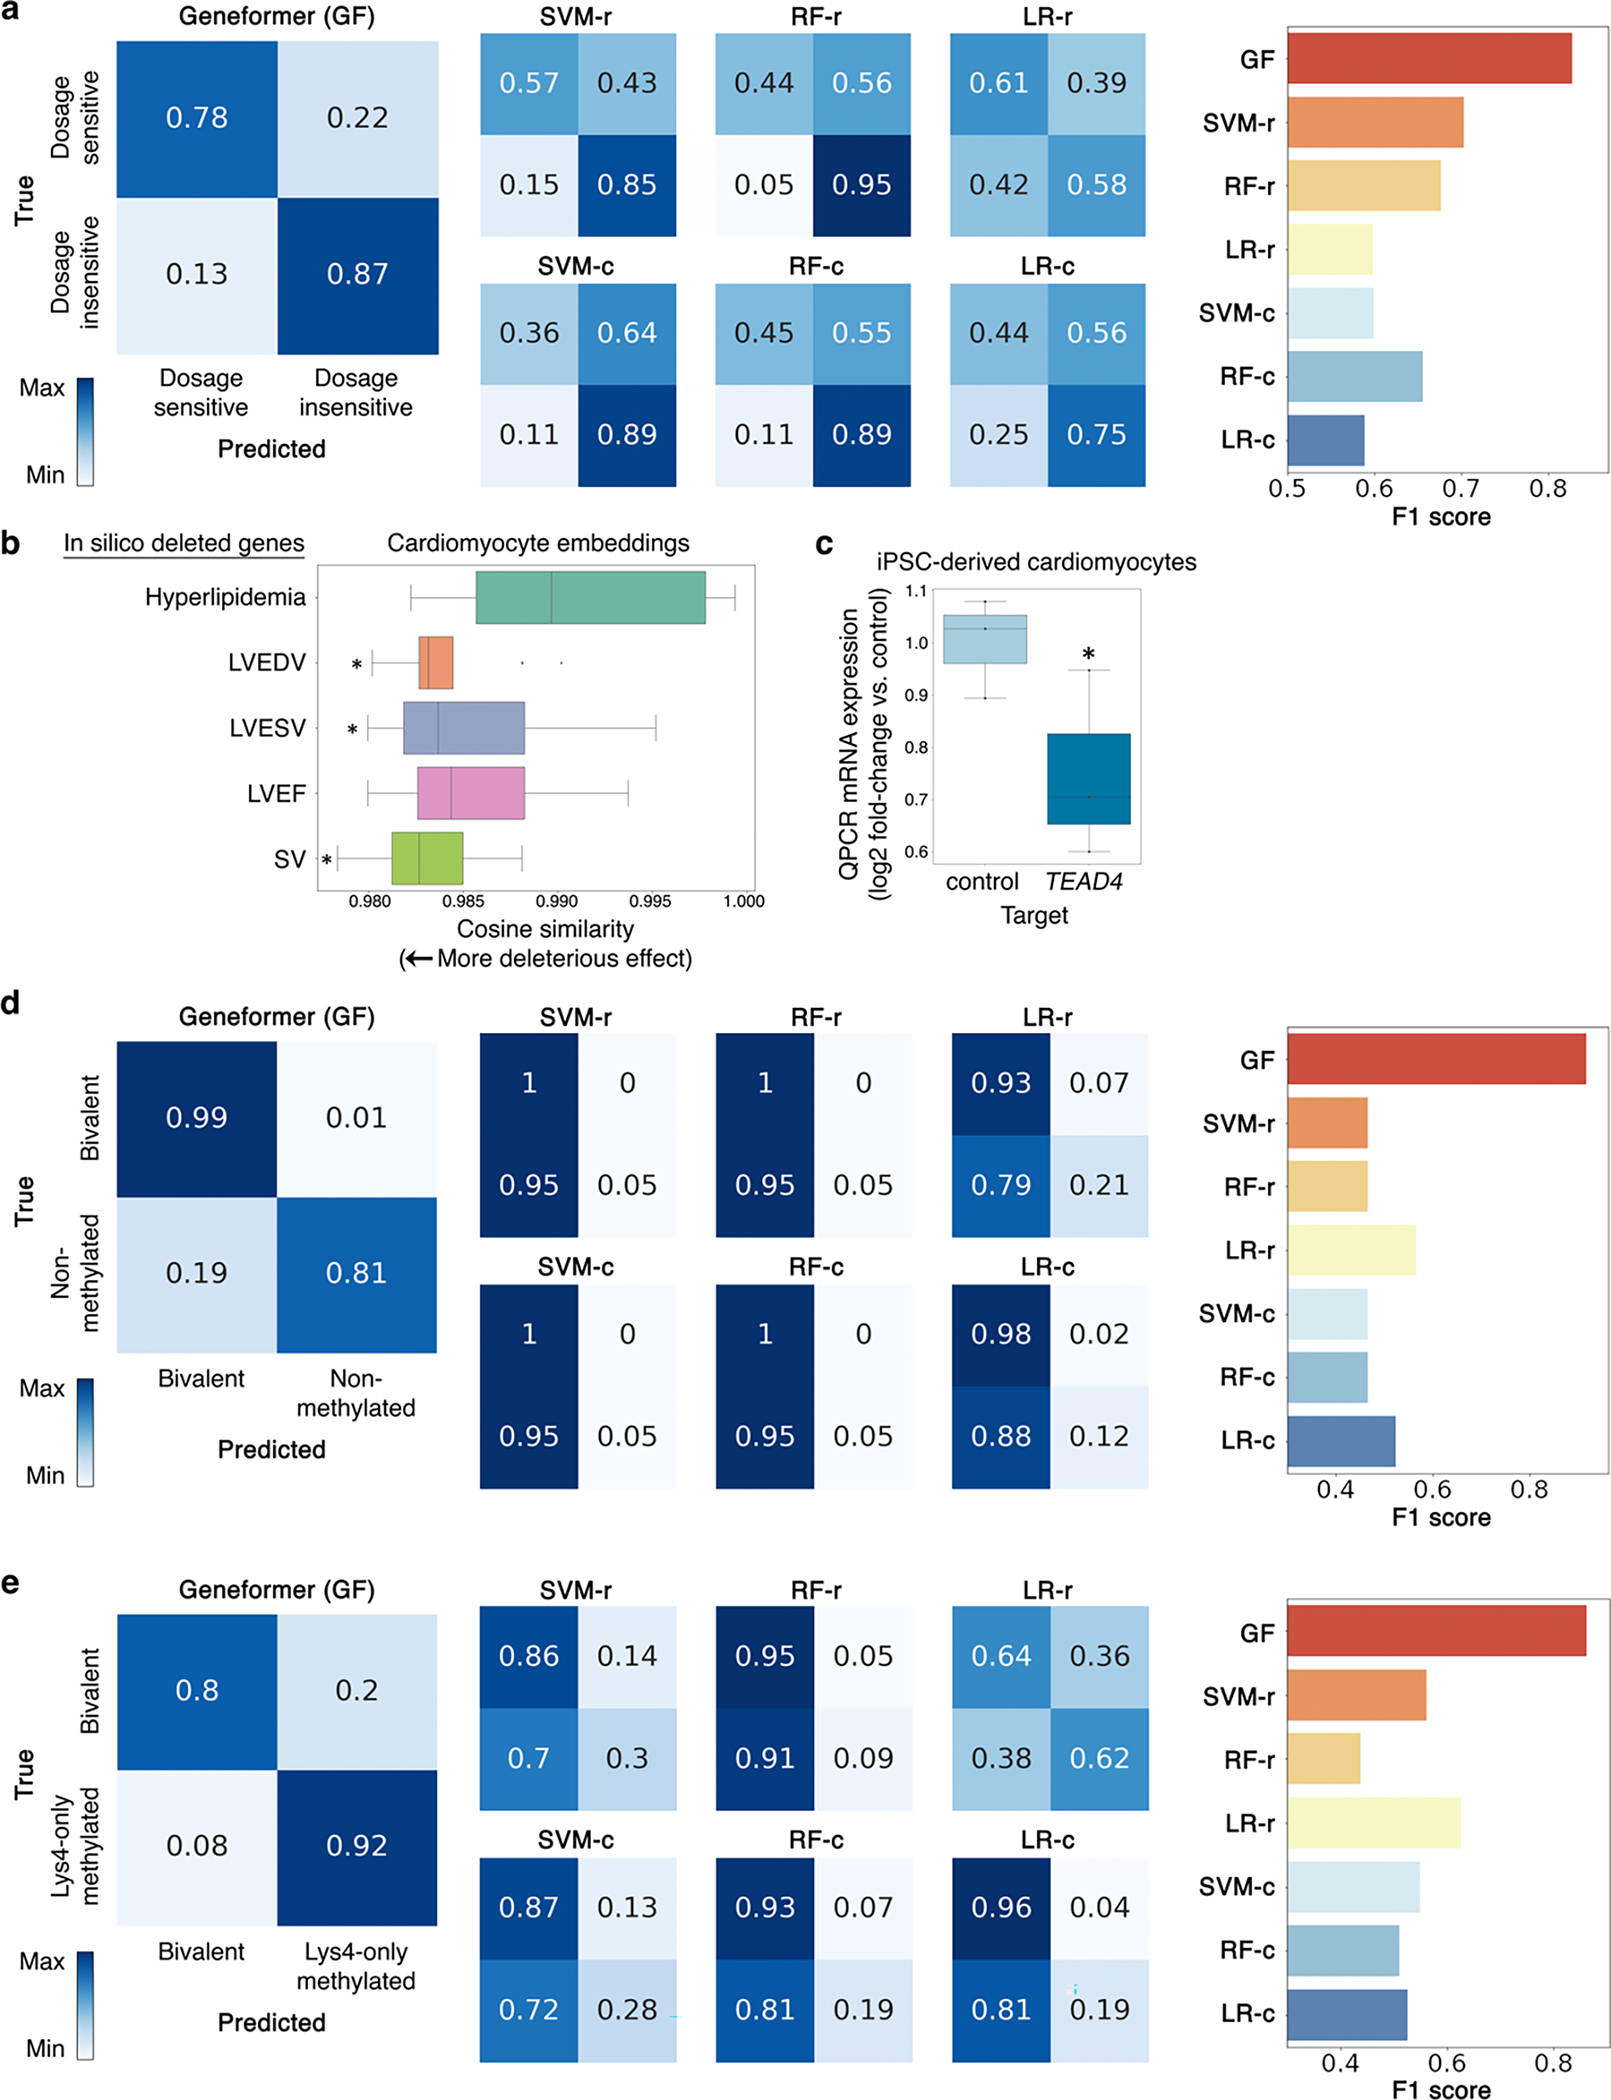
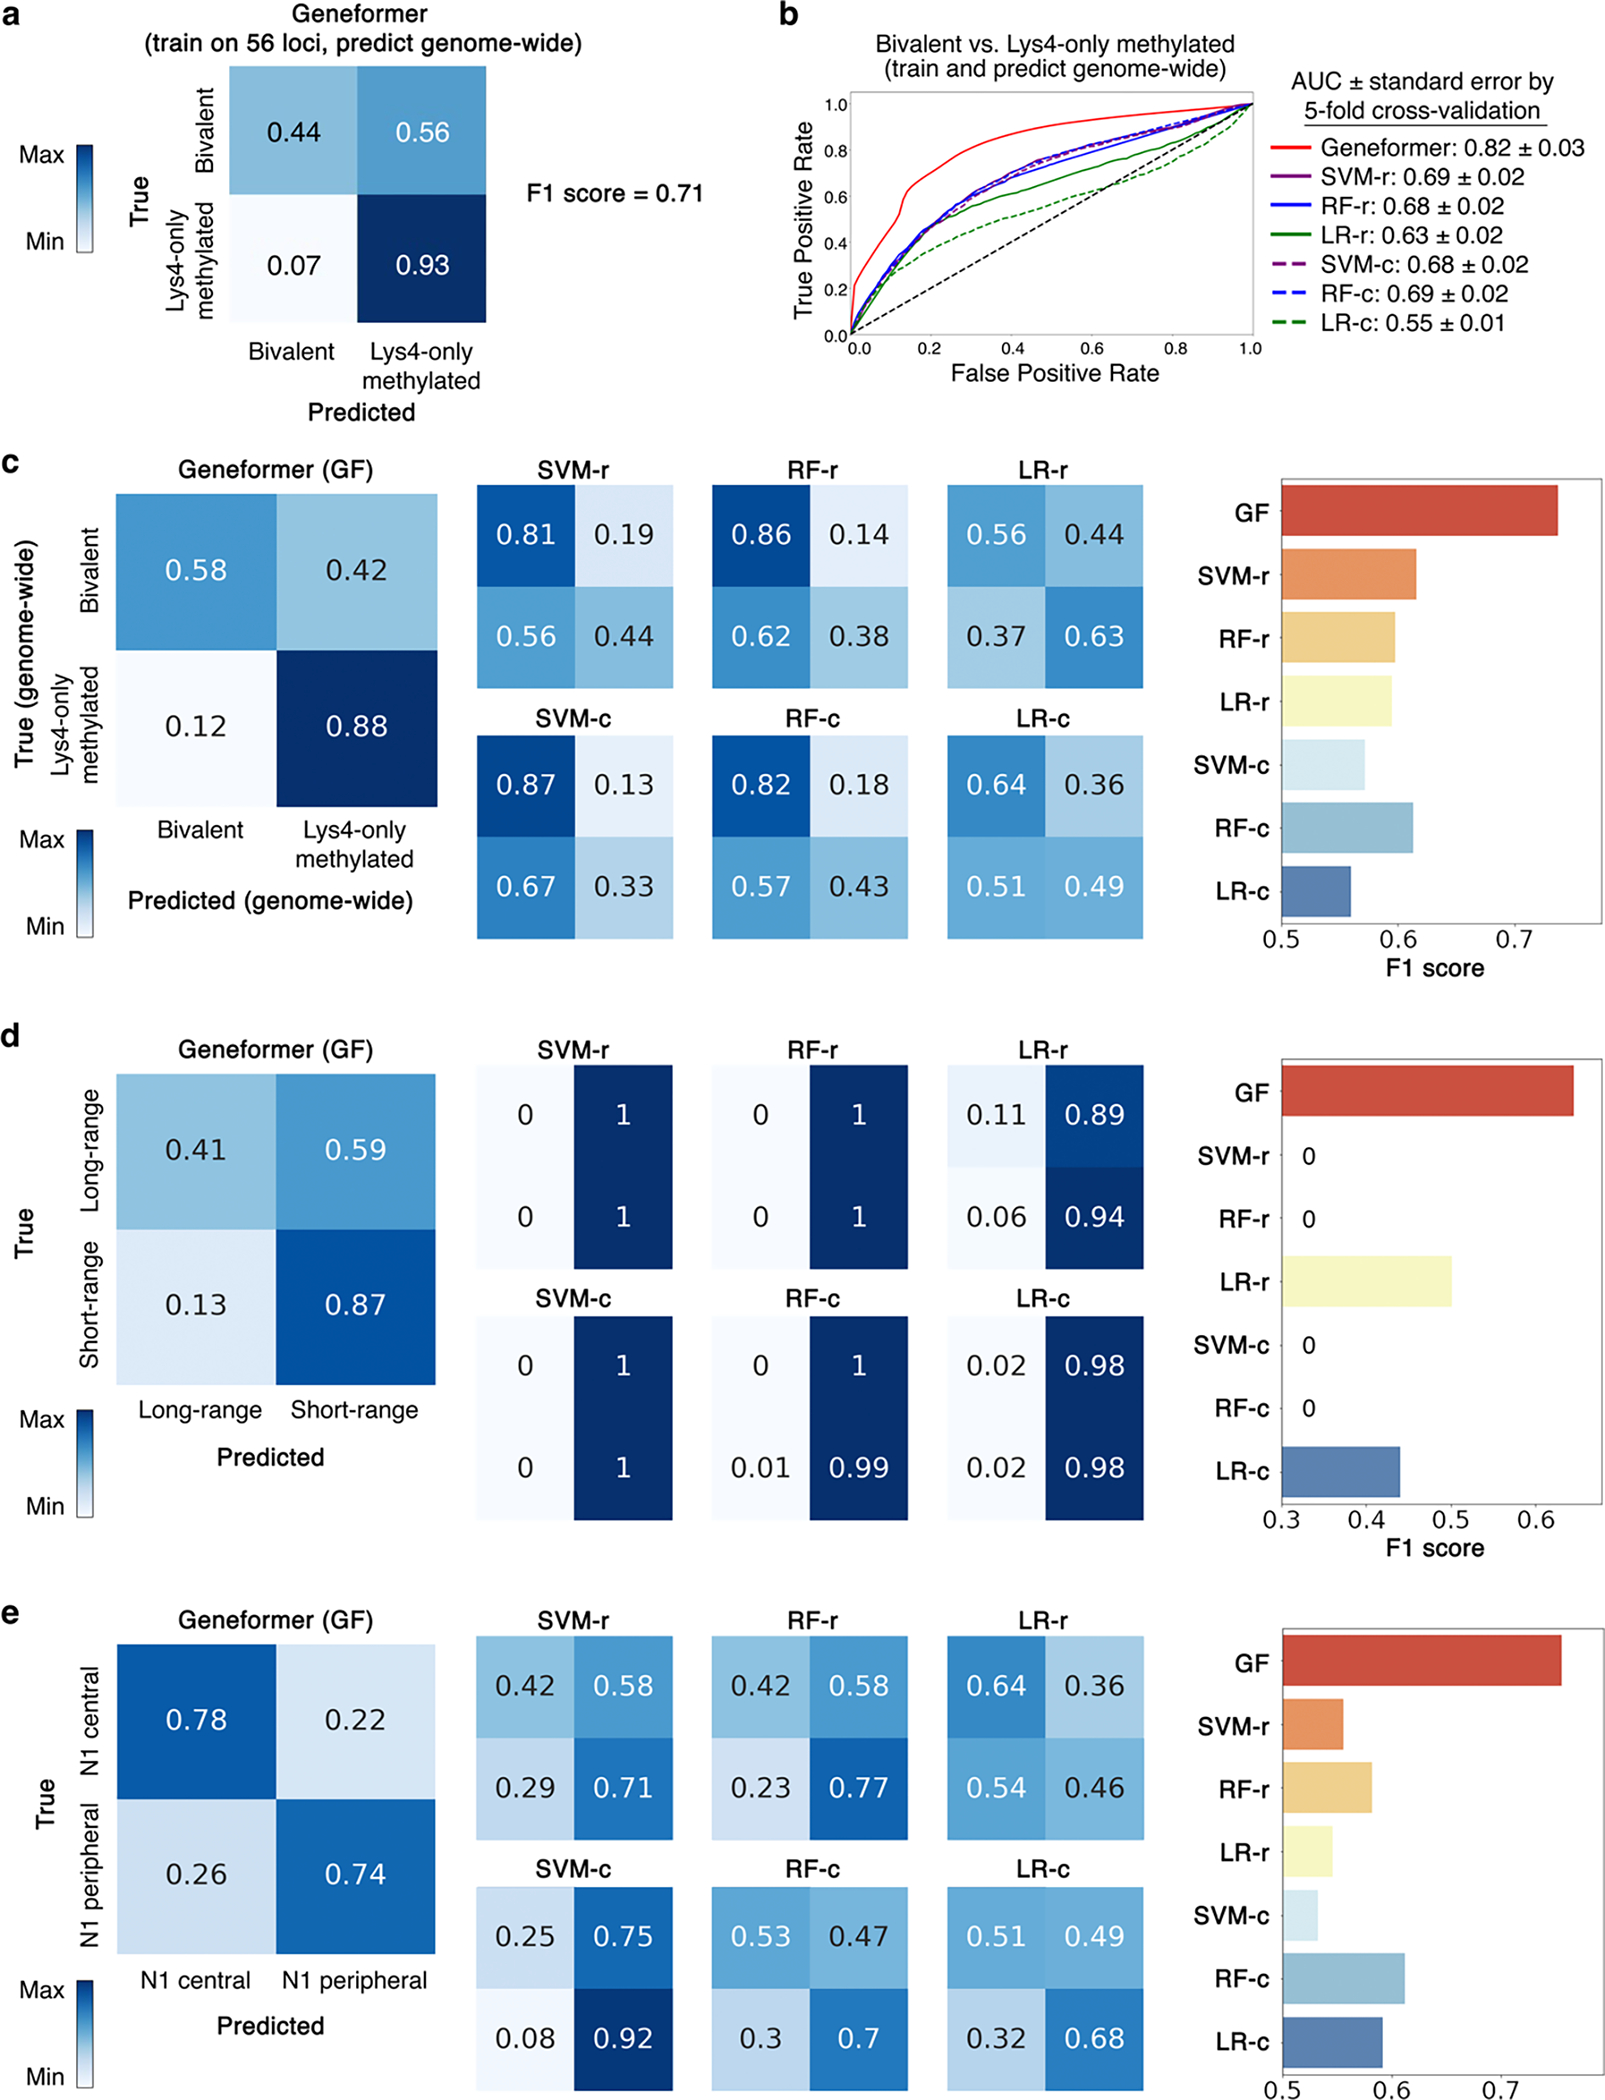
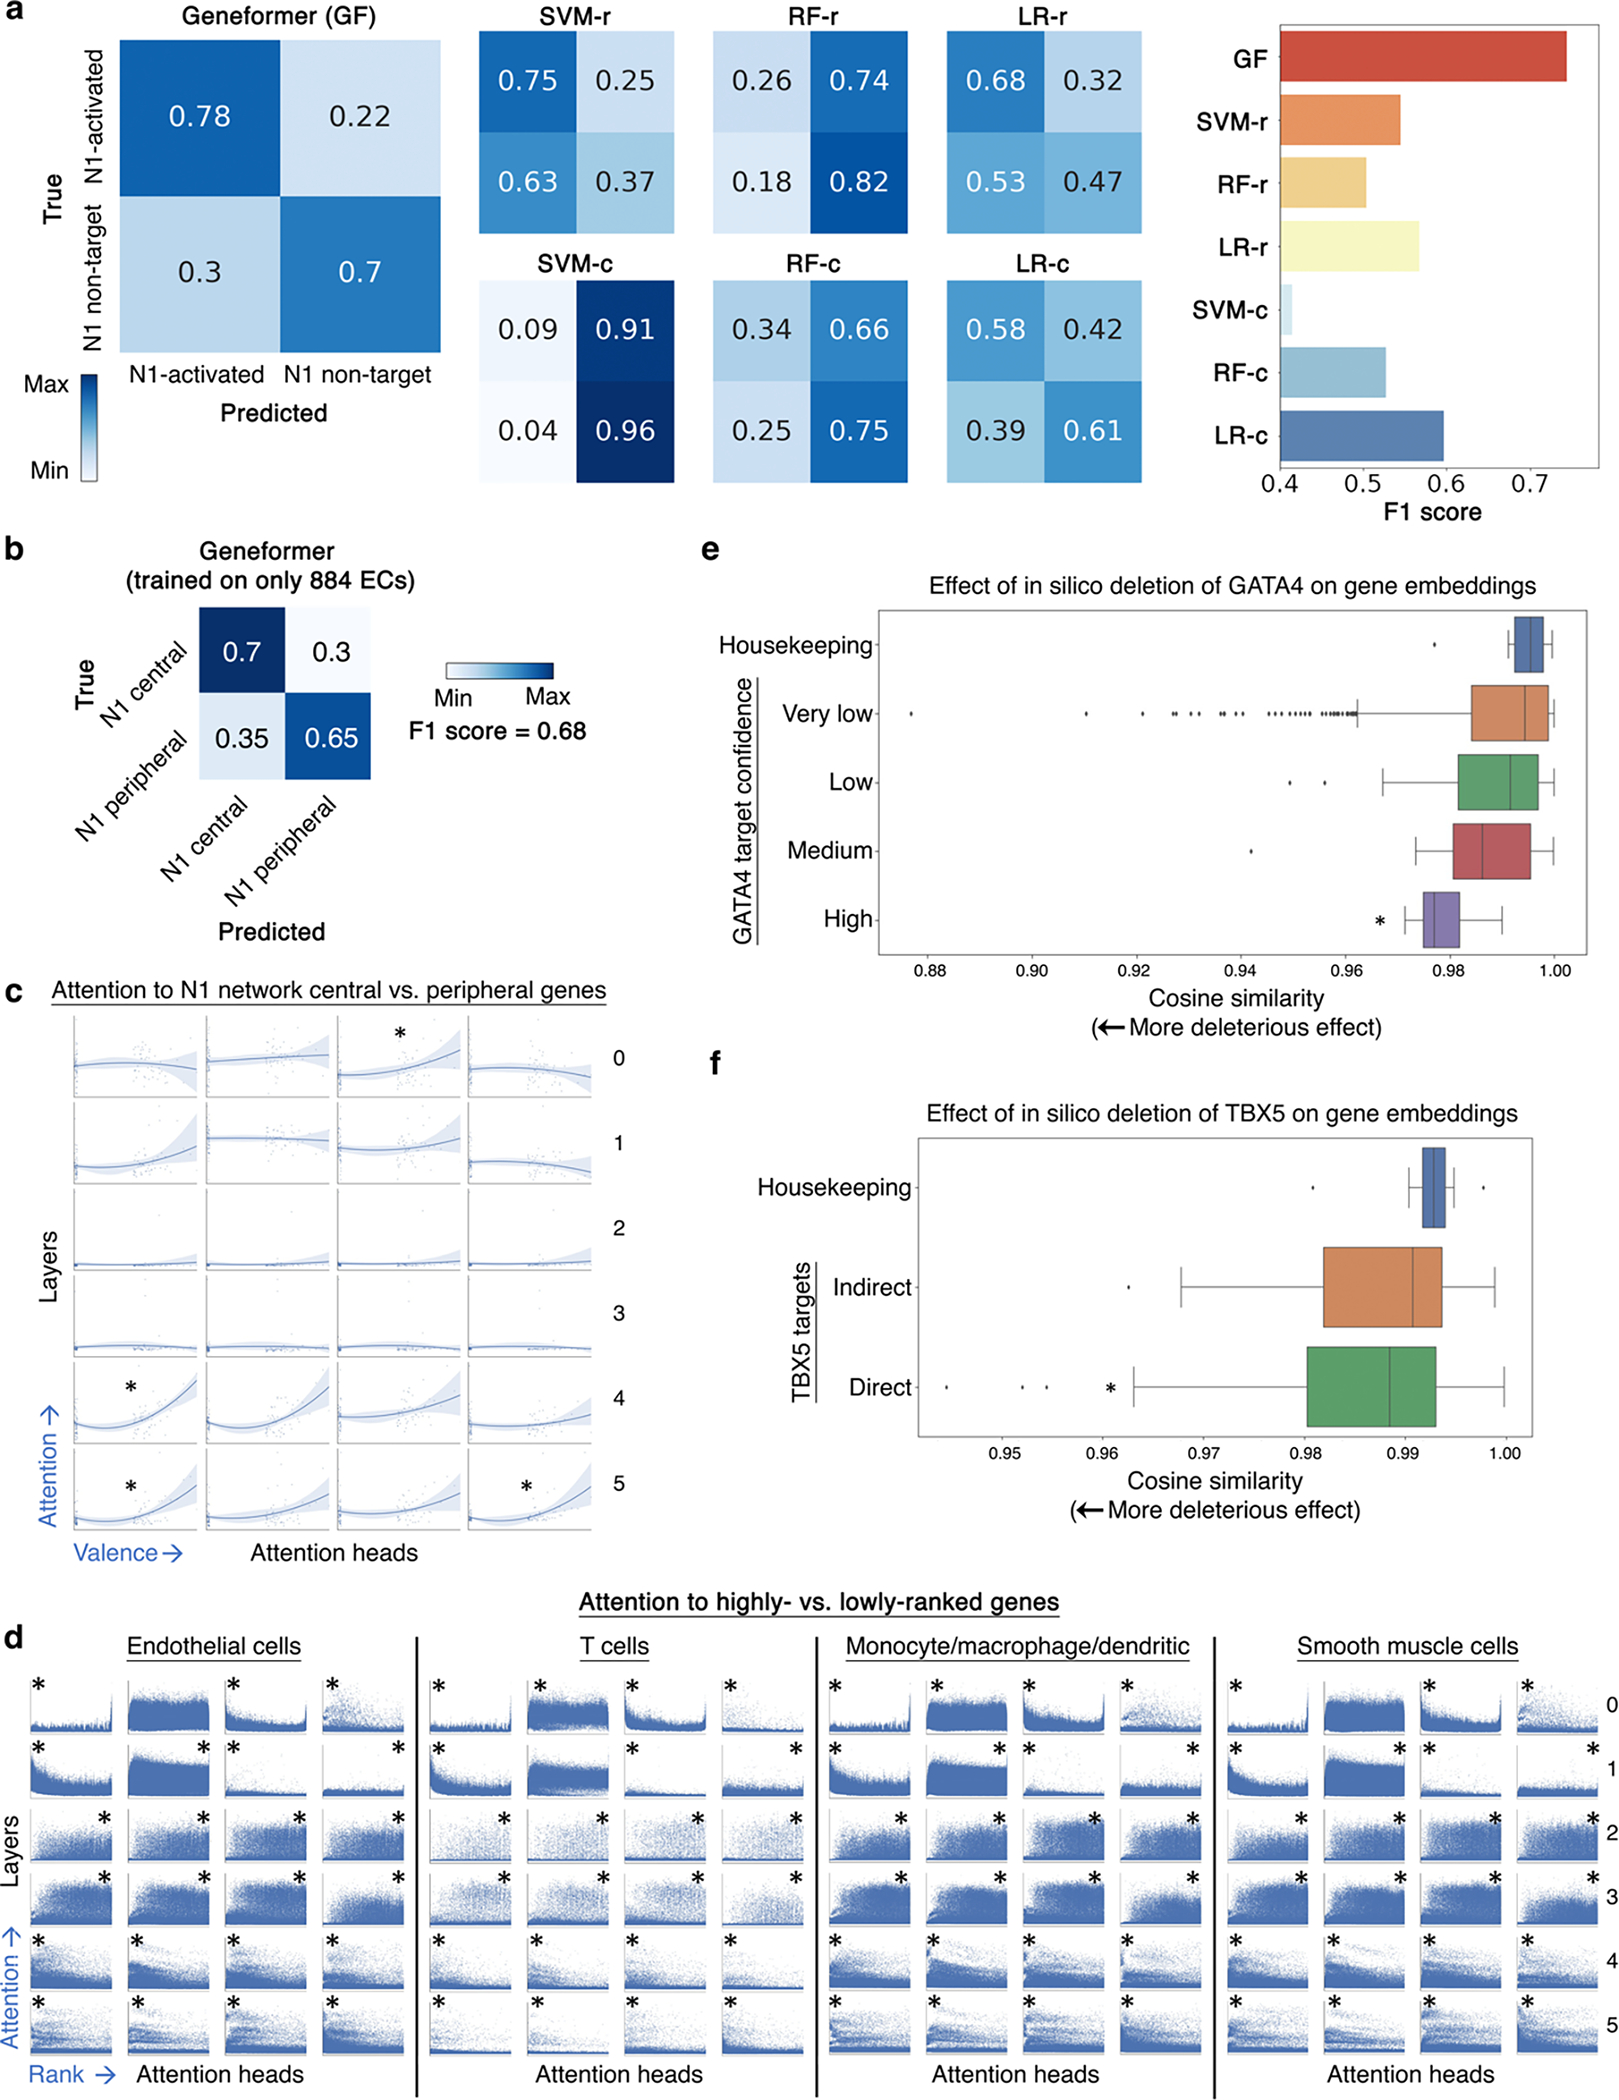
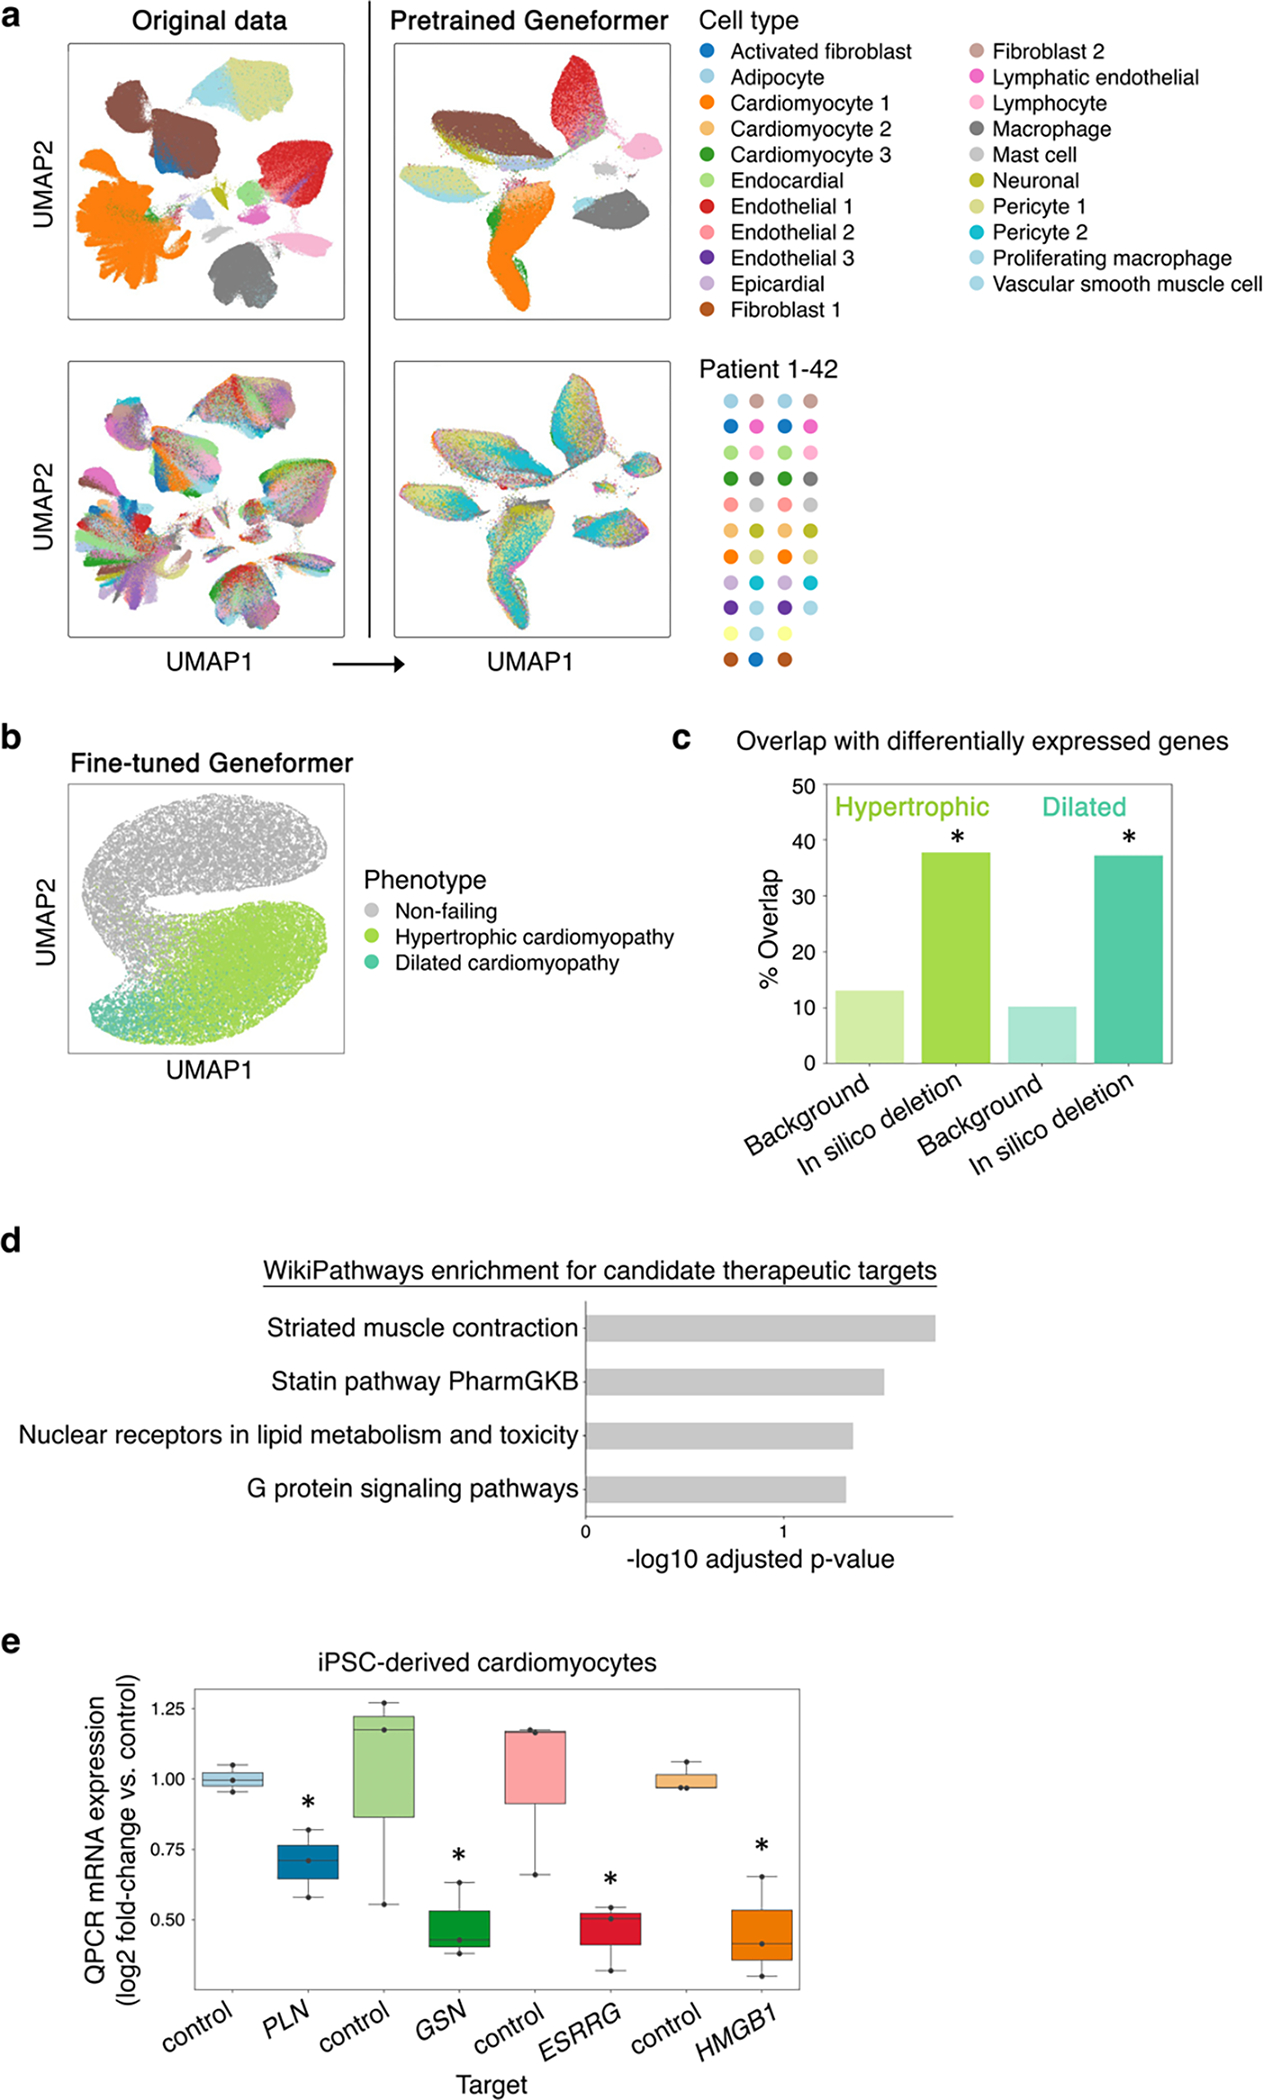
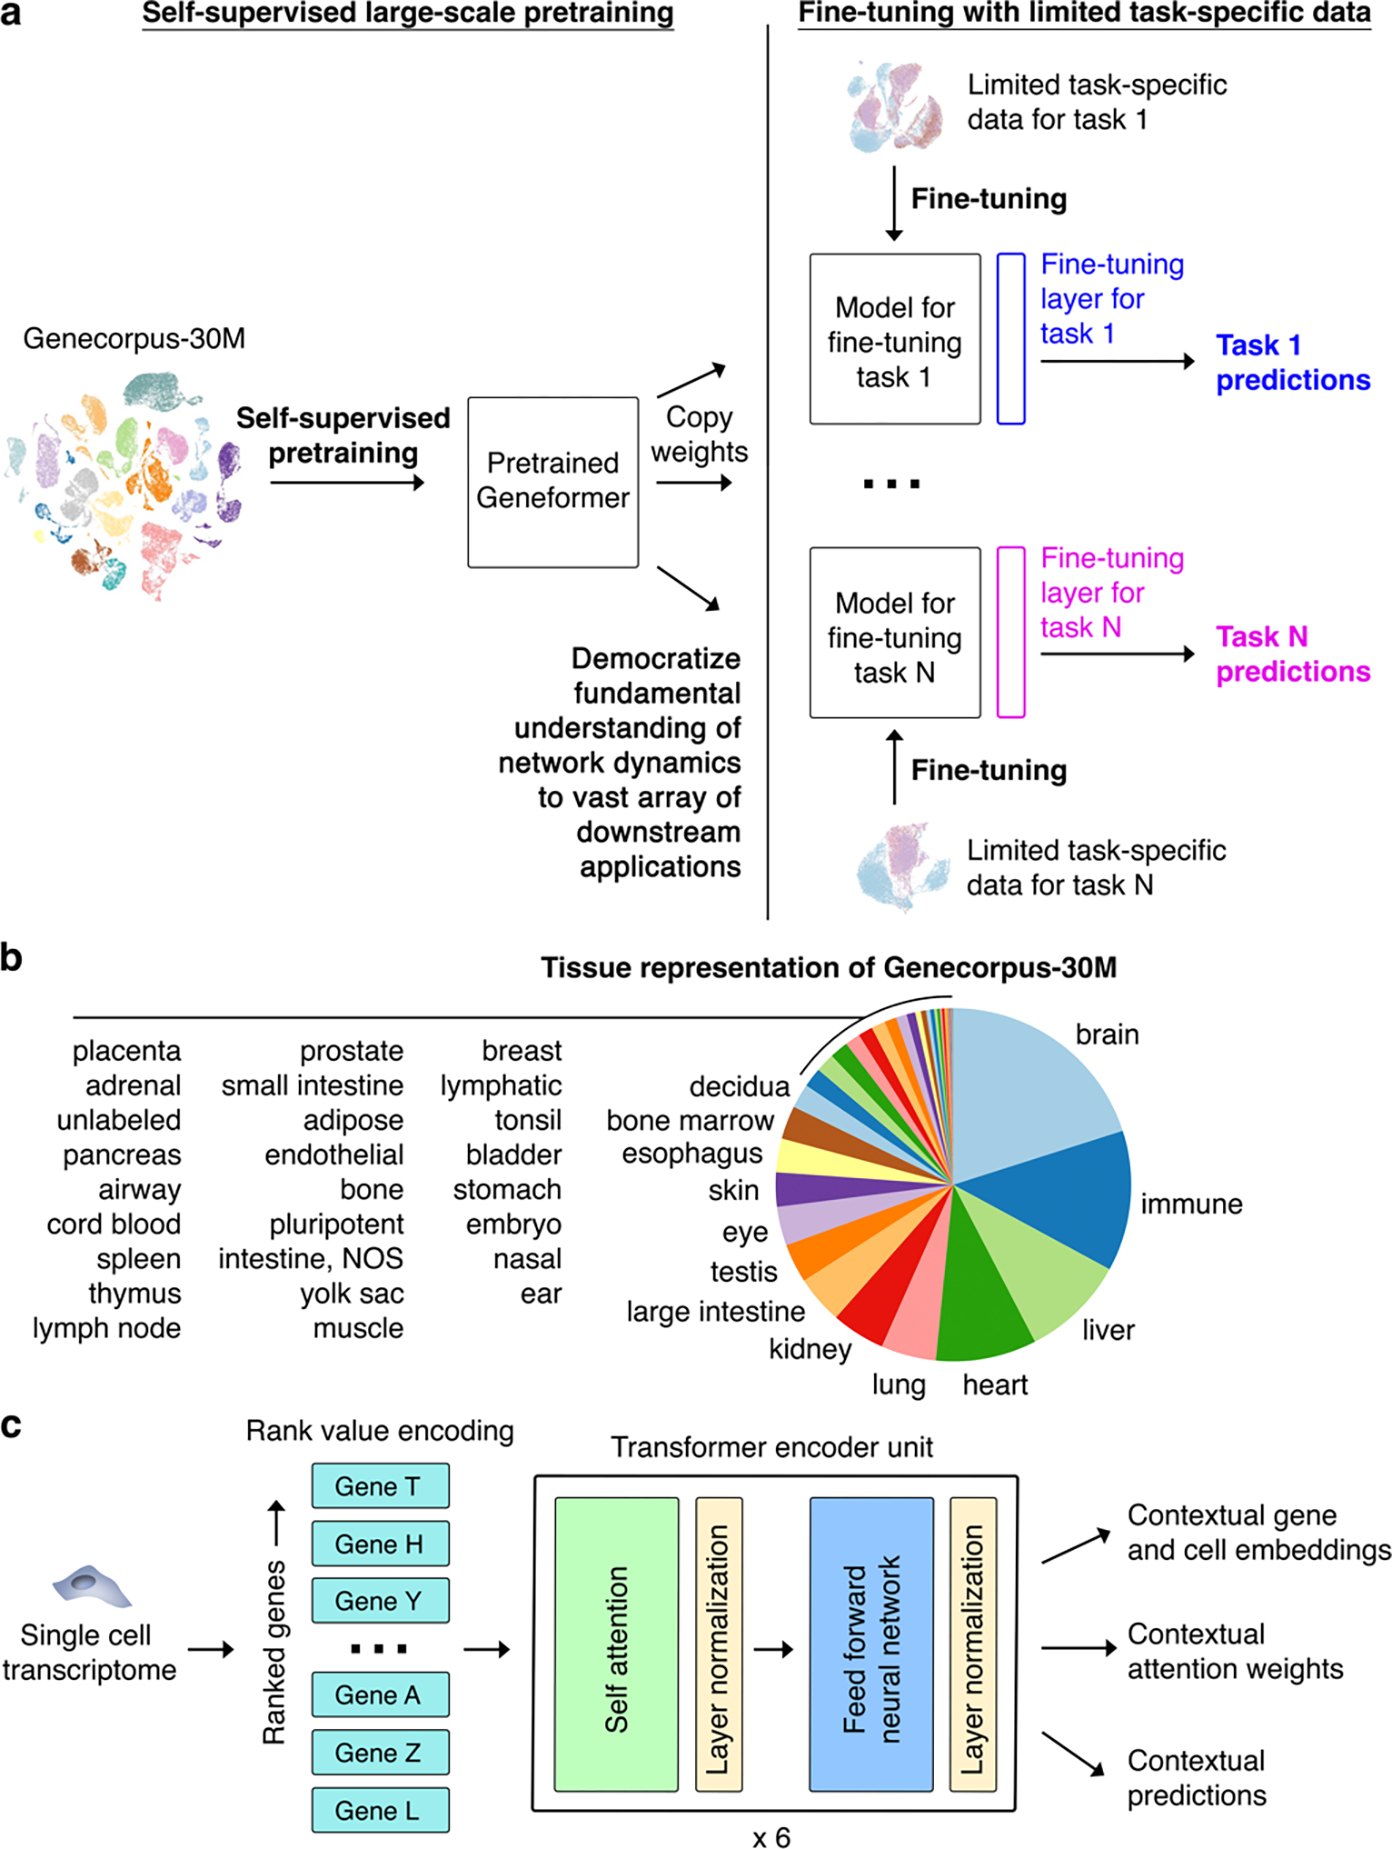
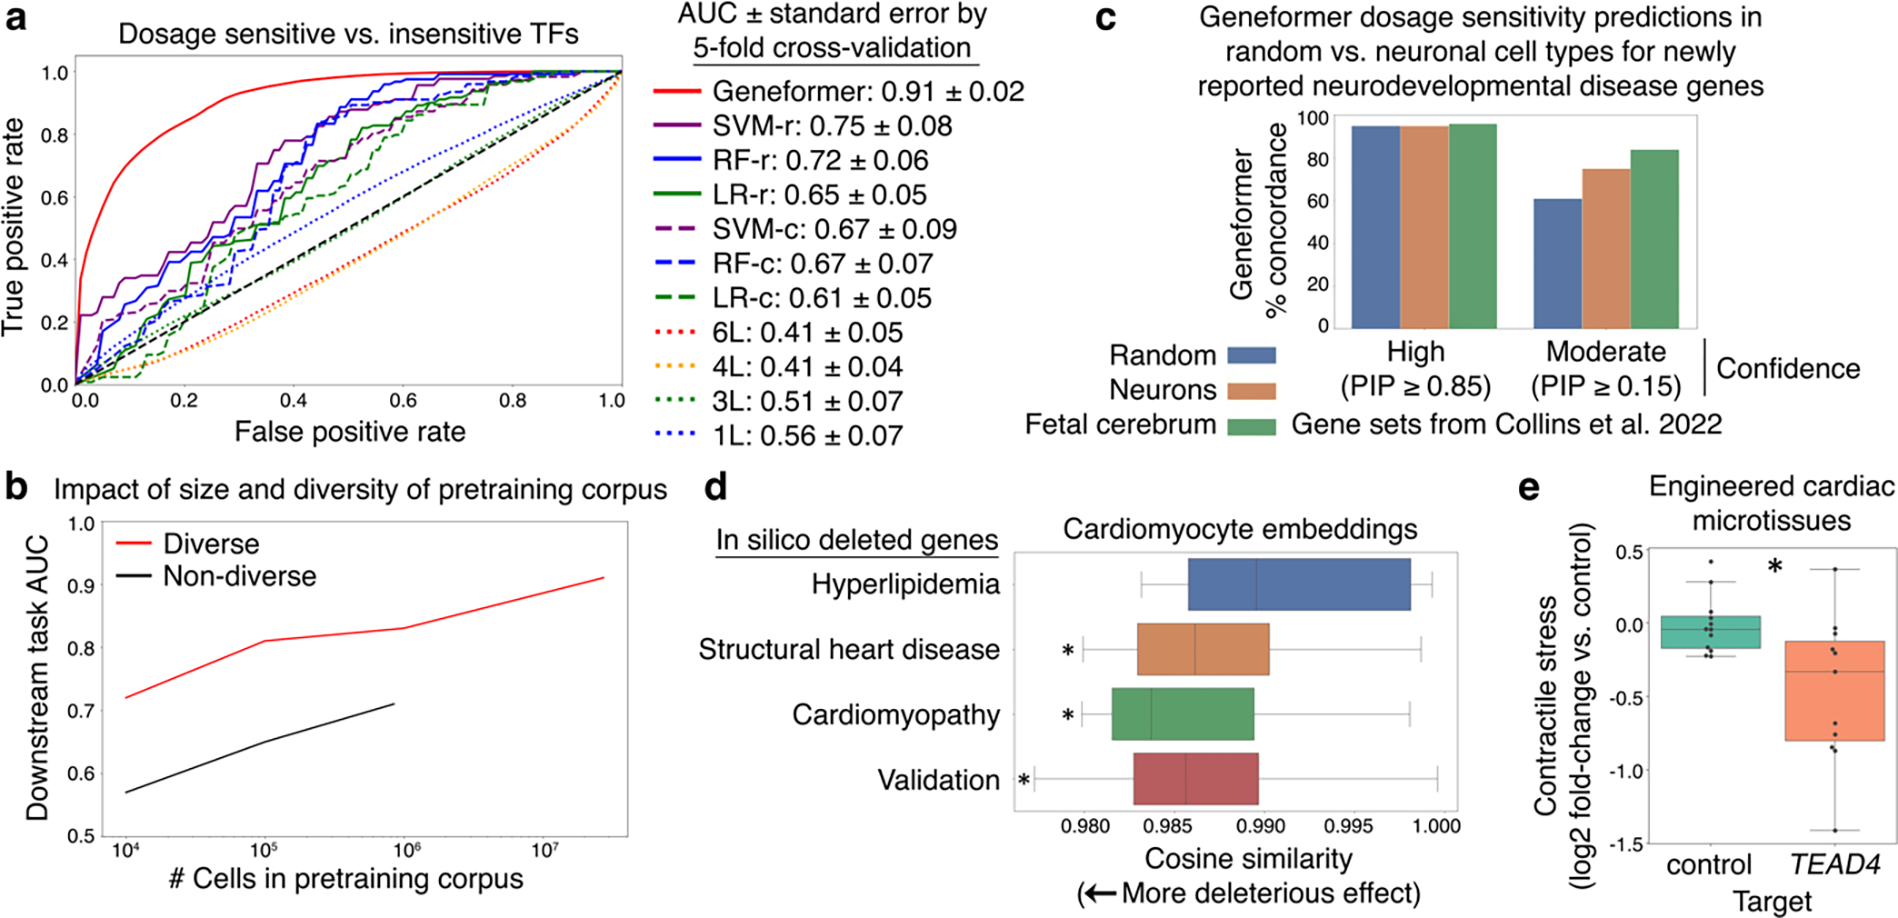
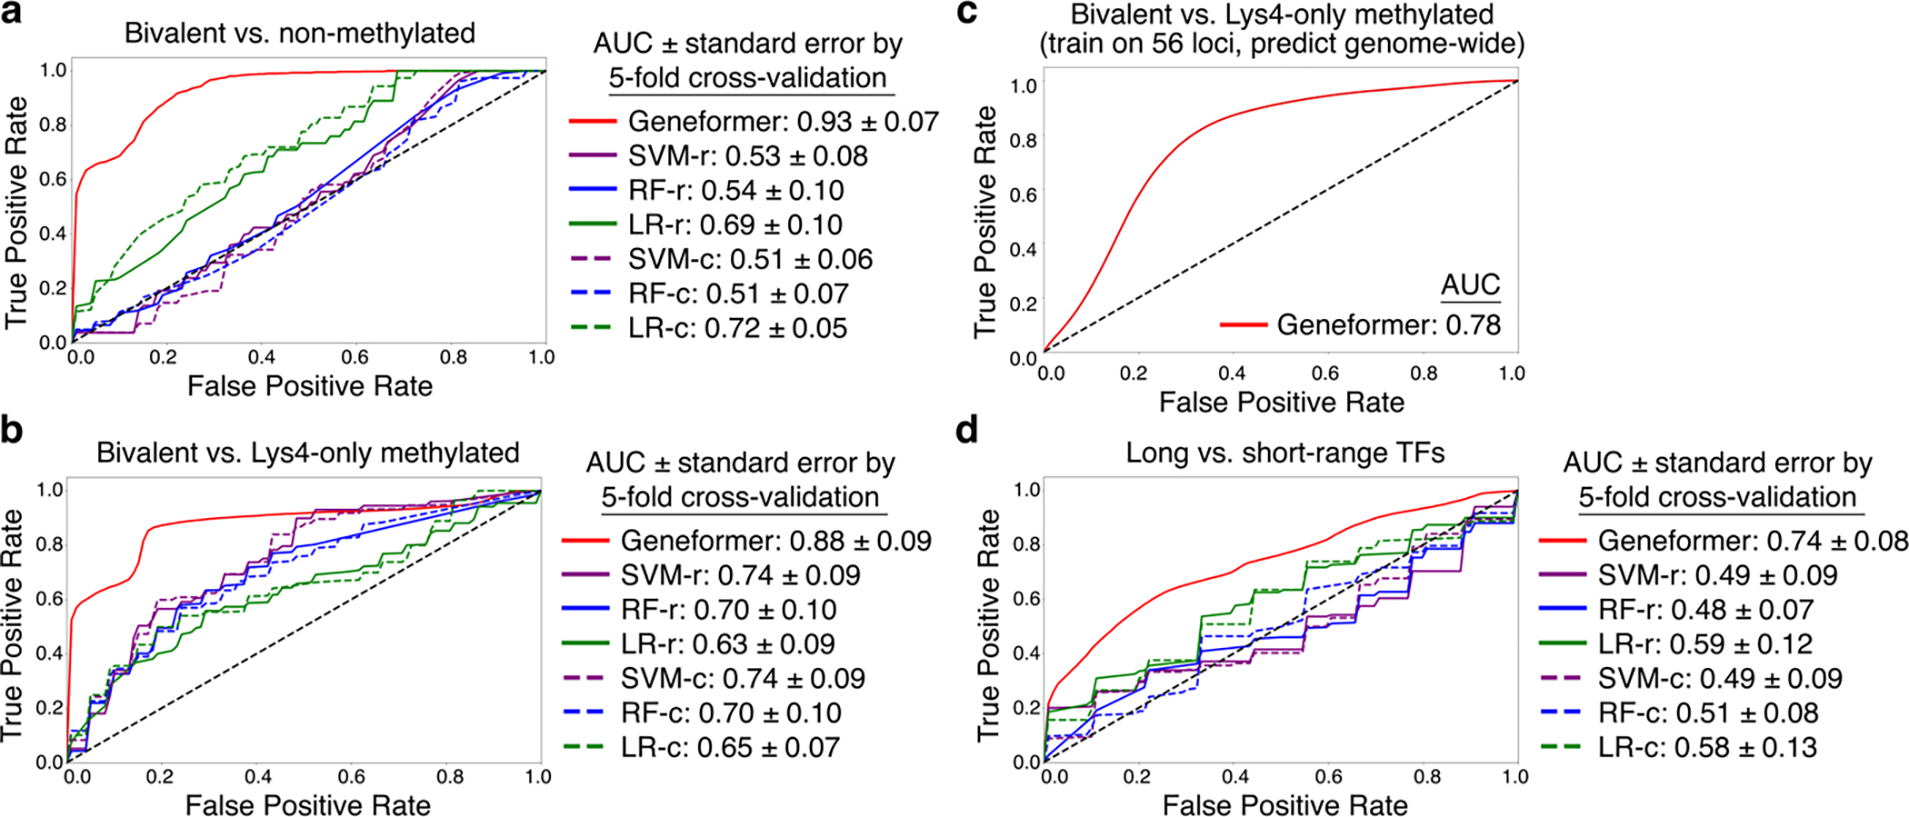
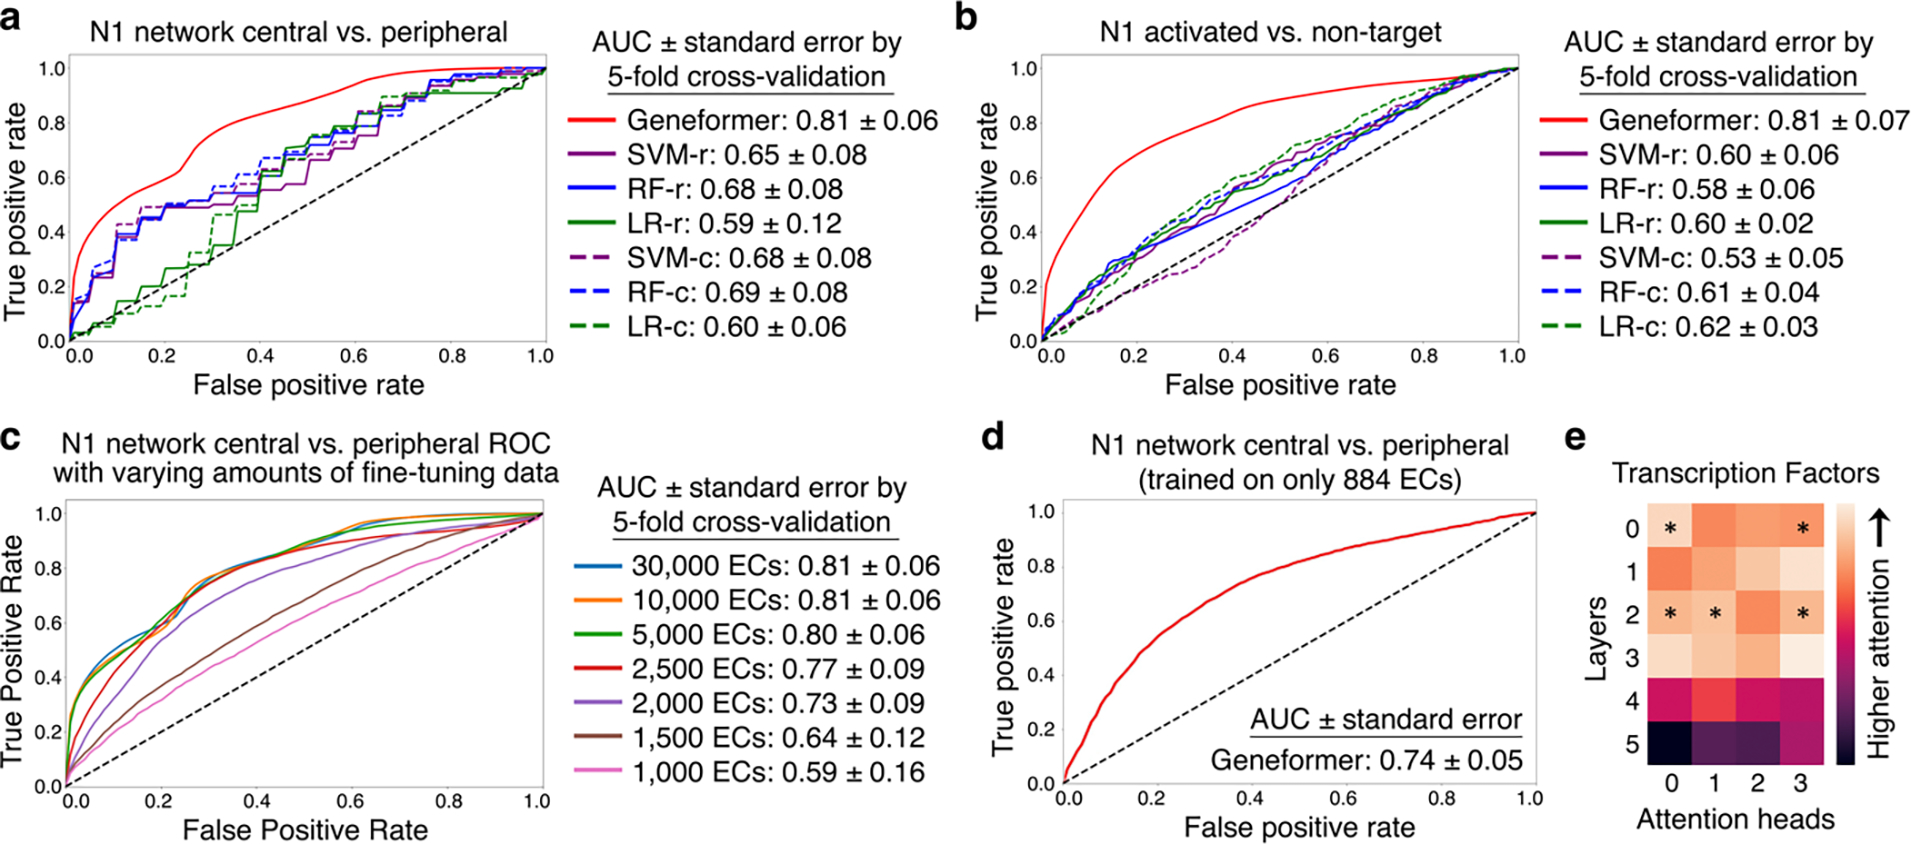
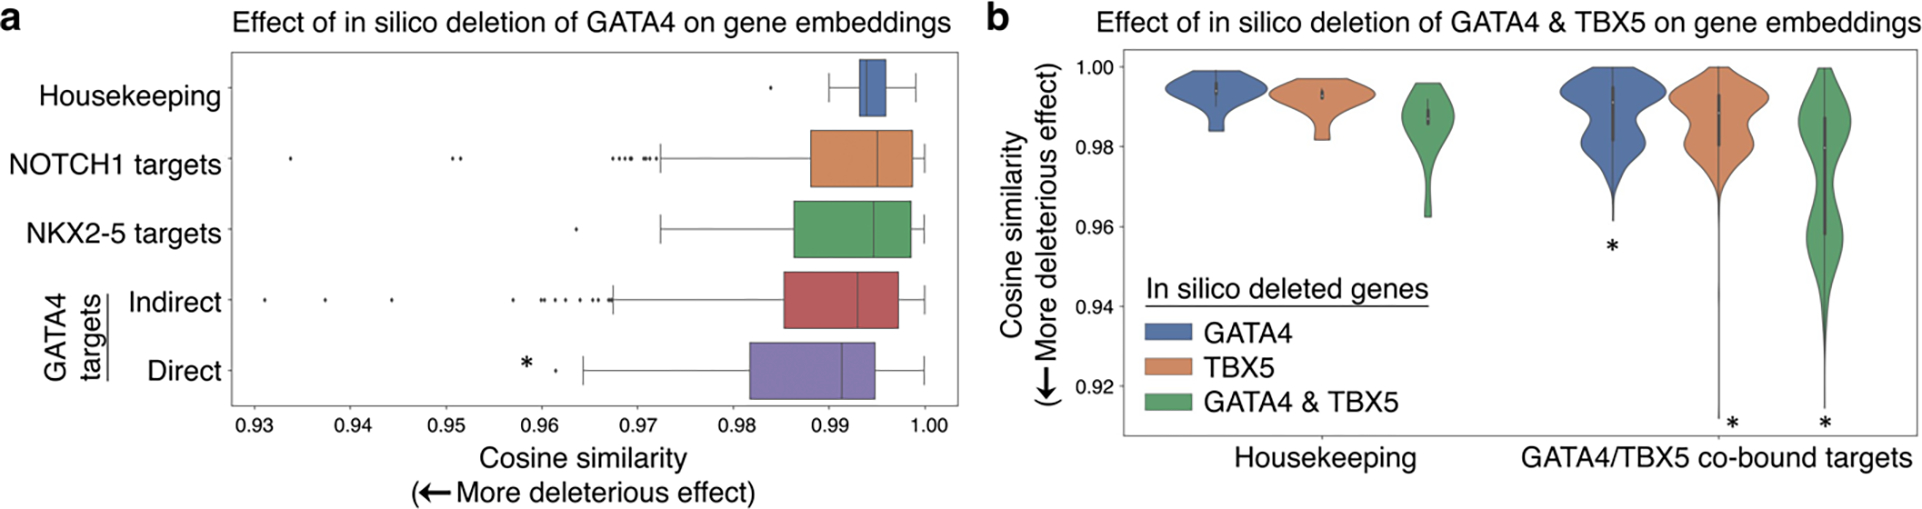
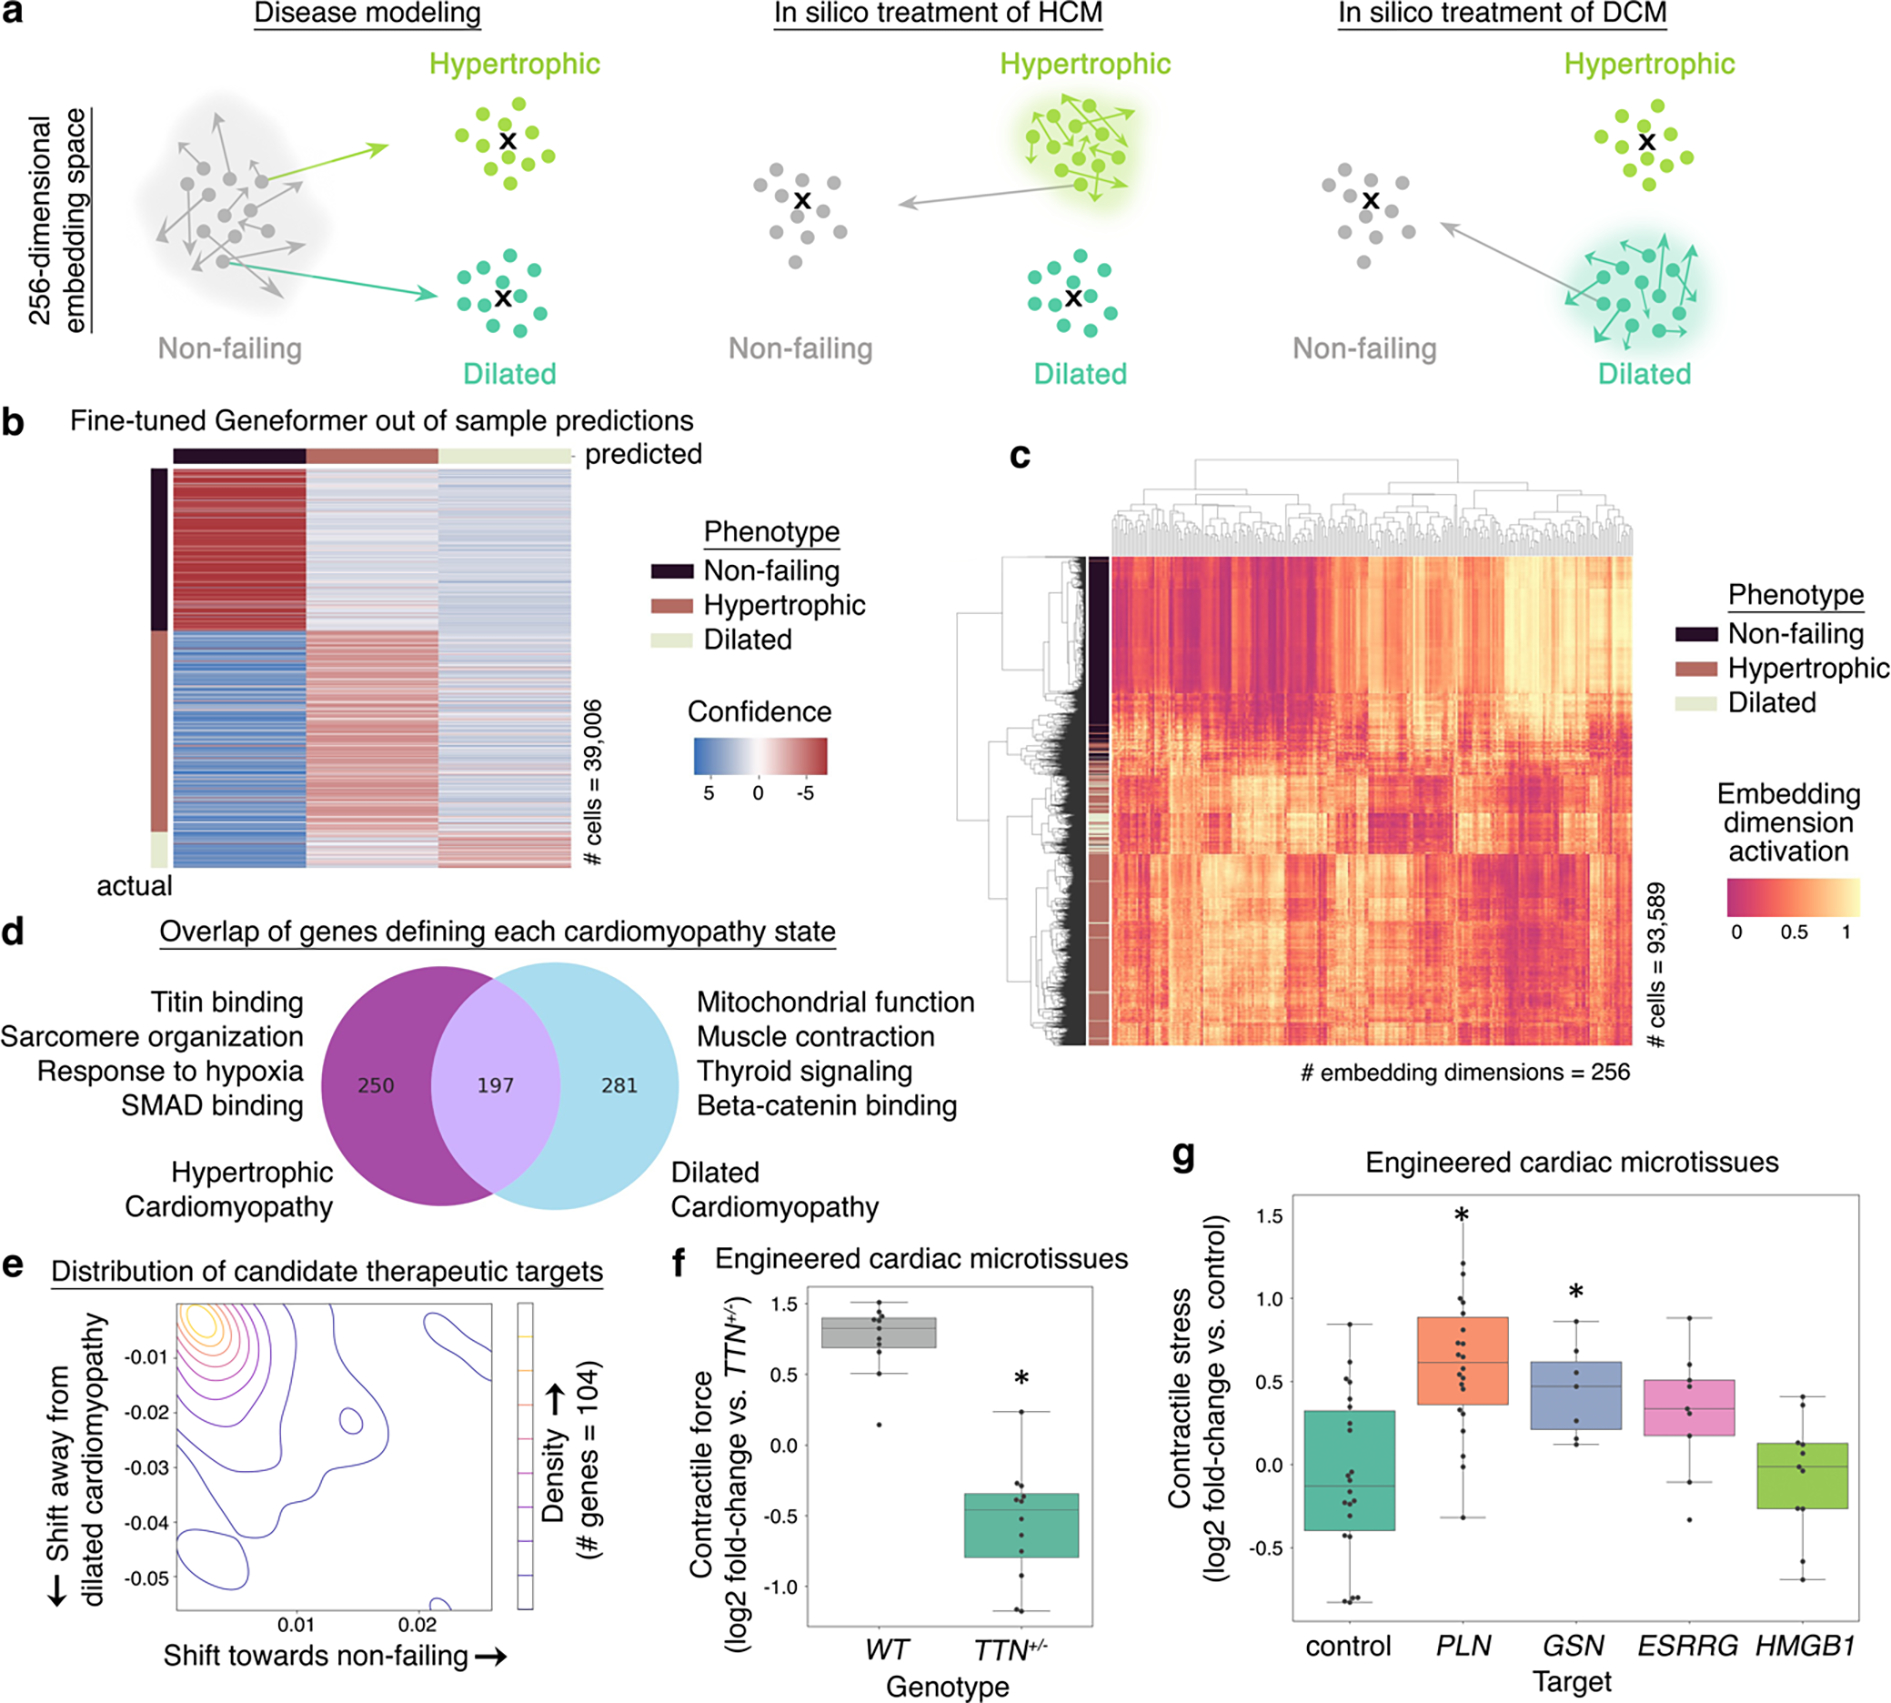
Mapping gene networks requires large amounts of transcriptomic data to learn the connections between genes, which impedes discoveries in settings with limited data, including rare diseases and diseases affecting clinically inaccessible tissues. Recently, transfer learning has revolutionized fields such as natural language understanding1,2 and computer vision3 by leveraging deep learning models pretrained on large-scale general datasets that can then be fine-tuned towards a vast array of downstream tasks with limited task-specific data. Here, we developed a context-aware, attention-based deep learning model, Geneformer, pretrained on a large-scale corpus of about 30 million single-cell transcriptomes to enable context-specific predictions in settings with limited data in network biology. During pretraining, Geneformer gained a fundamental understanding of network dynamics, encoding network hierarchy in the attention weights of the model in a completely self-supervised manner. Fine-tuning towards a diverse panel of downstream tasks relevant to chromatin and network dynamics using limited task-specific data demonstrated that Geneformer consistently boosted predictive accuracy. Applied to disease modelling with limited patient data, Geneformer identified candidate therapeutic targets for cardiomyopathy. Overall, Geneformer represents a pretrained deep learning model from which fine-tuning towards a broad range of downstream applications can be pursued to accelerate discovery of key network regulators and candidate therapeutic targets.


Conflict of interest statement

Competing Interests

XSL conducted this work while on faculty at Dana-Farber Cancer Institute and is currently a board member and CEO of GV20 Oncotherapy. PTE has received sponsored research support from Bayer AG, IBM Research, Bristol Myers Squibb, and Pfizer. PTE has also served on advisory boards or consulted for Bayer AG, MyoKardia, and Novartis. AC is an employee of Bayer US LLC (a subsidiary of Bayer AG) and may own stock in Bayer AG. EMB was a full-time employee of Bayer when this work was performed.

Figures

Extended Data Fig. 1 |
Extended Data Fig. 1 |. Geneformer transfer learning strategy.
a, Schematic of standard modelling approach, which necessitates retraining a new model from scratch for each new task. b, Schematic of transfer learning strategy. Through a single initial self-supervised large-scale pretraining on a generalizable learning objective, the model gains fundamental knowledge of the learning domain that is then democratized to a multitude of downstream applications distinct from the pretraining learning objective, transferring knowledge to new tasks. c, Transcription factors are normalized by a statistically significantly lower factor (resulting in higher prioritization in the rank value encoding) compared to all genes. Housekeeping genes on average show a trend of a higher normalization factor (resulting in deprioritization in the rank value encoding) compared to all genes (*p<0.05 by Wilcoxon, FDR-corrected; all genes n=17,903, housekeeping genes n=11, transcription factors n=1,384; error bars=standard deviation). d, Pretraining was performed with a randomly subsampled corpus of 100,000 cells, holding out 10,000 cells for evaluation, with 3 different random seeds. Evaluation loss was essentially equivalent in the 3 trials, indicating robustness to the set of genes randomly masked for each cell during the pretraining. e, Pretraining was performed with a randomly subsampled corpus of 100,000 cells, holding out 10,000 cells for evaluation, with 3 different masking percentages. 15% masking had marginally lower evaluation loss compared to 5% or 30% masking. f, Pretraining was performed with a randomly subsampled corpus of 90,000 cells and the model was then fine-tuned to distinguish dosage-sensitive vs. -insensitive transcription factors using 10,000 cells that were either included in or excluded from the 90,000 cell pretraining corpus. Predictive potential on the downstream fine-tuning task was measured by 5-fold cross-validation with these 10,000 cells, demonstrating essentially equivalent results by AUC, confusion matrices, and F1 score. Because the fine-tuning applications are trained on classification objectives that are completely separate from the masked learning objective, whether or not task-specific data was included in the pretraining corpus is not relevant to the downstream classification predictions.
Extended Data Fig. 2 |
Extended Data Fig. 2 |. Geneformer was context-aware and robust to batch-dependent technical artifacts.
a, Effect of gene versus the indicated batch-dependent technical artifact on pretrained Geneformer gene embeddings (*p<0.05 by Wilcoxon, FDR-corrected; NS: non-significant). We found that the gene embeddings were robust to sequencing platformM, preservation method,, and individual patient variability. b, UMAP of pretrained Geneformer cell embeddings of cells undergoing iPSC reprogramming appropriately captured temporal trajectory of reprogramming (cell types as annotated by original study; iPSC negative or positive refers to expression of marker TRA-1–60). Cell embeddings suggested that cells which do not progress to the iPSC state bifurcate into an alternative fate compared to cells that progress to the iPSC state after the day 12 stage. c, Compared to in silico reprogramming with random genes, in silico reprogramming of fibroblasts by artificially adding OCT4, SOX2, KLF4, and MYC (OSKM) to the front of their rank value encodings significantly shifted the gene embeddings from their initial fibroblast state to the embedding of that gene in the iPSC state (*p<0.05 by Wilcoxon). d, UMAP of pretrained Geneformer cell embeddings of cells undergoing iPSC to myoblast differentiation at the earlier S1 (PAX3+) and later S2B (PAX3+/MYOD+) stages (cell types as annotated by original study). e, Compared to in silico differentiation with random genes, in silico differentiation of the early-stage myogenic cells by artificially adding MYOD to the front of their rank value encodings significantly shifted the gene embeddings from their earlier state to the embedding of that gene in the later MYOD+ myogenic state (*p<0.05 by Wilcoxon).
Extended Data Fig. 3 |
Extended Data Fig. 3 |. Geneformer encoded context-specificity of key NOTCH pathway genes.
Known context-dependent NOTCH genes showed higher variance in their contextual embeddings across variable aortic cell types compared to housekeeping gene GAPDH.
Extended Data Fig. 4 |
Extended Data Fig. 4 |. Geneformer pretrained and fine-tuned cell embeddings were robust to batch-dependent technical artifacts.
a, While original data (left) was highly affected by patient batch effect, cell embeddings generated by pretrained Geneformer (right) (without fine-tuning) clustered primarily by cell type and phenotype. Of note, affected individuals 1, 2, and 4 had the phenotype of ascending only aortic aneurysm, which is a different phenotype than aortic aneurysm that includes the root. b, Imbalance in the number of genes detected in each of the two platforms (single-cell Drop-seq versus single-nucleus DroNc-seq), which may result in batch-dependent technical artifacts. c, Cell embeddings from each layer of the Geneformer model fine-tuned to distinguish the indicated cell types (as annotated by original study) using only the Drop-seq data. As the cells pass through each layer, the model successively extrudes them from each other to derive separable embeddings that distinguish the cell types. d, Cell type predictions on the DroNc-seq data by the model fine-tuned only on the Drop-seq data (out of sample accuracy 84%). Of note, inaccurate predictions were predominantly in predicting that cardiomyocyte type 2 was type 1, as expected given the minimal examples of cardiomyocyte type 2 in the Drop-seq data. e, The imbalance of cardiomyocyte type 1 and 2 between the platforms also suggests that these cellular subtypes may be an artifact of variable gene detection between the two platforms. f, Geneformer fine-tuned with only Drop-seq data automatically integrated DroNc-seq data such that the fine-tuned Geneformer cell embeddings primarily clustered by cell types and showed improved integration of platforms compared to the original data even after batch effect removal using the ComBat or Harmony methods.
Extended Data Fig. 5 |
Extended Data Fig. 5 |. Geneformer boosted predictions in multiclass cell type annotation.
a, Predictive potential (as measured by accuracy and macro F1 score) of Geneformer fine-tuned for cell type annotation in the indicated human tissues as compared to XGBoost (CaSTLe) and deep neural network-based (scDeepSort) methods. The top bar graph indicates the number of cell type classes for each tissue; the gap in performance of Geneformer compared to alternatives increased as the number of cell type classes increased, indicating that Geneformer was robust in even increasingly complex multiclass prediction applications. b, Lung, c, large intestine, or d, pancreas out of sample predictions by Geneformer fine-tuned to distinguish cell types in each tissue (training on 80% of cells, predictions on held-out 20% of cells).
Extended Data Fig. 6 |
Extended Data Fig. 6 |. Embedding dimension activations distinguish cell types in fine-tuned Geneformer model.
a, Kidney, b, liver, c, blood, d, spleen, e, brain, or f, placenta out of sample predictions by Geneformer fine-tuned to distinguish cell types in each tissue (training on 80% of cells, predictions on held-out 20% of cells). g, Specific embedding dimension activations distinguish each lung cell type in the fine-tuned model.
Extended Data Fig. 7 |
Extended Data Fig. 7 |. Geneformer boosted predictions in a diverse panel of downstream tasks.
a, Confusion matrices and F1 score for Geneformer predictions vs. alternative methods (as described in Fig. 2a) for downstream task of distinguishing dosage-sensitive vs. insensitive transcription factors. b, Effect on cardiomyocyte embeddings from in silico deletion of genes linked by prior transcriptome-wide association study (TWAS)-prioritized GWAS to cardiac MRI traits relevant to cardiac pathology (left ventricular (LV) end diastolic volume (EDV), LV end systolic volume (LVESV), LV ejection fraction (LVEF), and stroke volume (SV)) compared to in silico deletion of control cardiac disease genes expressed in cardiomyocytes but whose pathology occurs in non-cardiomyocyte cell types (hyperlipidemia). (*p<0.05 by Wilcoxon, FDR-corrected; center line=median, box limits=upper and lower quartiles, whiskers=1.5x interquartile range, points=outliers). c, Quantitative PCR (QPCR) data of CRISPR-mediated knockout of TEAD4 in iPSC-derived cardiomyocytes (n=3, *p<0.05 by t-test; center line=median, box limits=upper and lower quartiles, whiskers=1.5x interquartile range, points=experimental replicates). d, Confusion matrices and F1 score for Geneformer predictions vs. alternative methods for downstream task of distinguishing bivalent vs. non-methylated genes (56 highly conserved loci). e, Confusion matrices and F1 score for Geneformer predictions vs. alternative methods for downstream task of distinguishing bivalent vs. Lys4-only methylated genes (56 highly conserved loci).
Extended Data Fig. 8 |
Extended Data Fig. 8 |. Geneformer boosted predictions in a diverse panel of downstream tasks.
a, Confusion matrix and F1 score for Geneformer predictions vs. alternative methods (as described in Fig. 2a) for downstream task of distinguishing genome-wide bivalent vs. Lys4-only methylated genes with model fine-tuned only on 56 highly conserved loci. b, ROC curve of Geneformer fine-tuned to distinguish genome-wide bivalent vs. Lys4-only-methylated genes using limited data (~15K ESCs), compared to alternative methods. c, Confusion matrices and F1 score for Geneformer predictions vs. alternative methods for downstream task of distinguishing genome-wide bivalent vs. non-methylated genes with model fine-tuned on 80% of genome-wide loci and predicting on 20% of out of sample loci. d, Confusion matrices and F1 score for Geneformer predictions vs. alternative methods for downstream task of distinguishing long- vs. short-range transcription factors. e, Confusion matrices and F1 score for Geneformer predictions vs. alternative methods for downstream task of distinguishing central vs. peripheral genes within the N1-dependent network in endothelial cells.
Extended Data Fig. 9 |
Extended Data Fig. 9 |. In silico deletion strategy revealed network connectivity.
a, Confusion matrices and F1 score for Geneformer predictions vs. alternative methods (as described in Fig. 2a) for downstream task of distinguishing N1-activated vs. non-targets. b, Confusion matrix and F1 score of Geneformer predictions of central vs. peripheral genes within the N1-dependent network in endothelial cells (ECs) with model fine-tuned only on 884 ECs from healthy or dilated aortas. c, Pretrained Geneformer attention weights in aortic ECs demonstrated that specific attention heads learned in a completely self-supervised way the relative centrality of the top most central versus most peripheral genes in the N1-dependent gene network (higher valence=more central) (*p<0.05 Wilcoxon, FDR-corrected). d, Pretrained Geneformer contextual attention versus gene rank in rank value encoding in the indicated aortic cell types, which each have different sets of highest ranked genes based on cell type context (higher rank is leftward on x axis) (*p<0.05 by Wilcoxon, FDR-corrected, * position = side with higher attention). All cells used for analysis had the same number of genes so that the rank values would be comparable. e, In silico deletion of GATA4 was significantly more deleterious to the previously reported highest confidence GATA4 targets than to housekeeping genes. f, In silico deletion of TBX5 was significantly more deleterious to previously reported TBX5 direct targets than to housekeeping genes or TBX5 indirect targets. In (d-e): *p<0.05 by Wilcoxon, FDR-corrected; center line=median, box limits=upper and lower quartiles, whiskers=1.5x interquartile range, points=outliers.
Extended Data Fig. 10 |
Extended Data Fig. 10 |. Geneformer fine-tuned cardiomyocyte embeddings clustered by phenotype.
a, While original data (left) was highly affected by patient batch effect, cell embeddings generated by pretrained Geneformer (right) (without fine-tuning) clustered primarily by cell type. b, UMAP of cardiomyocyte embeddings from the model fine-tuned to distinguish cardiomyocytes in non-failing hearts from cardiomyocytes in patients with hypertrophic or dilated cardiomyopathy. c, Gene sets significantly associated with hypertrophic or dilated cardiomyopathy states by Geneformer in silico deletion disease modeling significantly overlapped with genes differentially expressed in those respective disease states (differentially expressed vs. non-failing) compared to the overlap of those differentially expressed genes with background genes (the remainder of the genes detected in cardiomyocytes that were not significantly associated with hypertrophic or dilated cardiomyopathy by Geneformer disease modeling) (*p<0.05 by X2 test, FDR-corrected). d, Pathway enrichment for genes whose in silico deletion in cardiomyocytes from hypertrophic cardiomyopathy patients significantly shifted embeddings towards the non-failing state and away from the dilated cardiomyopathy state, suggesting candidate therapeutic targets. e, QPCR data of CRISPR-mediated knockout of indicated genes in TTN+/− iPSC-derived cardiomyocytes (n=3, *p<0.05 by t-test). Center line=median, box limits=upper and lower quartiles, whiskers=1.5x interquartile range, points=experimental replicates.
Fig. 1 |
Fig. 1 |. Geneformer architecture and transfer learning strategy.
a, Schematic of transfer learning strategy with initial self-supervised large-scale pretraining, copying pretrained weights to models for each fine-tuning task, adding fine-tuning layer, and fine-tuning with limited task-specific data towards each downstream task. Through the single initial self-supervised large-scale pretraining on a generalizable learning objective, the model gains fundamental knowledge of the learning domain that is then democratized to a multitude of downstream applications distinct from the pretraining learning objective, transferring knowledge to new tasks. b, Tissue representation of Genecorpus-30M. NOS=not otherwise specified. c, Pretrained Geneformer architecture. Each single cell transcriptome is encoded into a rank value encoding that then proceeds through 6 layers of transformer encoder units with parameters: input size of 2048 (fully represents 93% of rank value encodings in Geneformer-30M), 256 embedding dimensions, 4 attention heads per layer, and feed forward size of 512. Geneformer employs full dense self-attention across the input size of 2048. Extractable outputs include contextual gene and cell embeddings, contextual attention weights, and contextual predictions.
Fig. 2 |
Fig. 2 |. Geneformer boosted predictions of gene dosage sensitivity with limited data.
a, ROC curve of Geneformer fine-tuned to distinguish dosage-sensitive versus -insensitive transcription factors (TFs) using limited data (10,000 cells) compared to alternative methods: support vector machine (SVM), random forest (RF), or logistic regression (LR) trained on gene ranks (-r) or counts (-c) or non-pretrained attention-based models with the same architecture as Geneformer (6 layers (L)) or shallower (4, 3, or 1L) with retained depth-to-width aspect ratios. b, Larger and more diverse pretraining corpuses improved predictive potential in downstream task of distinguishing dosage-sensitive versus -insensitive TFs using the same limited task-specific data (10,000 cells). Diverse corpuses were randomly sampled from Genecorpus-30M, whereas non-diverse corpuses were randomly sampled from an esophageal dataset. c, Fine-tuned Geneformer’s contextual dosage sensitivity predictions in (i) random cell types, (ii) neurons (including adult), and (iii) fetal cerebrum for neurodevelopmental disease genes newly reported by Collins et al. 2022. Authors reported either high or moderate confidence gene sets with the indicated posterior inclusion probability (PIP) scores. d, In silico deletion of genes associated with disease driven by cardiomyocyte pathology (cardiomyopathy and structural heart disease) had a more deleterious effect on cardiomyocyte embeddings compared to control cardiac disease genes expressed in cardiomyocytes but whose pathology occurs in non-cardiomyocyte cell types (hyperlipidemia). Validation with experimental data from patients with cardiomyopathy (see Fig. 6) demonstrated that in silico deletion of genes distinguishing the cardiomyopathy state was also predicted to be more deleterious than in silico deletion of control genes. (*p<0.05 Wilcoxon, FDR-corrected; points=outliers). e, Contractile stress (force per unit area) of cardiac microtissues derived from WT iPSCs, exposed to either control treatment or guides promoting CRISPR-mediated knockout of Geneformer-predicted dosage-sensitive gene TEAD4. (control n=12, TEAD4 n=11; p<0.05 Wilcoxon; points=replicates). In (d-e): center line=median, box limits=upper and lower quartiles, whiskers=1.5x interquartile range.
Fig. 3 |
Fig. 3 |. Geneformer boosted predictions of chromatin dynamics with limited data.
a-b, ROC curve of Geneformer fine-tuned to distinguish bivalent vs. (a) non-methylated or (b) Lys4-only-methylated genes in 56 conserved loci from Bernstein et al. Cell 2006 using limited data (~15K ESCs), compared to alternative methods. c, ROC curve of Geneformer’s genome-wide predictions of bivalent vs. Lys4-only-methylated genes after fine-tuning on only 56 loci as in (b). d, ROC curve of Geneformer fine-tuned to distinguish long- vs. short-range TFs using limited data (~38K cells from iPSC to cardiomyocyte differentiation), compared to alternative methods. (Alternative methods described in Fig. 2.)
Fig. 4 |
Fig. 4 |. Geneformer encoded gene network hierarchy.
a, ROC curve of Geneformer fine-tuned to distinguish central versus peripheral genes within the N1-dependent gene network using limited data (~30K ECs), compared to alternative methods. b, ROC curve of Geneformer fine-tuned to distinguish N1 activated versus non-target genes using limited data (~30K ECs), compared to alternative methods. c, ROC curve of Geneformer fine-tuned to distinguish central versus peripheral genes within the N1-dependent gene network using increasingly limited data (1K-30K ECs). d, ROC curve of Geneformer fine-tuned to distinguish central versus peripheral genes within the N1-dependent gene network using increasingly limited but more relevant data (884 ECs from healthy or dilated aortas). AUC was higher than alternative methods trained on larger dataset of ~30K ECs (Fig. 3a). e, Pretrained Geneformer attention weights of transcription factors indicated that the model learned in a completely self-supervised way the relative importance of transcription factors, which were more highly attended than other genes in 20% of attention heads (p<0.05, Wilcoxon rank sum, FDR correction) and were more attended in earlier layers (p<0.05, Wilcoxon rank sum). (Alternative methods described in Fig. 2.)
Fig. 5 |
Fig. 5 |. In silico deletion revealed network connections.
a, In silico deletion of GATA4 was significantly more deleterious to previously reported GATA4 direct targets than to housekeeping genes, previously reported NOTCH1 targets, previously reported NKX2–5 targets, or GATA4 indirect targets (*p<0.05 Wilcoxon, FDR-corrected; center line=median, box limits=upper and lower quartiles, whiskers=1.5x interquartile range, points=outliers). b, In silico deletion of GATA4 or TBX5 alone was significantly more deleterious to previously reported GATA4/TBX5 co-bound targets than to housekeeping genes; in silico deletion of the combination of GATA4 and TBX5 was even more deleterious to co-bound targets, significantly more than to housekeeping genes and significantly more than the sum of the effect of GATA4 or TBX5 alone on co-bound targets (*p<0.05 Wilcoxon, FDR-corrected).
Fig. 6 |
Fig. 6 |. In silico treatment revealed candidate therapeutic targets.
a, Fine-tuning Geneformer to distinguish cardiomyocytes from non-failing hearts or hearts affected by hypertrophic or dilated cardiomyopathy defines the embedding position of each cell state. Then, disease modeling (left) can be performed by in silico deleting or activating random genes within non-failing cardiomyocytes to define the random distribution (gray cloud) and thereby identify genes whose in silico deletion or activation shifts the embedding significantly towards either the hypertrophic or dilated cardiomyopathy state. The reverse approach is taken for in silico treatment analysis (center and right). b, Out-of-sample predictions of Geneformer fine-tuned to distinguish cardiomyocytes from non-failing hearts or hearts affected by hypertrophic or dilated cardiomyopathy. Accuracy: 90%, precision: 82%, recall 87%. (Training data: non-failing n=9, hypertrophic n=11, dilated n=9, total 93,589 cells; out-of-sample data: non-failing n=4, hypertrophic n=4, dilated n=2, total 39,006 cells). c, Hierarchical clustering of fine-tuned Geneformer cardiomyocyte cell embeddings. d, Overlap of genes whose in silico deletion in cardiomyocytes from non-failing hearts significantly shifted the fine-tuned Geneformer cell embeddings towards the hypertrophic or dilated cardiomyopathy states and Gene Ontology terms enriched for each state. e, Distribution of mean embedding shift in response to in silico deletion of candidate therapeutic targets in cardiomyocytes from hypertrophic cardiomyopathy (n=104 genes). f, Contractile force of cardiac microtissues derived from WT iPSCs or iPSCs with a TTN truncating mutation modeling dilated cardiomyopathy (WT n=11, TTN+/− n=12, *p<0.05 Wilcoxon). g, Contractile stress (force per unit area) of cardiac microtissues derived from TTN+/− iPSCs exposed to either control treatment or guides promoting CRISPR-mediated knockout of Geneformer-predicted therapeutic targets. (TTN+/− +control treatment n=22, TTN+/− +CRISPR guides targeting knockout of PLN n=22, GSN n=7, ESRRG n=9, or HMGB1 n=11; p<0.05 Wilcoxon, FDR-corrected). In (f-g): center line=median, box limits=upper and lower quartiles, whiskers=1.5x interquartile range, points=experimental replicates.

References

    1. Vaswani A Attention Is All You Need arXiv:1706.03762v5. Adv Neural Inf Process Syst 2017-Decem, (2017).
    1. Devlin J, Chang MW, Lee K & Toutanova K BERT: Pre-training of deep bidirectional transformers for language understanding. in NAACL HLT 2019 – 2019 Conference of the North American Chapter of the Association for Computational Linguistics: Human Language Technologies - Proceedings of the Conference vol. 1 4174–4186 (2019).
    1. He K, Zhang X, Ren S & Sun J Deep residual learning for image recognition. in Proceedings of the IEEE Computer Society Conference on Computer Vision and Pattern Recognition vols 2016-December 770–778 (2016).
    1. Theodoris CV et al. Human disease modeling reveals integrated transcriptional and epigenetic mechanisms of NOTCH1 haploinsufficiency. Cell 160, 1072–1086 (2015). - PMC - PubMed
    1. Theodoris CV et al. Network-based screen in iPSC-derived cells reveals therapeutic candidate for heart valve disease. Science (1979) 371, (2021). - PMC - PubMed

Publication types

LinkOut - more resources