. 2023 Jul;33(7):533-545.
doi: 10.1038/s41422-023-00827-x. Epub 2023 May 31.

Structure and transport mechanism of the human calcium pump SPCA1

Affiliations

Structure and transport mechanism of the human calcium pump SPCA1

Mengqi Wu et al. Cell Res. 2023 Jul.

Abstract

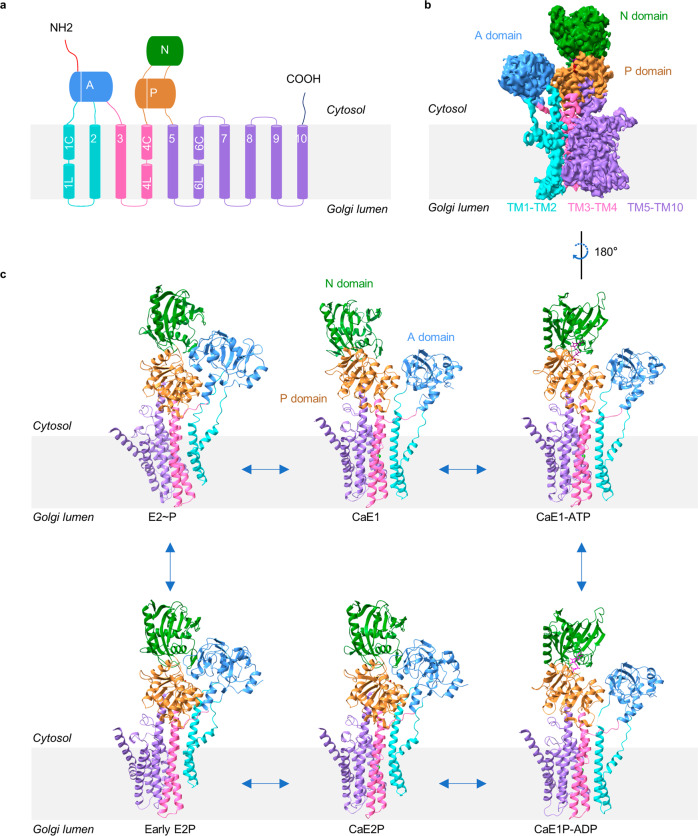
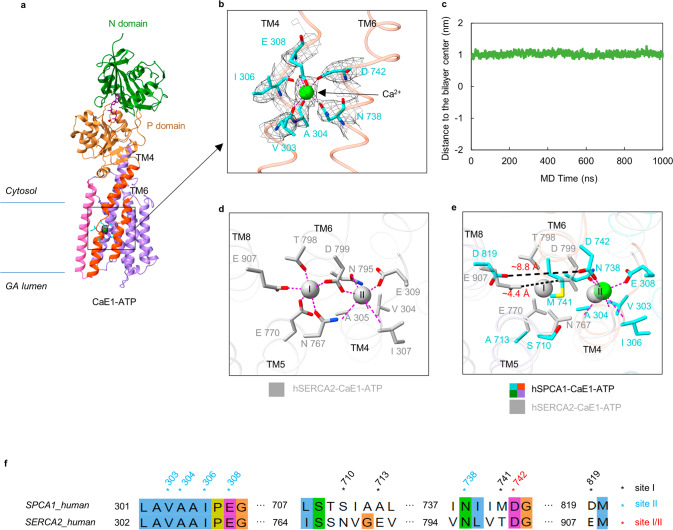
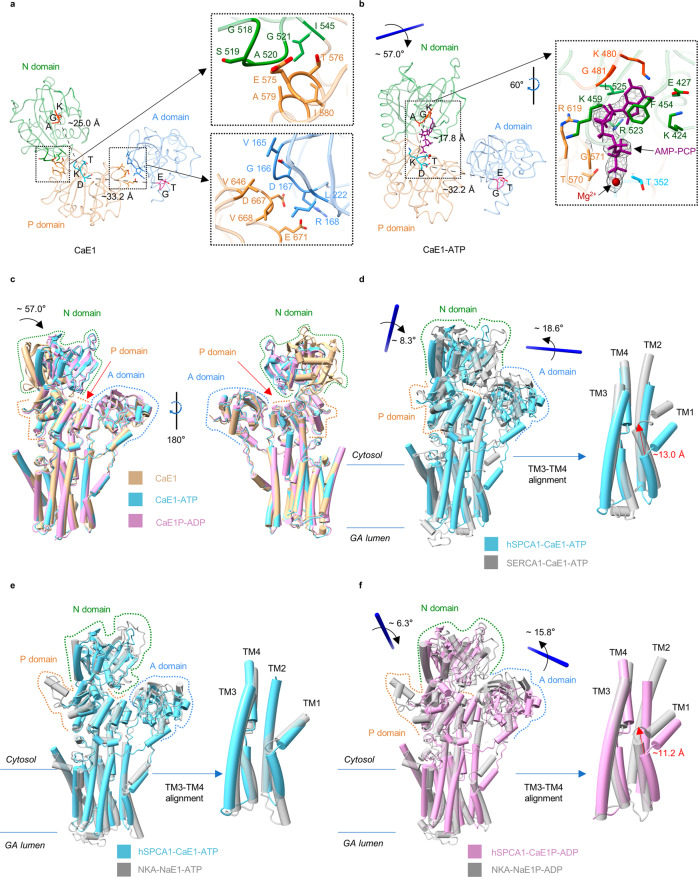
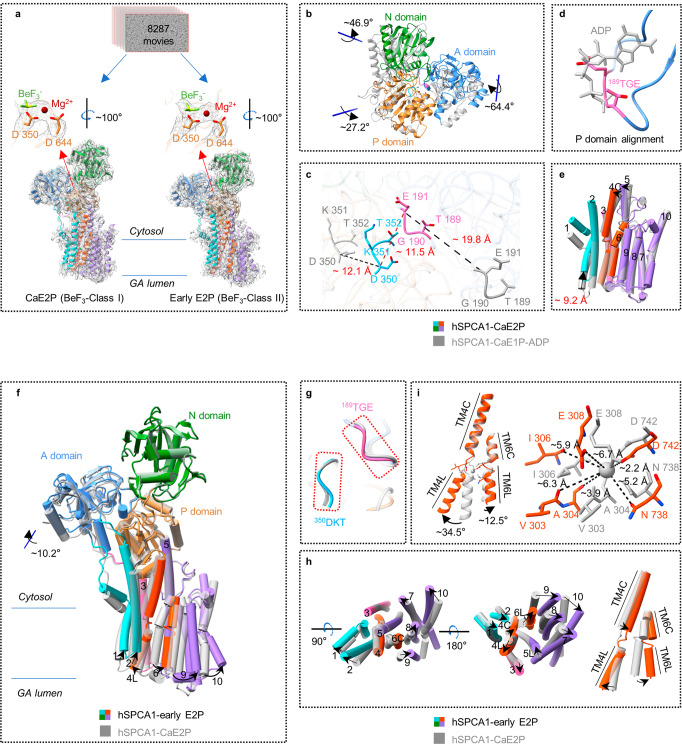
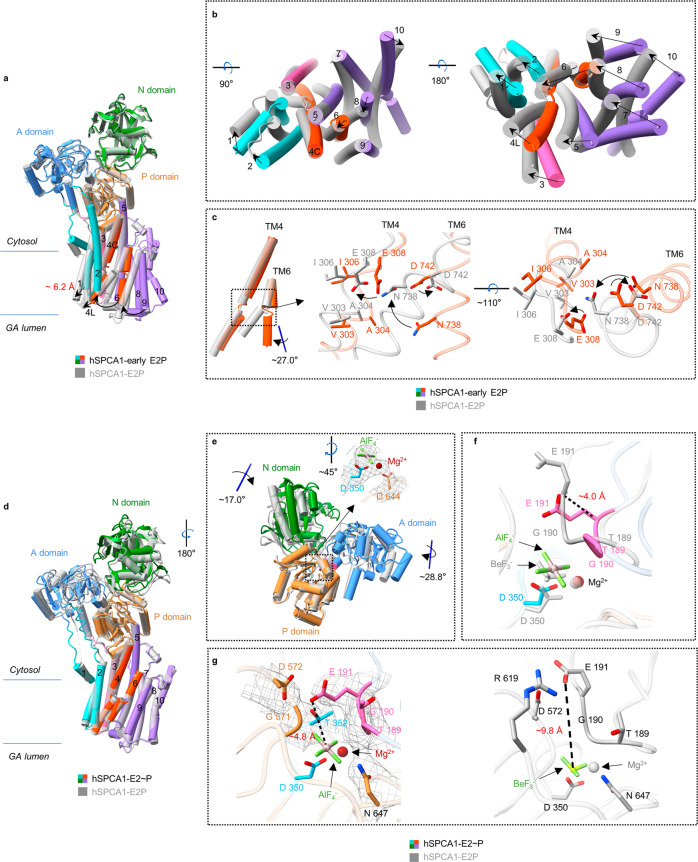
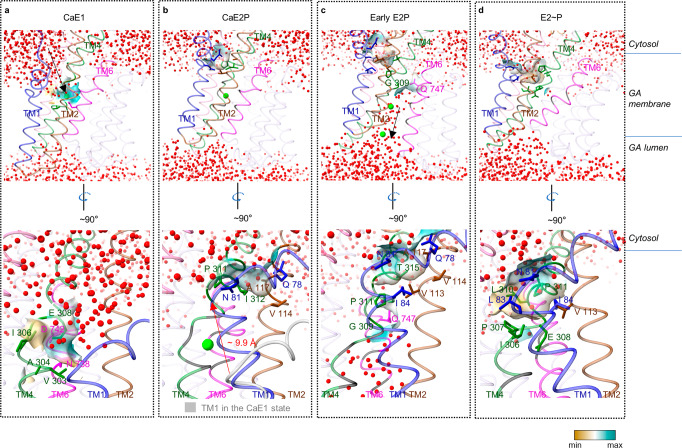
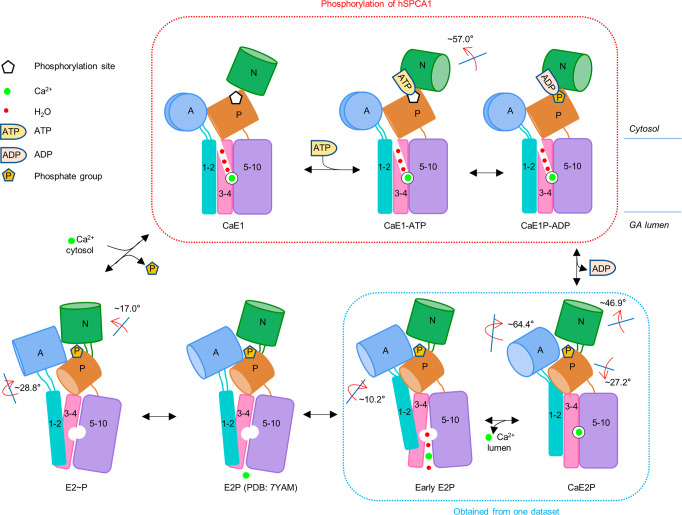
Secretory-pathway Ca2+-ATPases (SPCAs) play critical roles in maintaining Ca2+ homeostasis, but the exact mechanism of SPCAs-mediated Ca2+ transport remains unclear. Here, we determined six cryo-electron microscopy (cryo-EM) structures of human SPCA1 (hSPCA1) in a series of intermediate states, revealing a near-complete conformational cycle. With the aid of molecular dynamics simulations, these structures offer a clear structural basis for Ca2+ entry and release in hSPCA1. We found that hSPCA1 undergoes unique conformational changes during ATP binding and phosphorylation compared to other well-studied P-type II ATPases. In addition, we observed a conformational distortion of the Ca2+-binding site induced by the separation of transmembrane helices 4L and 6, unveiling a distinct Ca2+ release mechanism. Particularly, we determined a structure of the long-sought CaE2P state of P-type IIA ATPases, providing valuable insights into the Ca2+ transport cycle. Together, these findings enhance our understanding of Ca2+ transport by hSPCA1 and broaden our knowledge of P-type ATPases.


Conflict of interest statement

The authors declare no competing interests.

Figures

Fig. 1
Fig. 1. Overall architecture of hSPCA1.
a Topology diagram of hSPCA1. Conserved cytoplasmic domains and TM helices are schematically illustrated. The domains are colored as follows: A domain, cornflower blue; N domain, forest green; P domain, peru (orange-brown); N-terminal region, red; C-terminal region, deep blue; TM1–TM2, cyan; TM3–TM4, hot pink; TM5–TM10, medium purple. b Cryo-EM map (contoured at 5.3 σ) of hSPCA1 in the CaE1-ATP state, shown with the same color scheme as in a. c Atomic models of the six resolved structures of hSPCA1.
Fig. 2
Fig. 2. Structural basis for Ca2+ binding.
a Side view of hSPCA1 in the CaE1-ATP state. N and P domains are colored forest green and peru, respectively. A domain and TM1–TM2 are hidden for a clearer view. TM3 is colored hot pink. TM4 and TM6 are colored orange-red. TM5 and TM7–TM10 are medium purple. Ca2+ is shown as the lime sphere. The Ca2+ density (contoured at 15 σ) is shown as black mesh. b Atomic models and cryo-EM densities of Ca2+ and Ca2+-binding site of hSPCA1 in the CaE1-ATP state. Ca2+-binding residues are shown as the cyan sticks and Ca2+ is shown as the lime sphere. The densities are shown as black mesh, contoured at 15 σ. The interactions between residues and Ca2+ are shown by magenta dashed lines. c The stability of the Ca2+ substrate in the binding site observed in a 1-µs explicit solvent all-atom MD simulation. It shows the trajectory of the distance between the Ca2+ ion and the center of the lipid bilayer. d The two Ca2+-binding sites of hSERCA2 in the CaE1-ATP state (PDB: 6LLE). Ca2+ ions are shown as dark gray spheres. Ca2+-binding residues are shown as sticks. The magenta dashed lines represent the metal coordination bonds. e Comparison of the Ca2+-binding sites between hSPCA1 and hSERCA2 in the CaE1-ATP state. Site I and site II counterpart residues in hSPCA1 are shown as cyan sticks. Dark gray sticks are the Ca2+-binding site I residues in hSERCA2. The black dashed lines show the distance between the Ca2+-binding oxygen atoms from Asp799 and Glu907 in hSERCA2 and the distance between the oxygen atoms from Asp742 and Asp819 in hSPCA1, respectively. f Sequence alignment of hSPCA1 and hSERCA2. Black asterisks indicate residues contributing to Ca2+-binding site I. Blue asterisks indicate residues contributing to Ca2+-binding site II. The red asterisk indicates the residue contributing to both sites I and II.
Fig. 3
Fig. 3. A unique movement of cytosolic domains and TMD during phosphorylation.
a Cytoplasmic domains of hSPCA1 in the CaE1 state. A, N, and P domains are colored cornflower blue, forest green, and peru, respectively. Conserved 189TGE, 480KGA, and 350DKT motifs are colored hot pink, orange-red, and cyan, respectively. The dashed lines in the left inset show the distances from the Cα of Gly481 to the Cα of Lys351 and from the Cα of Glu191 to the Cα of Asp350. The right upper inset and right lower inset show the interaction surface between domains N and P, and that between domains A and P, respectively. The residues are shown as sticks. b Cytoplasmic domains of hSPCA1 in the CaE1-ATP state. AMP-PCP (purple ribbon), Mg2+ (dark red sphere), and the corresponding cryo-EM densities (black mesh, contoured at 16.8 σ) are shown. The dashed lines in the left inset show the distances from the Cα of Gly481 to the Cα of Lys351, and from the Cα of Glu191 to the Cα of Asp350. c Structural comparison of states CaE1 (tan), CaE1-ATP (light sky blue) and CaE1P-ADP (plum) of hSPCA1 by global alignment. d Structural comparison by P domain alignment (left) and TM3–TM4 alignment (right) of hSPCA1 (light sky blue) and SERCA1 (dark gray, PDB: 1T5S) in the CaE1-ATP state. The red arrow (right) shows the distance from the Cα of Pro82 in hSPCA1 to the Cα of Leu60 in SERCA1. e Structural comparison by global alignment (left) and TM3–TM4 alignment (right) of hSPCA1 (light sky blue) and NKA (dark gray, PDB: 7E21) in the substrate-bound E1-ATP state. f Structural comparison by P domain alignment (left) and TM3–TM4 alignment (right) of hSPCA1 (plum) and NKA (dark gray, PDB: 8D3U) in the substrate-bound E1P-ADP state. The red arrow (right) shows the distance from the Cα of Pro82 in hSPCA1 to the Cα of Gly89 in NKA.
Fig. 4
Fig. 4. Structural details of hSPCA1 in the CaE2P and early E2P states.
a Atomic models (color ribbon) and cryo-EM densities (dark gray mesh, contoured at 7.0 σ) of hSPCA1 in the CaE2P and early E2P states. The cryo-EM densities of BeF3, Mg2+, Asp350, and Asp644 of hSPCA1 in the CaE2P and early E2P states are shown (black mesh, contoured at 10.0 σ). b Structural comparison of hSPCA1 cytoplasmic domains in the CaE2P (color) and CaE1P-ADP (dark gray) states by global alignment. c The movement of the 189TGE and 350DKT motifs from the CaE1P-ADP state to the CaE2P state. The black dashed lines show the distance between Cα of Asp350 in the CaE1P-ADP state and that in the CaE2P state, and the distance between Cα of Glu191 in the CaE1P-ADP state and that in the CaE2P state. The deep red dashed line shows the distance between Cα of Glu191 and Cα of Asp350 in the CaE2P state. d The conserved 189TGE motif (hot pink) in the CaE2P state and the ADP molecule (dark gray) in the CaE1P-ADP state. e Structural comparison of hSPCA1 TMD in the CaE2P (color) and CaE1P-ADP (dark gray) states. The red text shows the distance from the Cα of Leu96 in the CaE1P-ADP state to the Cα of Leu96 in the CaE2P state. f Structural comparison of hSPCA1 in the early E2P (color) and CaE2P (dark gray) states by global alignment. g Structural comparison of the 189TGE and 350DKT motifs in the early E2P (color) and CaE2P states (dark gray). h Structural comparison of hSPCA1 TMD in the early E2P (color) and CaE2P (dark gray) states. i Structural comparison of hSPCA1 TM4 and TM6 in the early E2P (orange-red) and CaE2P (dark gray) states by alignment of TM4 and TM6. The black dashed lines (right) show the distances from the Ca2+ ion (dark gray sphere) in the CaE2P state to the main-chain carbonyl oxygen atoms of Val303, Ala304, and Ile306, and the side-chain oxygen atoms of Glu308, Asn738, and Asp742.
Fig. 5
Fig. 5. Structural comparison of hSPCA1 in three E2 states.
a Global alignment of the early E2P (color) and E2P (dark gray, PDB: 7YAM) states of hSPCA1. The red text shows the distance from the Cα of Leu96 in the early E2P state to the Cα of Leu96 in the E2P state. b Structural comparison of hSPCA1 TMD in the early E2P (color) and E2P (dark gray) states. c Comparison of TM4 and TM6, and the Ca2+-binding site between the early E2P state (orange-red) and the E2P state (dark gray) in hSPCA1. d Global alignment of the E2~P (color) and E2P (dark gray, PDB: 7YAM) states of hSPCA1. e Structural comparison of hSPCA1 cytoplasmic domains in the E2~P (color) and E2P (dark gray, PDB: 7YAM) states. The upper right panel shows the cryo-EM densities of AlF4, Mg2+, Asp350, and Asp644 (black mesh, contoured at 10.0 σ). f The movement of the 189TGE motif from the E2P state (dark gray, PDB: 7YAM) to the E2~P (color) state. The black dashed line show the distance between Cα of Glu191 in the E2P state and that in the E2~P state. g The interfaces between 189TGE motif and P domain in the E2~P (color) and E2P states (dark gray, PDB: 7YAM). The EM densities of the 189TGE motif and Thr352, Gly571, Asp572, and Asn647 in the E2~P state are shown (black mesh, contoured at 10.0 σ).
Fig. 6
Fig. 6. The Ca2+ transport pathway of hSPCA1.
a The open cytosol-facing cavity of hSPCA1 in the CaE1 state. TM1, TM2, TM4, and TM6 are colored medium blue, saddle brown, forest green, and magenta, respectively. Water molecules and Ca2+ are shown as small red balls and the lime sphere, respectively. The black arrow indicates the possible Ca2+ entry pathway. b The closed cytosol-facing cavity of hSPCA1 in the CaE2P state. The red arrow (bottom) shows the distance from the Cα of Pro82 in the CaE1 state to the Cα of Pro82 in the CaE2P state. c The closed cytosol-facing cavity and open lumen-facing cavity of hSPCA1 in the early E2P state. The black arrow indicates the Ca2+ release pathway. d The semi-open cytosol-facing cavity and closed lumen-facing cavity of hSPCA1 in the E2~P state. The Ca2+-binding residues are colored forest green, magenta, or black. The surfaces are shown with colors ranging from dark cyan (most hydrophilic) to white (intermediate) to dark goldenrod (most lipophilic).
Fig. 7
Fig. 7. A proposed model of Ca2+ transport by hSPCA1.
Schematic models of the stages of the transport cycle in hSPCA1. A, N, and P domains are shown as light cornflower blue, light forest green, and peru cylinders, respectively. TM1–TM2, TM3–TM4, and TM5–TM10 are shown as cyan, light pink, and light-medium purple rectangles. The red arrows indicate movements of the cytosolic domains (with respect to the previous state in the forward reaction).

References

    1. Berridge MJ, Lipp P, Bootman MD. The versatility and universality of calcium signalling. Nat. Rev. Mol. Cell Biol. 2000;1:11–21. doi: 10.1038/35036035. - DOI - PubMed
    1. Gao J, Gao A, Zhou H, Chen L. The role of metal ions in the Golgi apparatus. Cell Biol. Int. 2022;46:1309–1319. doi: 10.1002/cbin.11848. - DOI - PubMed
    1. Van Baelen K, et al. The Ca2+/Mn2+ pumps in the Golgi apparatus. Biochim. Biophys. Acta. 2004;1742:103–112. doi: 10.1016/j.bbamcr.2004.08.018. - DOI - PubMed
    1. Li J, Wang Y. Golgi metal ion homeostasis in human health and diseases. Cells. 2022;11:289. doi: 10.3390/cells11020289. - DOI - PMC - PubMed
    1. Toyoshima C, Nakasako M, Nomura H, Ogawa H. Crystal structure of the calcium pump of sarcoplasmic reticulum at 2.6 Å resolution. Nature. 2000;405:647–655. doi: 10.1038/35015017. - DOI - PubMed

Publication types

MeSH terms