. 2023 May 31;24(1):131.
doi: 10.1186/s13059-023-02971-4.

Hierarchical Interleaved Bloom Filter: enabling ultrafast, approximate sequence queries

Affiliations

Hierarchical Interleaved Bloom Filter: enabling ultrafast, approximate sequence queries

Svenja Mehringer et al. Genome Biol. .

Abstract

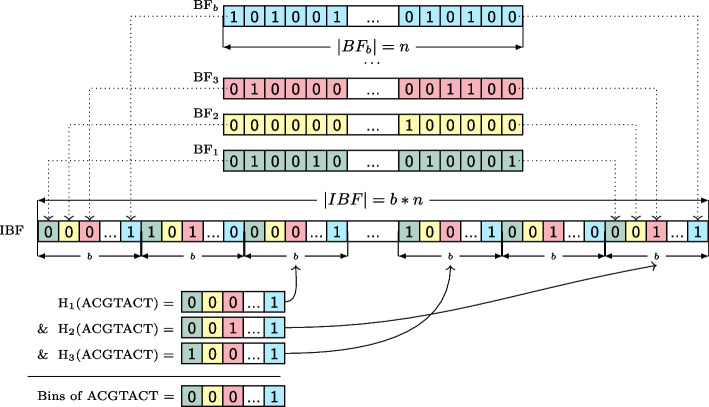
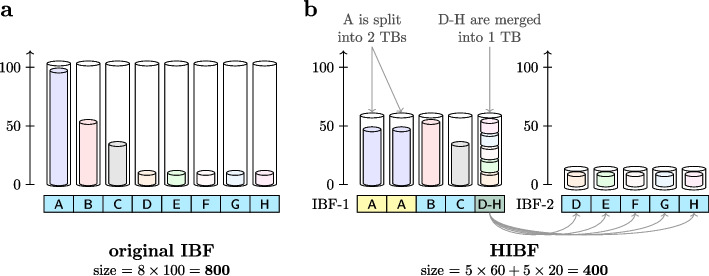
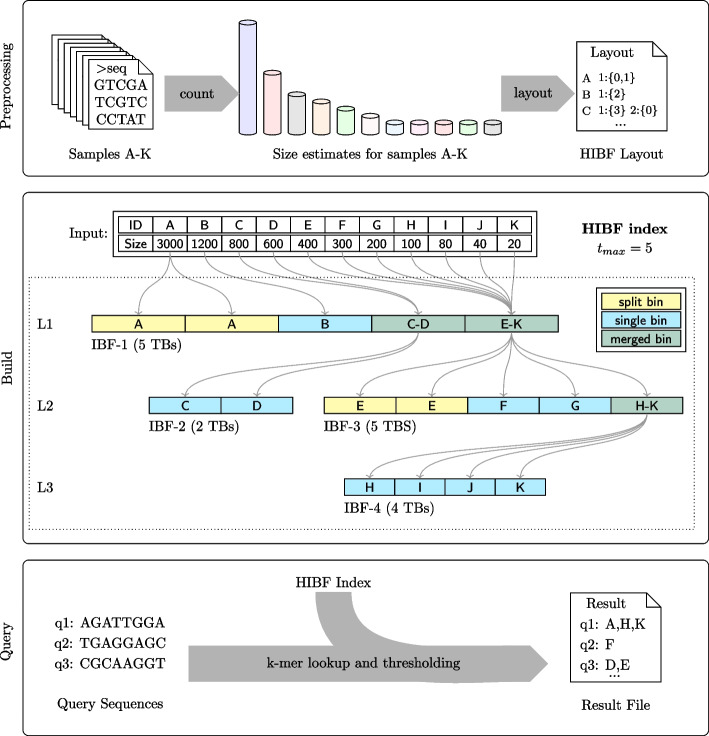
We present a novel data structure for searching sequences in large databases: the Hierarchical Interleaved Bloom Filter (HIBF). It is extremely fast and space efficient, yet so general that it could serve as the underlying engine for many applications. We show that the HIBF is superior in build time, index size, and search time while achieving a comparable or better accuracy compared to other state-of-the-art tools. The HIBF builds an index up to 211 times faster, using up to 14 times less space, and can answer approximate membership queries faster by a factor of up to 129.

Keywords: Alignment free analysis; Approximate membership query; Bloom filter; Metagenomics; Miminizer; Sequence search.


Conflict of interest statement

The authors declare that they have no competing interests.

Figures

Fig. 1
Fig. 1
Example of an Interleaved Bloom Filter (IBF). Differently colored Bloom filters (BF) of length n for b bins (samples) are shown in the upper part. Interleaving the individual Bloom filters yields an IBF of size b×n. In the example, we use three different hash functions to query a k-mer (ACGTACT) and retrieve 3 sub-bitvectors. By combining the sub-bitvectors with a bitwise &, we retrieve the binning bitvector, where a 1 indicates the presence of the k-mer in the respective bin
Fig. 2
Fig. 2
IBF vs. the HIBF. Given an input of eight user bins (UBs), subfigure a displays the layout of a normal IBF storing the content of the UBs, represented by the inner, lightly colored cylinders, in one technical bin (TB) each. The outer cylinders represent the size of the TBs and visualizes the wasted space. The horizontal rectangular bar represents the layout, indicating which UBs, identified by their ID (A-H), are stored in which TB. The same semantics hold for subfigure b which displays the corresponding HIBF with a maximum of 5 TBs on each level. In this example, UB A is split into the first two TBs in IBF-1, while UBs D-H are merged into the last TB. The merged bin requires a second lower-level IBF (IBF-2) storing the content of UB D-H in individual TBs. The size is given in exemplary numbers
Fig. 3
Fig. 3
Workflow with details on the HIBF Index structure. Using the HIBF is done in three steps. (1) Preprocessing: Based on the size (representative k-mer content) of the input sequences, a layout is computed with the tool Chopper (see the “Availability of data and materials” section). (2) Build: From a given layout, Raptor (see the “Availability of data and materials” section) builds an HIBF index depicted in the middle box. (3) Query: The HIBF index can then be used to query the membership of sequences inside the input samples. The exemplary HIBF with tmax=5 on 11 user bins (UB-A to UB-K) has 3 levels. The first level (L1) is always a single IBF (IBF-1) with exactly tmax technical bins (TB). This IBF stores the full data set, structured in a way such that its size is significantly smaller than that of a normal IBF. The individual boxes inside an IBF represent its TBs, which store the k-mer content of the labeled user bin(s). For example, in IBF-1 the content of UB-A is stored in two TBs (split), UB-B is stored in one TB (single), and UB-C to UB-D as well as UB-E to UB-K are collected in one TB each (merged). Subsequent levels may have several IBFs. Specifically, they will have one IBF for each merged bin on the previous level. For example, on the second level (L2), IBF-2 and IBF-3 correspond to the first and second merged bin of IBF-1, respectively. Note that the IBFs in the layout form a tree, where the root is the top-level IBF and the leaves are formed by IBFs without merged bins
Fig. 4
Fig. 4
Simulated data set with increasing number of user bins. Each data point refers to one data set of 64 GiB divided into the respective number of user bins. This means that the total size of the data to index does not increase with an increasing number of user bins; the data is merely split into smaller parts. a shows the query time for 10 million reads, b the peak RAM usage during querying, c the total index size stored on disk, d the build time for constructing the index, and e the peak RAM usage during building
Fig. 5
Fig. 5
All complete genomes of Archaea and Bacteria in RefSeq. The uncompressed data set has a size of about 98.8 GiB. Ten million query reads of length 250bp were simulated using the Mason simulator [19]. The parameters used for all tools (if applicable) were: canonical k-mers k=32, no k-mer filtering, false-positive rate 5%, 2 hash functions, 32 threads, query search threshold 0.7. a Query time for varying number of transcripts, the best time of three runs was used. b Index build time, including all preprocessing steps. c Peak in RAM usage during querying for varying number of transcripts. d Index size stored on disk. Numeric values can be found in Additional file 1
Fig. 6
Fig. 6
Additional experiments with varying k and (wk) for the HIBF. The maximum false-positive rate for the (H)IBF was fixed to 1.5%, and we used tmax=192 for the HIBF. a For an HIBF using canonical k-mers, the choice of k had little impact on index size as well as accuracy and achieved the best overall accuracy. Compressing the index with minimizers decreased the accuracy. Although generally all tools achieve excellent accuracy, with a minimum of 99.5% (Metagraph), it has to be noted that the accuracy is biased by a high number of true negatives. Thus, small differences in accuracy have a high impact on the actual numbers of false positives and negatives. b The index size in GiB. c The query time in seconds of the experiments on the RefSeq data set
Fig. 7
Fig. 7
DP algorithm traceback visualization. Matrices a, b, and c visualize the algorithm for a layout distributing b=7 user bins (columns) to t=5 technical bins (rows). a Shows the traceback of the initialization, all coming from the virtual starting point (-1,-1). E.g., M4,0 represents the sub-layout of splitting UB0 into all available technical bins. b Shows which cells j<j-1=3 are considered in the horizontal recursion. E.g., j=2 would indicate to merge UB3 and UB4 into TB3. c Shows which cells i<i=3 are considered in the vertical recursion. E.g., i=1 would indicate to split UB4 into TB2 and TB3
Fig. 8
Fig. 8
Rearranging user bins by agglomerative clustering. Given eight user bins (UBs) as input, sorted by their size (left-hand side), the example shows how the order may change after applying an agglomerative clustering algorithm based on sequence similarity (right-hand side). The agglomerative clustering arranged UB-2 and UB-4 next to each other, as well as UB-5 and UB-7
Fig. 9
Fig. 9
Expected cost versus real cost. The data are all complete genomes of archaea and bacteria from the RefSeq database. The relative expected cost was computed with our model, while the relative real cost was measured with a tmax-HIBF with pfpr=0.015, 4 hash functions and (24, 20)-minimizer. The cost is given as a ratio of expected cost to real cost for a 64-HIBF because measurements are platform-dependent. The correlation is >0.9, although we systematically overestimate the required time. Nevertheless, the three best tmax are in both cases 192, 256, and 512 with predicted values 0.53, 0.56, and 0.75 and real values 0.39, 0.42, and 0.40

References

    1. Venter JC, Reinert K, Zhu X. The sequence of the human genome. Science. 2001;291:1304–51. doi: 10.1126/science.1058040. - DOI - PubMed
    1. International Human Genome Sequencing Consortium Initial sequencing and analysis of the human genome. Nature. 2001;409(6822):860–921. doi: 10.1038/35057062. - DOI - PubMed
    1. Solomon B, Kingsford C. Fast search of thousands of short-read sequencing experiments. Nat Biotechnol. 2016;34(3):300–2. doi: 10.1038/nbt.3442. - DOI - PMC - PubMed
    1. Sun C, Harris RS, Chikhi R, Medvedev P. AllSome Sequence Bloom Trees. bioRxiv. 2016;090464. 10.1101/090464. - PubMed
    1. Pandey P, Almodaresi F, Bender MA, Ferdman M, Johnson R, Patro R. Mantis: A Fast, Small, and Exact Large-Scale Sequence-Search Index. Cell Syst. 2018;7(2):201–207.e4. doi: 10.1016/j.cels.2018.05.021. - DOI - PMC - PubMed

Publication types

LinkOut - more resources