

Nicotinamide N-methyltransferase sustains a core epigenetic program that promotes metastatic colonization in breast cancer
- PMID: 37259596
- PMCID: PMC10308372
- DOI: 10.15252/embj.2022112559
Nicotinamide N-methyltransferase sustains a core epigenetic program that promotes metastatic colonization in breast cancer
Abstract
Metastatic colonization of distant organs accounts for over 90% of deaths related to solid cancers, yet the molecular determinants of metastasis remain poorly understood. Here, we unveil a mechanism of colonization in the aggressive basal-like subtype of breast cancer that is driven by the NAD+ metabolic enzyme nicotinamide N-methyltransferase (NNMT). We demonstrate that NNMT imprints a basal genetic program into cancer cells, enhancing their plasticity. In line, NNMT expression is associated with poor clinical outcomes in patients with breast cancer. Accordingly, ablation of NNMT dramatically suppresses metastasis formation in pre-clinical mouse models. Mechanistically, NNMT depletion results in a methyl overflow that increases histone H3K9 trimethylation (H3K9me3) and DNA methylation at the promoters of PR/SET Domain-5 (PRDM5) and extracellular matrix-related genes. PRDM5 emerged in this study as a pro-metastatic gene acting via induction of cancer-cell intrinsic transcription of collagens. Depletion of PRDM5 in tumor cells decreases COL1A1 deposition and impairs metastatic colonization of the lungs. These findings reveal a critical activity of the NNMT-PRDM5-COL1A1 axis for cancer cell plasticity and metastasis in basal-like breast cancer.
Keywords: NNMT; breast cancer; collagen; colonization; metastasis.
© 2023 The Authors.
Conflict of interest statement
MV, CJ, ASc, ZV, KDM, KB, ALF, CH, BH, VHK, M‐MC, BH, JG‐M and RI declare no competing financial interests. JPC is an employee of Novartis. ASe and MMSO are employees of F. Hoffmann–La Roche. MB‐A owns equities in and has received laboratory support and compensation from Novartis, and served as consultant for Basilea.
Figures
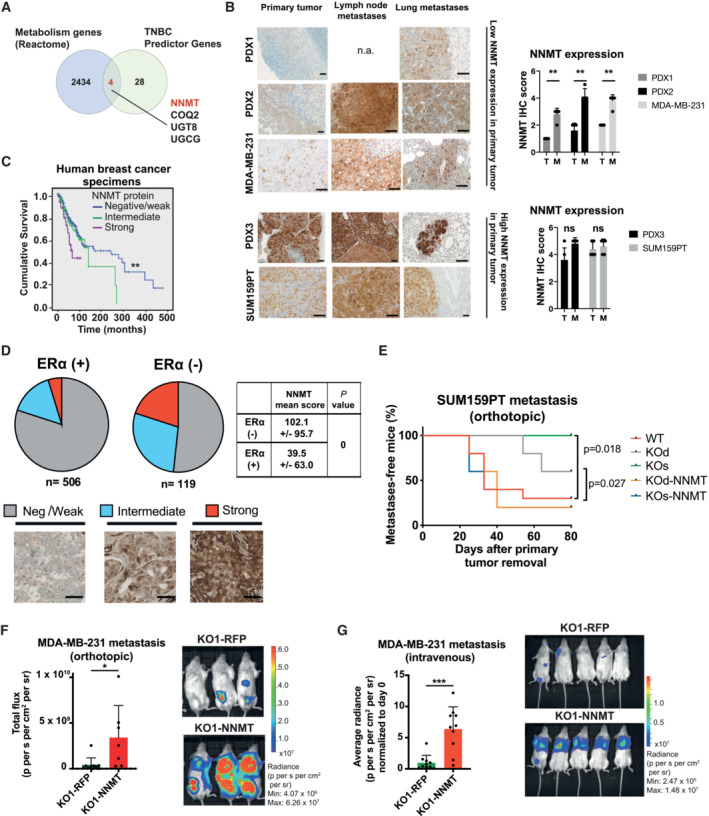
Venn diagram depicting the four metabolic genes inferred from the Reactome metabolic gene list (NNMT, COQ2, UGCG and UGT8) overlapping with genes predictive in disease recurrence of triple‐negative breast cancers (TNBC) inferred from (Kuo et al, 2012).
Representative images (left panel) and quantifications (right panel) of NNMT immunostaining in tissue sections from primary tumors (T) and metastases (M) in different breast cancer models, scale bar: 100 μm. n = 5 tissue sections per model. **P < 0.01; n.s., not significant, n.a., not available; Mann–Whitney U‐test. All data are means ± SD.
Kaplan–Meier survival analysis of breast cancer patients stratified according to NNMT protein levels (negative or weak, n = 541; intermediate, n = 108; strong, n = 44) in primary tumor (n = 517) and metastatic (n = 176) tissue. Estimated 5‐year overall survival rates for subjects with strong, intermediate, and negative/weak NNMT levels were 43.0 ± 10.0, 69.0 ± 6.0 and 73.0 ± 2.0%, respectively. **P < 0.01; log‐rank test.
Graphic quantification (pie charts) and representative images of immunostaining from 625 primary breast cancer specimens classified according to NNMT protein abundance [negative (neg)/weak, intermediate or strong]. NNMT levels are significantly higher (P = 0, Student's t‐test) in ERα negative (neg) than in ERα positive (pos) breast cancers (side table). Scale bar: 100 μm.
Kaplan–Meier plot depicting metastasis onset after tumor removal in mice injected orthotopically with SUM159PT WT (n = 10), KO (KOd: n = 5; KOs: n = 5) or KO‐NNMT (KOd‐NNMT: n = 5; KOs‐NNMT: n = 5) cells. *P < 0.05; log‐rank test.
Bar graph quantification (left panel) and representative bioluminescence images (right panel) of metastases at day 75 after cancer cell injection of MDA‐MB‐231 KO1‐RFP or KO1‐NNMT cells and post‐primary tumor removal. n = 7 to 10 animals per group. *P < 0.05; Mann–Whitney U‐test. All the data are means ± SD.
Bar graph quantification (left panel) and representative bioluminescence images (right panel) of metastases at day 34 after injection of MDA‐MB‐231 KO1‐RFP or KO1‐NNMT cells into the tail vein of the mice. n = 10 animals per group. ***P < 0.001; Mann–Whitney U‐test. All data are means ± SD.
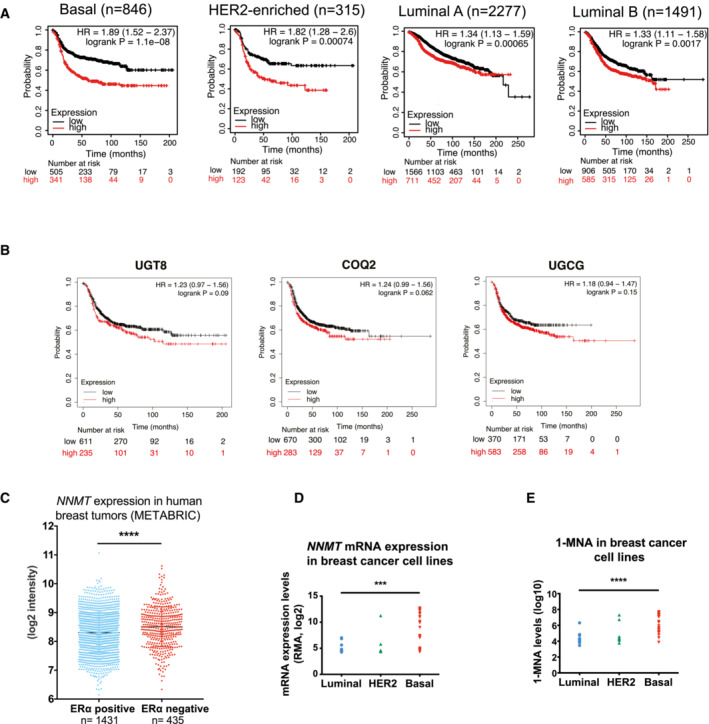
Recurrence-free survival plots generated using the Kaplan–Meier Plotter (Györffy et al, 2010) based on signal intensity of the NNMT probe (202237_at) in Affymetrix microarray gene expression data from breast cancer patients of The Cancer Genome Atlas. The cut‐off was automatically set to split patients into two groups, high and low. NNMT expression is a strong indicator of poor recurrence‐free survival in the basal subset (median survival in months is 37 and 17 in low and high groups, respectively), in the HER2‐positive subset (median survival in months is 25.76 and 17 in the low and high groups, respectively), in the luminal A subset (median survival in months is 91.36 and 57.3 in the low and high groups, respectively), and in the luminal B subset (median survival in months is 50.07 and 37.0 in the low and high groups, respectively). The hazard ratio (95% confidence intervals) and log‐rank P values for each graph are indicated.
Recurrence‐free survival plots generated using the Kaplan–Meier Plotter (Györffy et al, 2010) based on signal intensity of the UGT8 (208358_s_at), COQ2 (213379_at), UGCG (204881_s_at), probes in Affymetrix microarray gene expression data from breast cancer patients of The Cancer Genome Atlas, restricted to the basal subgroup according to the PAM50 classification (n = 953). The cut‐off was automatically set to split patients into two groups, high and low. The hazard ratio (95% confidence intervals) and log‐rank P values for each graph are indicated.
Dot plot showing NNMT expression in ERα‐positive vs ERα‐negative breast cancer cases in the METABRIC (Curtis et al, ; Pereira et al, 2016) cohort. ****P < 0.0001; Student t‐test. n = 1866 patients. Data are means ± SD.
Dot plot depicting NNMT mRNA expression in breast cancer cell lines from the Cancer Cell Line Encyclopedia (CCLE) atlas (Ghandi et al, 2019), ***P < 0.001; Student t‐test.
Dot plots depicting 1‐MNA abundance in breast cancer cell lines from the Cancer Cell Line Encyclopedia (CCLE) atlas (Ghandi et al, 2019), ****P < 0.0001; Student t‐test.
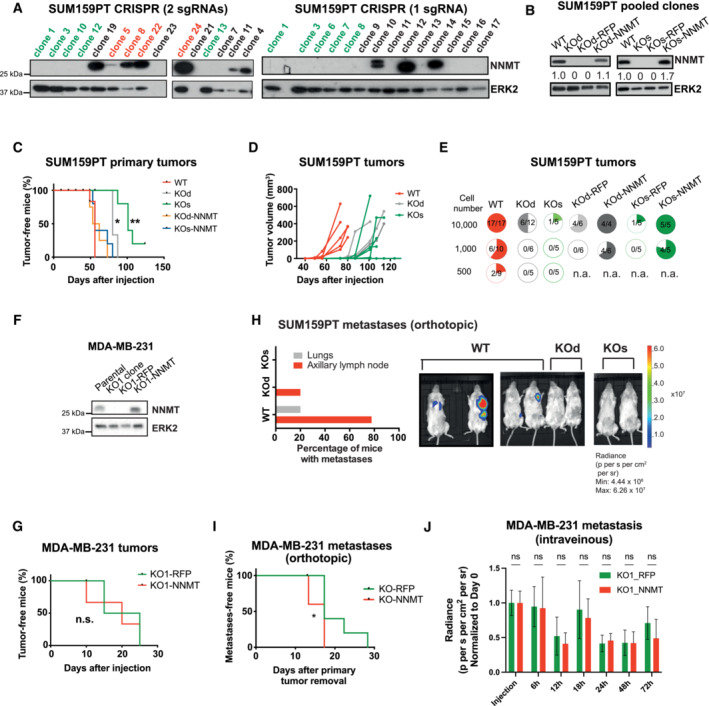
Immunoblots showing levels of NNMT and ERK2 (loading control) in single‐cell derived clones of SUM159PT after NNMT KO using two independent CRISPR‐Cas9 strategies (left: KOd, right: KOs). For each group, single‐cell clones were pooled in equal proportions to minimize undesired off‐target and clonal effects (in red for WT and green for KOd and KOs).
Immunoblots showing NNMT and ERK2 (loading control) levels in SUM159PT KOd, KOs, and WT pooled clones and the respective rescue cell lines.
Kaplan–Meier plot depicting tumor onset in mice injected orthotopically with SUM159PT WT (median 56 days; n = 5), KO (KOd: median 80 days, n = 5; KOs: median 101 days, n = 5) or KO‐NNMT cells (KOd‐NNMT: median 58 days, n = 4; KOs‐NNMT: median 56 days, n = 5). *P < 0.05, **P < 0.01; log‐rank test.
Graph representing the kinetics of SUM159PT WT (n = 5), KOd (n = 3), and KOs (n = 5) tumor growth upon orthotopic injection of 100,000 cells into NSG mice. The median onset (tumor volume approximately 5 mm3) is 45, 77 and 85 days for WT, KOd, and KOs tumors, respectively.
Quantification of tumor incidence (pie charts) in the SUM159PT model upon orthotopic injection into mice of WT, NNMT KO or NNMT rescue cells.
Immunoblots showing NNMT and ERK2 (loading control) levels in MDA‐MB‐231 parental cells and in a single KO clone (KO1) and the respective rescue cell lines.
Kaplan–Meier plot depicting tumor onset in mice injected orthotopically with MDA‐MB‐231 KO1‐RFP (median 20 days; n = 5) or KO1‐NNMT (median 20 days; n = 5). n.s., not significant; log‐rank test.
Bar plot depicting the proportion of organ‐specific metastases in mice injected with SUM159PT WT (n = 9) or NNMT KO (KOd, n = 5 and KOs, n = 5) cells. Representative bioluminescence images are shown.
Kaplan–Meier plot depicting metastasis onset after tumor removal in mice injected with MDA‐MB‐231 KO1‐RFP (n = 10) or MDA‐MB‐231 KO1‐NNMT (n = 4). *P < 0.05; log‐rank test. All data are means ± SD.
Bar graph quantification of luciferase signal from the lungs of NSG mice injected with MDA‐MB‐231 KO1‐RFP or KO1‐NNMT cells into the tail vein of mice, right after injection and at 6, 12, 18, 24, 48 and 72 h post‐injection. n = 5 animals per group. n.s. not significant; the Mann–Whitney U‐test. All data are means ± SD.
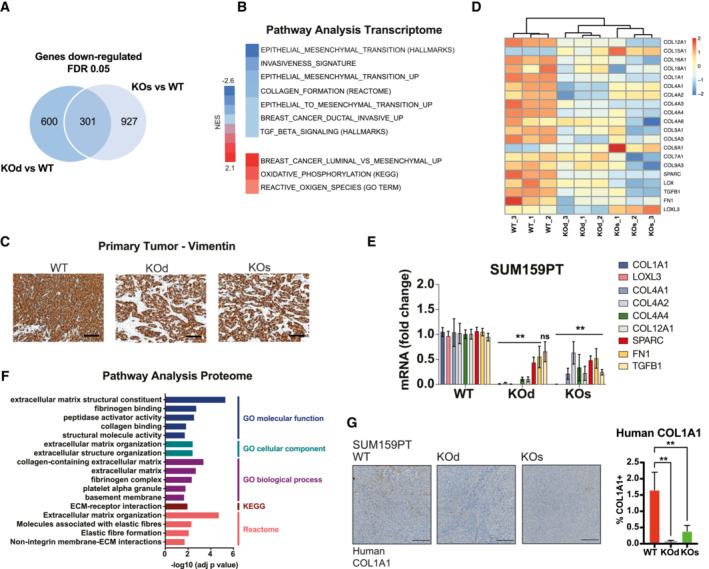
Venn diagram depicting the 301 genes commonly downregulated upon NNMT ablation in the SUM159PT KOs versus WT and KOd versus WT comparisons. n = 3 experimental replicates per group. Cut‐off: FDR < 0.05, log2 fold change > 0.85.
Gene Set Enrichment Analysis (GSEA) with NNMT KO‐specific genes (genes simultaneously changed in both KOd and KOs pools relative to WT cells).
Representative histological images of SUM159 PT ‐WT, ‐KOd, and KOs tumors immunostained with an anti‐human vimentin antibody. n = 5 tumors, 2 sections each. Scale bar: 100 μm.
Heat map depicting the concomitantly downregulated collagens and their processing machinery by mRNA expression in SUM159PT KOd and KOs versus WT cells.
Bar graph representing average mRNA expression of collagens and collagen processing genes in the SUM159PT cell model upon NNMT KO. n = 2 to 3 experimental replicates with 2–3 technical replicates each. **P < 0.01, n.s., not significant; Two‐way ANOVA. All data are means ± SD.
Pathway enrichment analysis (GO, KEGG and Reactome) for concomitantly downregulated proteins in SUM159PT KOd and KOs cells versus WT. Cut‐off: FDR < 0.05, log2 fold change > 1.
Representative images of human COL1A1 immunostaining (left panel) and bar graph quantification of COL1A1 positive area (right panel) in tissue sections of SUM159PT WT, KOd, and KOs tumors. n = 10 to 15 tumors per model with 2–4 tissue sections per tumor. **P < 0.01; Kruskal–Wallis test. All data are means ± SD. Scale bar: 200 μm.
- A
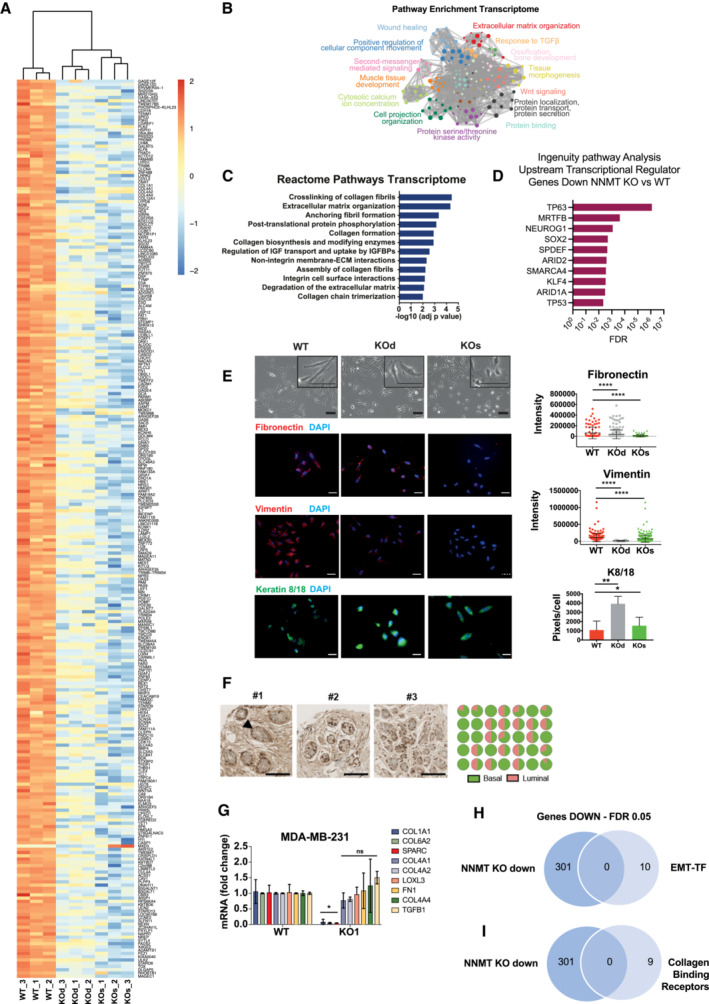
Heat map depicting the 301 concomitantly downregulated genes in SUM159PT KOd and KOs versus WT cells. n = 3 experimental replicates per group. Cut‐off: FDR < 0.05, log2 fold change > 0.85.
- B, C
Pathway enrichment analyses (B: Metascape, C: Reactome) analysis of the 301 commonly downregulated genes depicted in panel (A).
- D
Ingenuity Pathway Analysis (Upstream Regulators) of the 301 commonly downregulated genes depicted in panel (A).
- E
Left panel: Representative phase contrast and immunofluorescence images of SUM159PT WT, KOd and KOs cells demonstrating loss of mesenchymal morphology and acquisition of epithelial‐like features in NNMT KO cells. Right panel: immunofluorescence quantification (n = 3 experimental replicates) showing decreased protein expression of the mesenchymal fibronectin and vimentin markers and the luminal cytokeratins 8/18 in SUM159PT KOd and KOs cell compared to WT cells. *P < 0.5, **P < 0.01, ****P < 0.0001; Student t‐test. Scale bars: 50 μm. Data are means ± SD.
- F
Left panel: Representative images of NNMT immunostaining in normal breast ducts from 35 breast cancer patients showing preferential expression in the basal cell compartment (arrowhead). Right panel: pie chart quantification of the percentage of NNMT‐positive cells within the basal and luminal compartments. Scale bar: 100 μm.
- G
Bar graph representing average mRNA expression of collagens and collagen processing genes in the MDA‐MB‐231 cell model upon NNMT KO. n = 2–3 experimental replicates with 2–3 technical replicates each. *P < 0.05, n.s., not significant; Two‐Way ANOVA. All data are means ± SD.
- H
Venn diagram depicting overlap between the 301 genes commonly downregulated upon NNMT ablation in the SUM159PT KO versus WT comparison and a list of the 10 most described EMT‐inducing transcription factors, EMT‐TF (SNAI1, SNAI2 TWIST1, TWIST2, ZEB1, ZEB2, SOX4, SOX9, FOXC1, FOXC2).
- I
Venn diagram depicting overlap between the 301 genes commonly downregulated upon NNMT ablation in the SUM159PT KO versus WT comparison and a list of known collagen binding receptors (ITGB1, ITGA2 ITGA10, ITGA11, DDR1, DDR2, GP6, LAIR1, GPR56).
- A
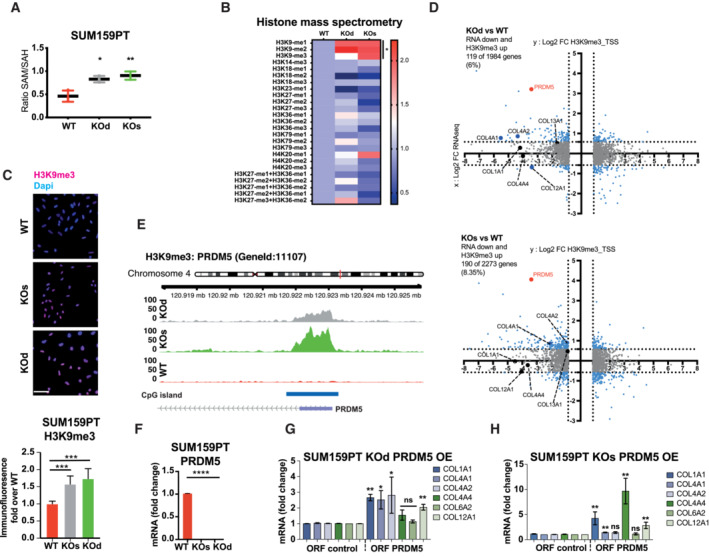
Bar graph depicting increased ratio of S‐adenosylmethionine (SAM): S‐adenosylhomocysteine (SAH) in SUM159PT KOd and KOs compared to WT cells. n = 3 technical replicates. *P < 0.05; **P < 0.01; Mann–Whitney U‐test. All data are means ± SD.
- B
Heat map showing relative levels of histones 3 and 4 methylation marks in SUM159PT KOd and KOs cells compared to WT cells, as quantified by targeted mass spectrometry in purified histone extracts. n = 3 experimental replicates per group. *P < 0.05; Mann–Whitney U‐test.
- C
Bar graph and images depicting H3K9me3 signal by immunofluorescence in SUM159PT WT, KOs, and KOd cells. n = 3 to 4 experimental replicates with 4 to 5 technical replicates each. ***P < 0.001; n.s., not significant; Kruskal–Wallis test. All data are means ± SD. Scale bar: 50 μm.
- D
Dot plots depicting the overlap of H3K9me3 ChIP‐sequencing and mRNA‐sequencing data. In the y axis: differential H3K9me3 enrichment at the gene promoter in NNMT KO compared to WT cells. In the x axis: differential mRNA expression of NNMT KO compared to the WT cells. n = 3 experimental replicates. Cut‐off: adjusted P < 0.05. Bold dots highlight collagen genes and PRDM5.
- E
H3K9me3 signal at the TSS of PRDM5 extracted from BAM files.
- F
Bar graph representing average PRDM5 mRNA expression in SUM159PT KOs, KOd, and WT cells. n = 3 experimental replicates with two technical replicates each. ****P < 0.0001; Mann–Whitney U‐test. All the data are means ± SD.
- G, H
Bar graphs representing average collagen gene mRNA expression upon overexpression (OE) of PRDM5 in SUM159PT KOd (G) and KOs (H) cells. n = 3 to 5 experimental replicates with two technical replicates each. *P < 0.05, **P < 0.01, n.s., not significant; Kruskal–Wallis test. All data are means ± SD.
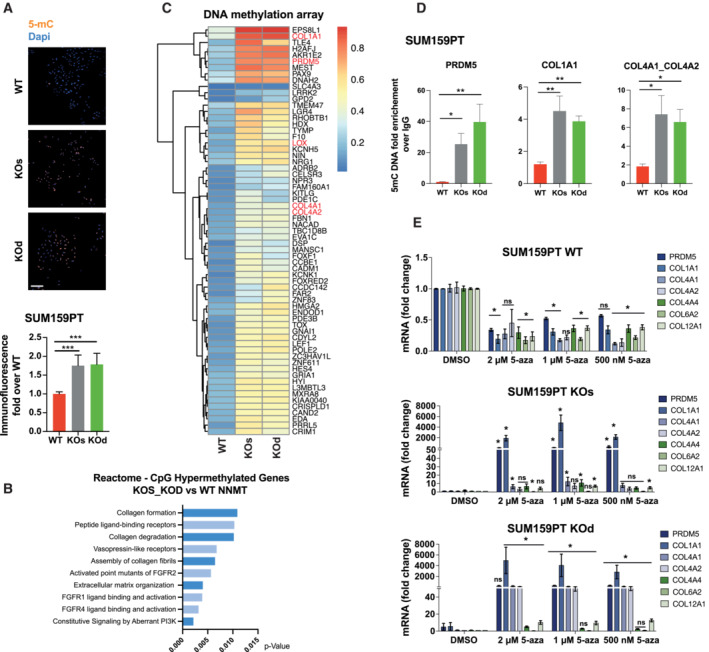
Representative images and bar graph quantification depicting 5‐methylcytosine (5‐mC) signal by immunofluorescence in SUM159PT WT, KOs, and KOd cells. n = 2 experimental replicates with 5 to 6 technical replicates each. ***P < 0.001; Kruskal–Wallis test. Data are means ± SD. Scale bar: 50 μm.
Pathway enrichment analysis (Reactome) of the top 500 genes displaying promoter CpG hypermethylation upon NNMT KO (FDR > 0.05).
Heat map showing hypermethylated CpGs located at gene promoters (cut‐off: differential average beta values > 0.03; averaged by gene), whose expression at the mRNA level is downregulated in NNMT KO cells compared to WT.
Bar graphs depicting 5‐mC abundance at promoters of the indicated genes shown as fold enrichment of methylated DNA immunoprecipitate (MedIP) over IgG control. n = 3 experimental replicates with 2 to 3 technical replicates each. *P < 0.05, **P < 0.01, n.s., not significant; Kruskal–Wallis test. Data are means ± SEM.
Bar graphs representing average PRDM5 and collagen gene mRNA expression upon 5‐aza treatment in SUM159PT WT, KOs and KOd cells. n = 3 experimental replicates with two technical replicates each. *P < 0.05, n.s., not significant; Kruskal–Wallis test. Data are means ± SEM.
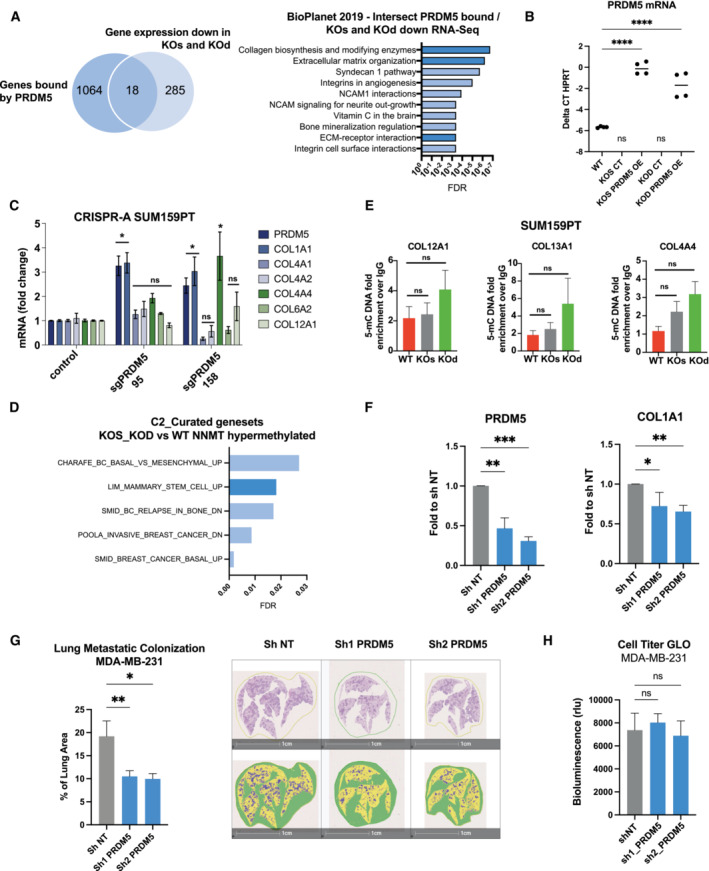
Left panel: Venn diagram depicting the intersection of PRDM5 bound genes (Galli et al, 2012) with genes commonly downregulated in NNMT KOs and KOd cells. n = 3 experimental replicates. Cut‐off: FDR < 0.05, Log2 fold change > 0.85. Right panel: Pathway analysis (BioPlanet – 2019) of the 18 genes identified in the upper panel. Dark blue bars highlight ECM and collagen‐associated terms.
Dot plot depicting PRDM5 mRNA expression in SUM159PT WT, KOd, KOs and PRDM5 over‐expression lines (n = 2 experimental replicates, with two technical replicates). ****P < 0.0001, n.d., not detected; One‐Way ANOVA. Central band indicates the mean.
Bar graph representing average collagen gene mRNA expression upon overexpression of PRDM5 from its endogenous promoter using CRISPR‐Activating technology in SUM159PT parental cells. n = 3 experimental replicates with two technical replicates each. *P < 0.05, n.s., not significant; Kruskal–Wallis test. Data are means ± SEM.
Gene set enrichment analysis (C2 – Curated GSEA, breast cancer‐related gene signatures) of the top 500 genes displaying promoter CpG hypermethylation upon NNMT KO (FDR > 0.05).
Bar graphs depicting 5‐mC abundance at promoters of indicated genes shown as fold enrichment of methylated DNA immunoprecipitate (MedIP) over IgG control. n = 3 experimental replicates with 2 to 3 technical replicates each. n.s., not significant; Kruskal–Wallis test. All data are means ± SEM.
Bar graphs representing PRDM5 and COL1A1 mRNA expression in MDA‐MB‐231 cells expressing sh NT or sh PRDM5. n = 4 experimental replicates. *P < 0.05, **P < 0.01, ***P < 0.001, n.s., not significant; Mann–Whitney U‐test. All data are means ± SEM.
Left panel: bar graph quantification of lung metastatic positive area in the different conditions. n = 4 to 5 lungs per condition. *P < 0.05, **P < 0.01; One‐way ANOVA. All data are means ± SEM. Right panel: representative images of MDA‐MB‐231 lung metastatic foci stained with HE staining, in sh NT and sh PRDM5 experimental conditions. Scale bar: 1 cm.
Bar graph showing quantification of Cell Titer GLO assay comparing MDA‐MB‐231 cells expressing sh NT or sh PRDM5. n = 6 experimental replicates. n.s., not significant; One‐way ANOVA. All data are means ± SD.
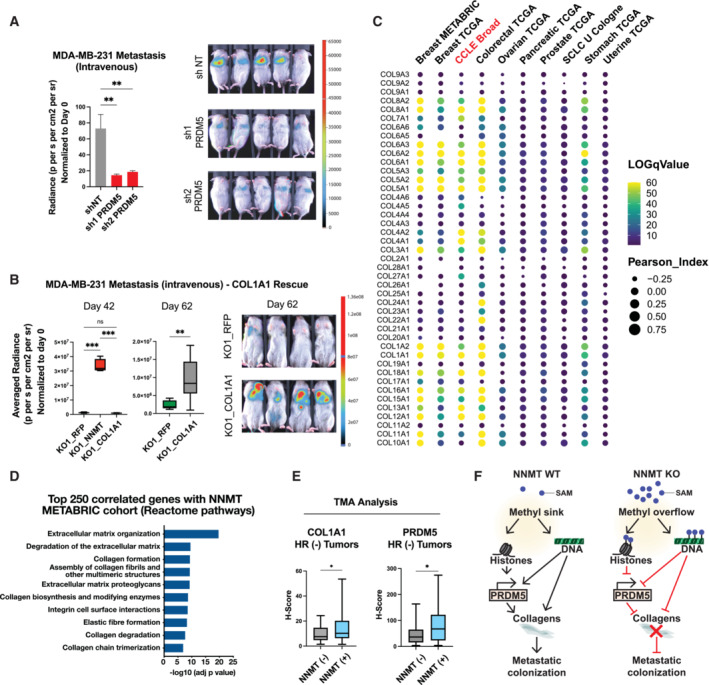
Bar graph quantification (left panel) and representative bioluminescence images (right panel) of metastases at day 27 after injection of MDA‐MB‐231 cells into the tail vein of mice bearing short hairpin sh NT (non‐targeting), sh1 or sh2 targeting PRDM5. Mice were fed with doxycycline food to sustain shRNA expression during the whole experiment. n = 7 to 8 animals per group. **P < 0.01; One‐way ANOVA. All the data are means ± SD.
Box plots depicting bioluminescence quantification (left panel) and representative images (right panel) of metastases at day 42 and day 62 after intravenous injection of MDA‐MB‐231 KO1_RFP, KO1_NNMT1 and KO1_COL1A1 (COL1A1 over‐expression) cells. n = 4 to 8 animals per group. **P < 0.01, ***P < 0.001; Day 42: One‐way ANOVA, Day 62: Student t‐test. Boxes define the upper and lower quartiles; central band indicate the median; whiskers define max to min values.
Bubble plot depicting Spearman's correlation coefficient (circle size) and log q‐Value (color scale) between collagen genes and NNMT expression across different cancer types and within the CCLE dataset (Bell et al, ; Curtis et al, ; Koboldt et al, ; Getz et al, ; Abeshouse et al, ; George et al, ; Hoadley et al, ; Ghandi et al, 2019).
Pathway enrichment analysis (Reactome) of the top 250 genes positively correlating with NNMT expression in the METABRIC (Curtis et al, ; Pereira et al, 2016) cohort.
Box plots showing COL1A1 and PRDM5 expression level (H‐Score) according to the NNMT status (NNMT negative, n = 17; NNMT positive, n = 47) within the hormone receptor‐negative (HR−) tumor samples. *P < 0.05; Student t‐test. Boxes define the upper and lower quartiles; central band indicate the median; whiskers define max to min values.
Graphical abstract illustrating the molecular mechanisms by which NNMT evokes plasticity and expression of ECM components that favor metastatic colonization.
- A
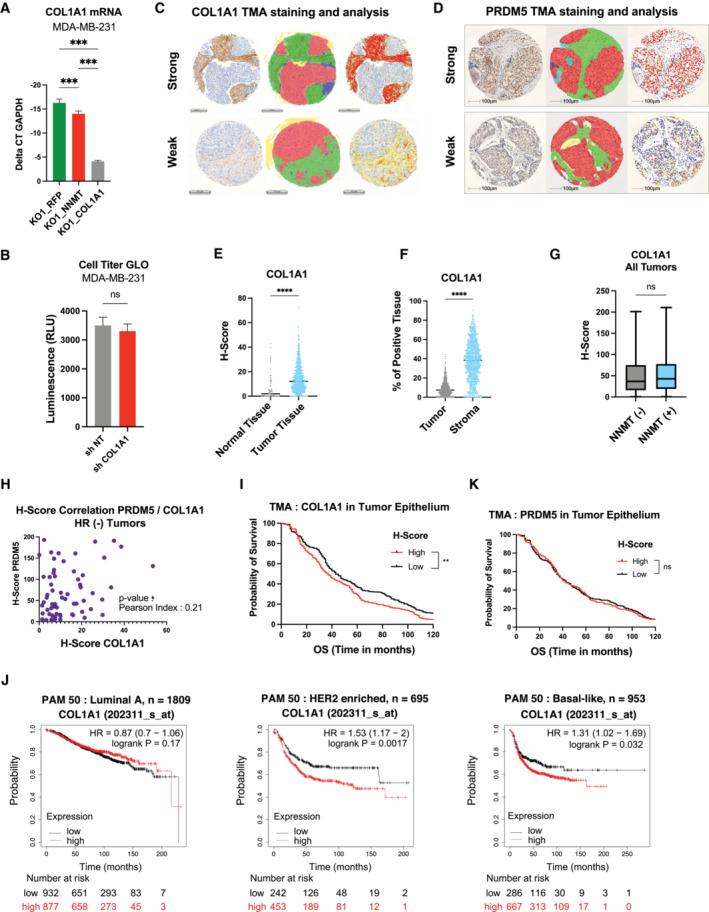
Bar graph showing COL1A1 mRNA expression in MDA‐MB‐231 KO1_RFP, KO1_NNMT and KO1_COL1A1 (COL1A1 over expression) cells. n = 3 experimental replicates. ***P < 0.001; One‐way ANOVA. All data are means ± SD.
- B
Bar graph showing quantification of Cell Titer GLO assay comparing MDA‐MB‐231 cells expressing sh NT or sh COL1A1. n = 6 experimental replicates. n.s., not significant; Student t‐test. Data are means ± SD.
- C, D
Representative COL1A1 and PRDM5 staining of breast cancer tissues cores of the tissue‐microarrays (TMAs, left). Classes used for training a deep neural network algorithm: The red area corresponds to the tumor; stroma has been sub‐classified into desmoplastic (green) and inflamed (blue) (middle). Heatmap showing differential expression of the respective markers (right). COL1A1; Scale bar, 200 μm. PRDM5; Scale bar, 100 μm.
- E
Dot plot showing COL1A1 expression level (H‐Score) across the different sample types: normal tissue (n = 76) or primary tumor (PT, n = 757) ****P < 0.0001, Student t‐test.
- F
Dot plot showing COL1A1 expression level (H‐Score) across the different areas of the tissue section: tumor epithelium versus stroma (n = 857). ****P < 0.0001; Student t‐test.
- G
Bar Graph showing COL1A1 expression level (H‐Score) according to the NNMT status within all tumor samples. NNMT (−) negative, n = 193; NNMT (+) positive, n = 170. n.s., non‐significant; Student t‐test. Boxes define the upper and lower quartiles; central band indicates the median; whiskers define max to min values.
- H
Dot plot showing correlation of PRDM5 (x‐axis) and COL1A1 (y‐axis) H‐scores inferred from HR–negative tumor patient samples from the TMA (n = 64), *P < 0.05 correlation P‐value. Pearson index is indicated.
- I
Kaplan–Meier plot depicting survival of breast cancer patients stratified according to COL1A1 protein levels (H‐Score) specifically in the tumor epithelium area (n = 857; median cut‐off). Estimated 10‐year overall survival rates are 37 (medium/high COL1A1 group) and 43 months (low/negative COL1A1 group), respectively. **P < 0.01; log‐rank test.
- J
Recurrence-free survival plots generated using the Kaplan–Meier Plotter based on signal intensity of COL1A1 (202311_s_at) probe in Affymetrix microarray gene expression data from breast cancer patients of The Cancer Genome Atlas (Györffy et al, 2010), in the luminal A (n = 1809), HER2‐enriched (n = 695) and basal (n = 953) subgroups according to the PAM50 classification. The cut‐off was automatically set to split patients into two groups, high and low. The hazard ratio (95% confidence intervals) and log‐rank P‐values for each graph are indicated.
- K
Kaplan–Meier survival analysis of breast cancer patients stratified according to PRDM5 protein levels (H‐Score) specifically in the tumor epithelium area (n = 857; median cut‐off). Estimated 10‐year overall survival rates. n.s., non‐significant; log‐rank test.
References
-
- Ahrné E, Glatter T, Viganò C, Von Schubert C, Nigg EA, Schmidt A (2016) Evaluation and improvement of quantification accuracy in isobaric mass tag‐based protein quantification experiments. J Proteome Res 15: 2537–2547 - PubMed
Publication types
MeSH terms
Substances
Associated data
- Actions
- Actions
Grants and funding
LinkOut - more resources
Full Text Sources
Medical
Molecular Biology Databases
Research Materials
Miscellaneous
