. 2023 Aug 11;51(14):7602-7618.
doi: 10.1093/nar/gkad483.

Nsp14 of SARS-CoV-2 inhibits mRNA processing and nuclear export by targeting the nuclear cap-binding complex

Affiliations

Nsp14 of SARS-CoV-2 inhibits mRNA processing and nuclear export by targeting the nuclear cap-binding complex

Jun Katahira et al. Nucleic Acids Res. .

Abstract

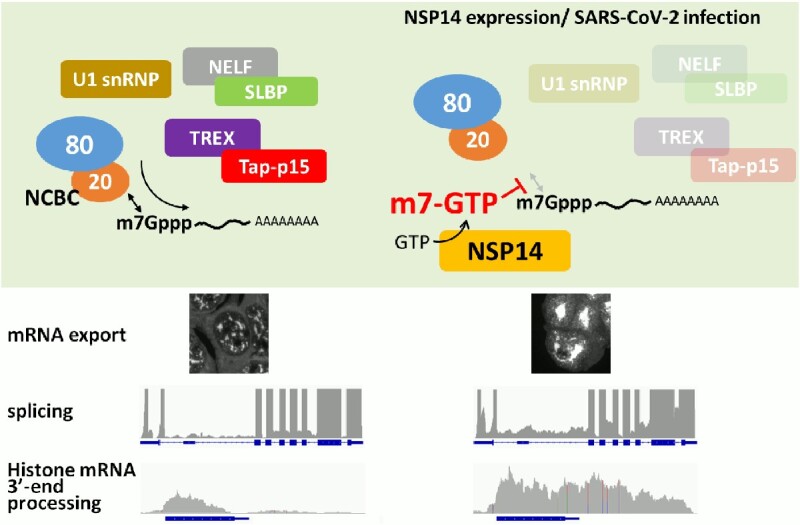
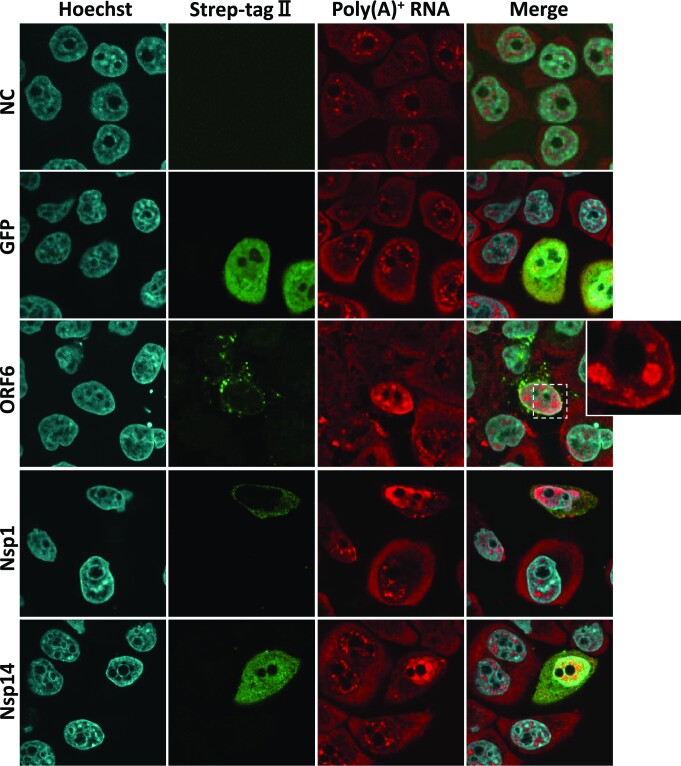
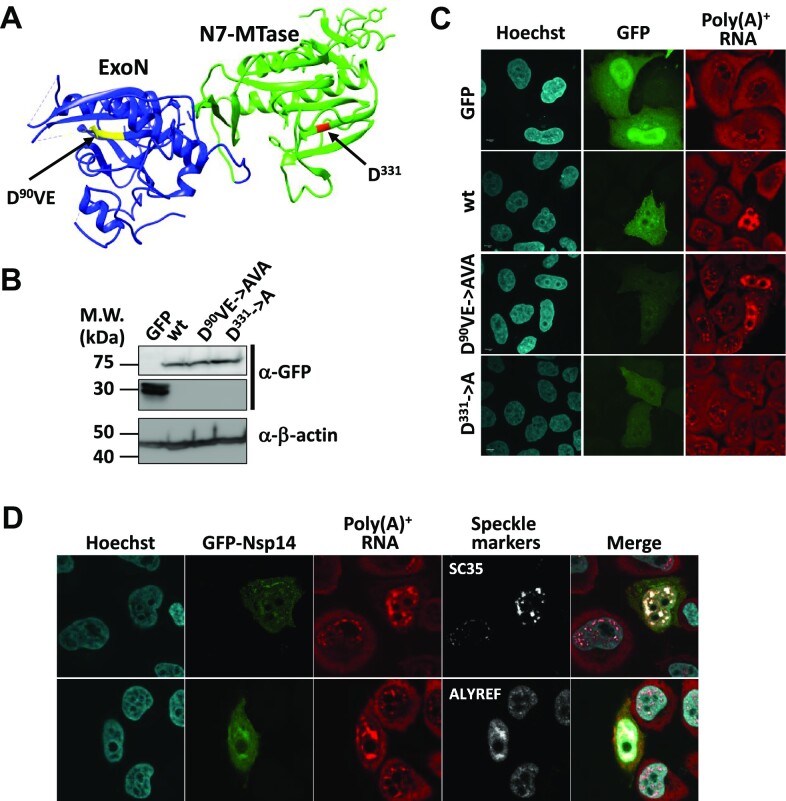
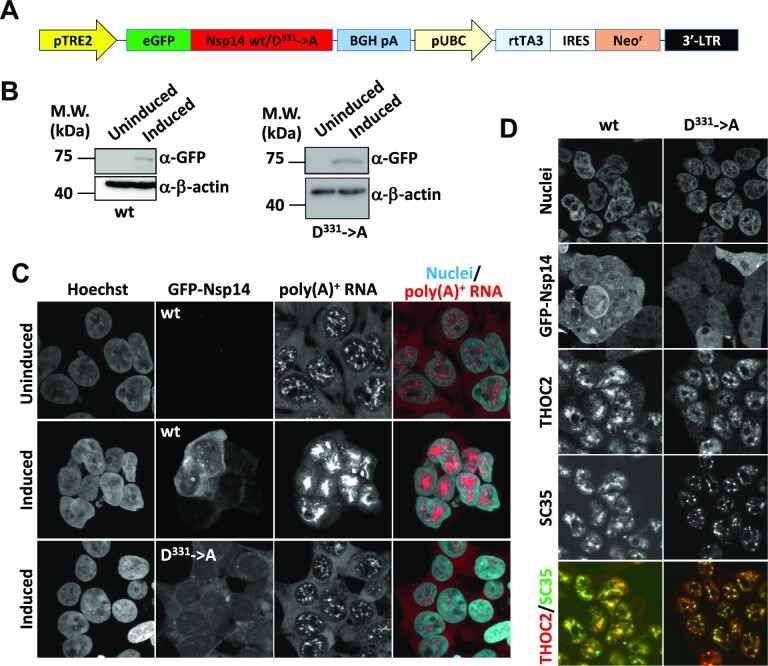
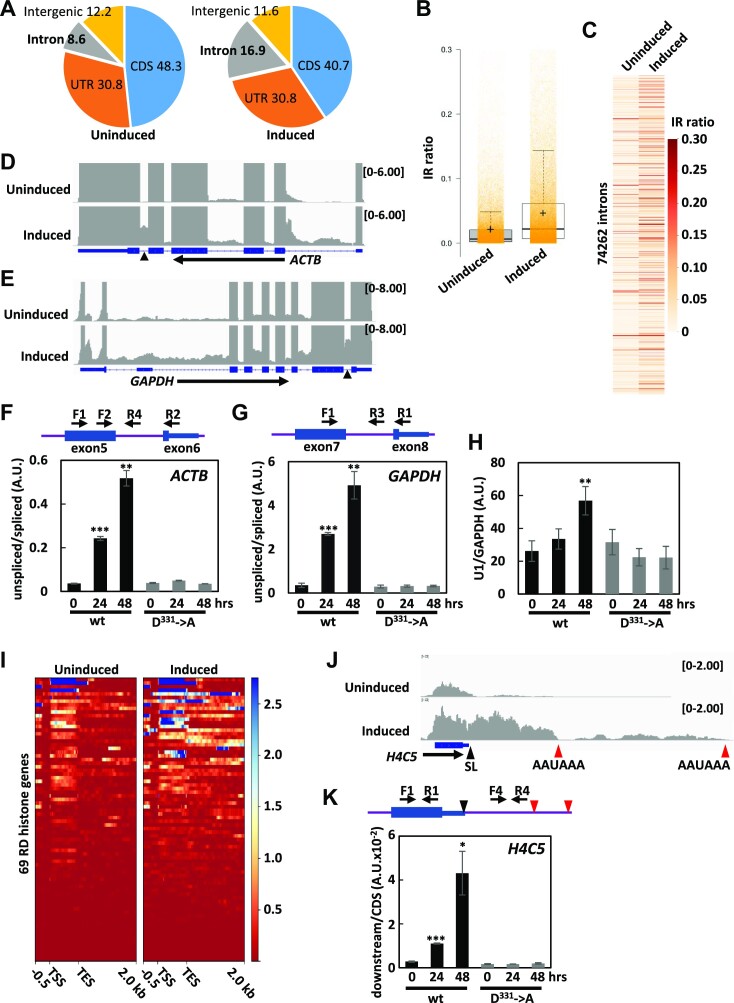
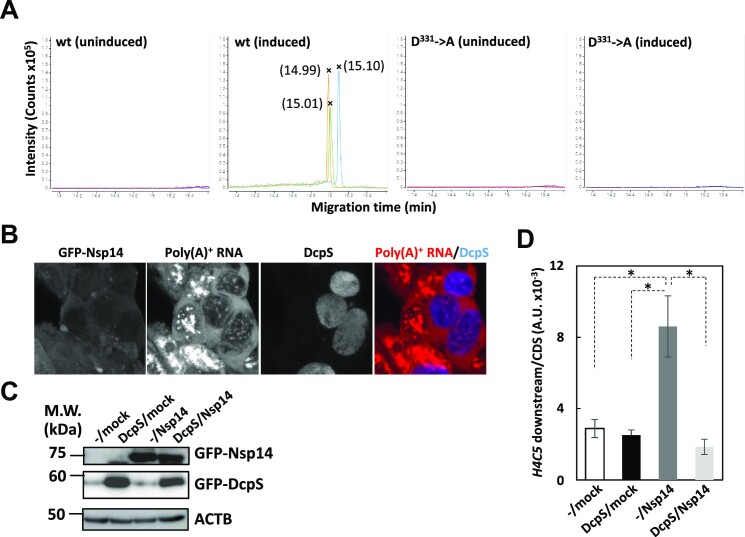
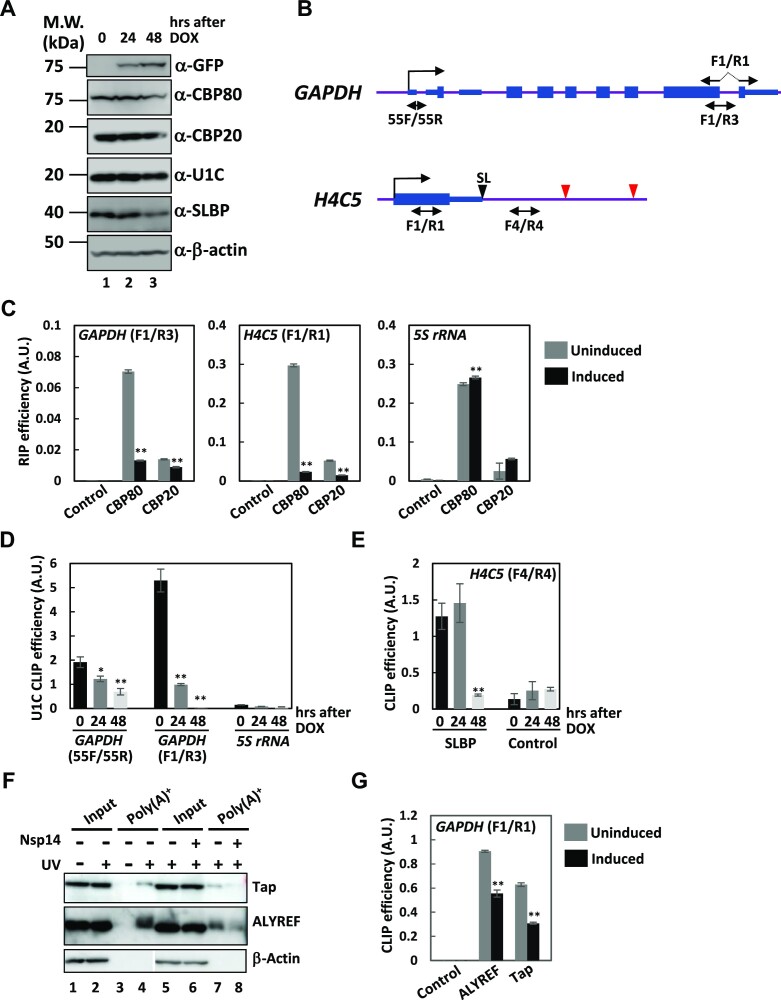
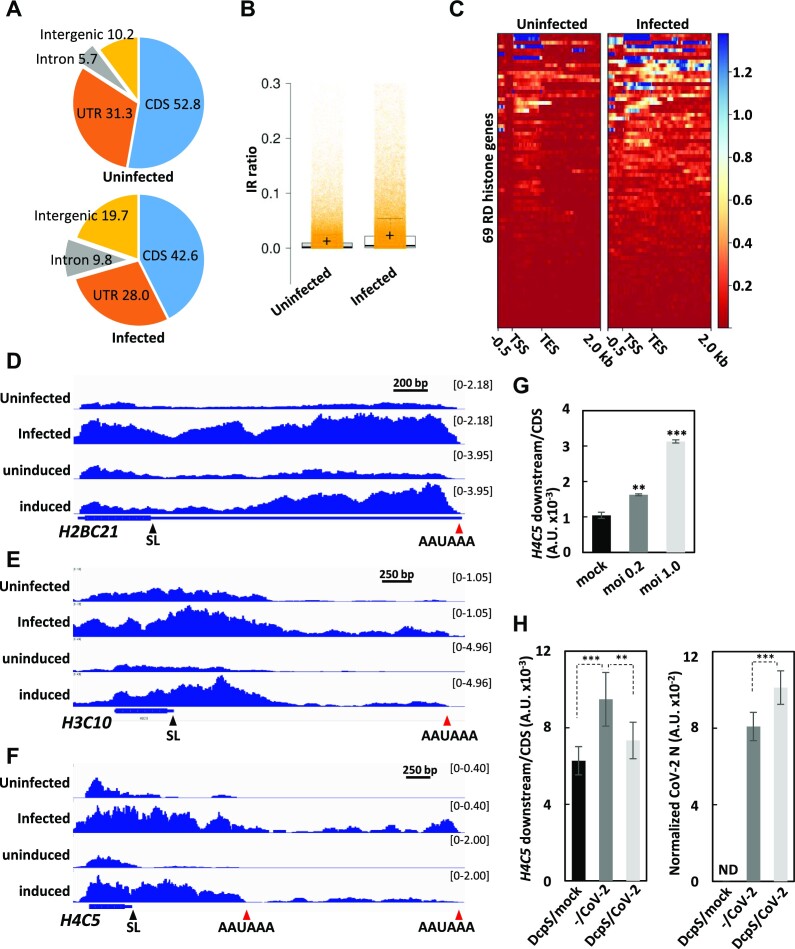
To facilitate selfish replication, viruses halt host gene expression in various ways. The nuclear export of mRNA is one such process targeted by many viruses. SARS-CoV-2, the etiological agent of severe acute respiratory syndrome, also prevents mRNA nuclear export. In this study, Nsp14, a bifunctional viral replicase subunit, was identified as a novel inhibitor of mRNA nuclear export. Nsp14 induces poly(A)+ RNA nuclear accumulation and the dissolution/coalescence of nuclear speckles. Genome-wide gene expression analysis revealed the global dysregulation of splicing and 3'-end processing defects of replication-dependent histone mRNAs by Nsp14. These abnormalities were also observed in SARS-CoV-2-infected cells. A mutation introduced at the guanine-N7-methyltransferase active site of Nsp14 diminished these inhibitory activities. Targeted capillary electrophoresis-mass spectrometry analysis (CE-MS) unveiled the production of N7-methyl-GTP in Nsp14-expressing cells. Association of the nuclear cap-binding complex (NCBC) with the mRNA cap and subsequent recruitment of U1 snRNP and the stem-loop binding protein (SLBP) were impaired by Nsp14. These data suggest that the defects in mRNA processing and export arise from the compromise of NCBC function by N7-methyl-GTP, thus exemplifying a novel viral strategy to block host gene expression.


Figures

Graphical Abstract
Graphical Abstract
Figure 1.
Figure 1.
Identification of Nsp14 as a novel mRNA export inhibitor. HeLa cells cultured on glass coverslips were transfected with plasmids encoding GFP or the indicated viral proteins tagged with Strep-tag II. At 48 h after transfection, the cells were fixed and subjected to IFA with anti-Strept-tag II antibody followed by FISH using a Cy3-labeled oligo-dT50 probe. The cell nuclei were stained with Hoechst 33342. The cells were observed by confocal microscopy. Maximum-intensity projections of a single stack (10 consecutive slices, 0.35 μm z-distance) of images are shown. NC: nontransfected control.
Figure 2.
Figure 2.
The N7-methyltransferase domain of SARS-CoV-2 Nsp14 is critical for nuclear mRNA export inhibition. (A) A ribbon diagram depicting the structure of the Nsp14 protein of SARS-CoV-2 (PDB: 7R2V). The protein consists of the N-terminal ExoN (blue) and the C-terminal N7-MTase (green) domains. The critical amino acid residues of each enzymatic activity are colored yellow and red. (B) HeLa cells were transfected with plasmids encoding GFP or GFP-fused with the wild-type and mutant Nsp14 proteins. The cells were harvested at 48 h after transfection, and whole-cell extracts prepared from each transfection were subjected to Western blotting using the indicated antibodies. (C) HeLa cells cultured on glass coverslips were transfected with plasmids encoding GFP or GFP-fused with the wild-type and mutant Nsp14 proteins. At 48 h after transfection, the cells were fixed and subjected to FISH using a Cy3-labeled oligo-dT50 probe. The cell nuclei were stained with Hoechst 33342. The cells were observed by confocal microscopy. Maximum-intensity projections of a single stack (10 consecutive slices, 0.35 μm z-distance) of images are shown. (D) HeLa cells cultured on glass coverslips were transfected with plasmids encoding GFP fused with the wild-type Nsp14 protein. At 48 h after transfection, the cells were fixed and subjected to IFA with anti-SC35 (upper) or anti-ALYREF (lower) antibodies followed by FISH using a Cy3-labeled oligo-dT50 probe. The cell nuclei were stained with Hoechst 33342. The cells were observed by confocal microscopy.
Figure 3.
Figure 3.
Establishment of DOX-inducible GFP-Nsp14 cell lines. (A) The structure of the expression plasmids. pTRE2: the modified tetracycline-response element and the CMV minimal promoter, eGFP: enhanced green fluorescent protein, BGH pA: polyadenylation signal from the bovine growth hormone gene, pUBC: the ubiquitin C promotor, rtTA3: reverse tetracycline transactivator 3, IRES: internal ribosome entry site, Neor: neomycin resistance gene, 3′-LTR: 3′-long terminal repeat of HIV. (B) 293F_Nsp14_wt2 (left panels) and 293F_Nsp14_AIG44 (right panels) cells were left untreated (uninduced) or cultured for 48 h in the presence of 2.5 μg/ml DOX (induced). Whole-cell extracts prepared from each culture were subjected to Western blotting using the indicated antibodies. (C) 293F_Nsp14_wt2 (the upper two panels) and 293F_Nsp14_AIG44 (the lower panels) cells were left untreated (the upper most panels: uninduced) or cultured for 48 h in the presence of 2.5 μg/ml DOX (the lower two panels: induced). The cells were fixed and subjected to FISH using a Cy3-labeled oligo-dT50 probe. The cell nuclei were stained with Hoechst 33342. The cells were observed by confocal microscopy. Maximum-intensity projections of a single stack (10 consecutive slices, 0.35 μm z-distance) of images are shown. (D) 293F_Nsp14_wt2 (left panels) and 293F_Nsp14_AIG44 (right panels) cells were cultured for 48 h in the presence of 2.5 μg/ml DOX. The cells were fixed and subjected to IFA using the indicated antibodies. The cell nuclei were stained with Hoechst 33342. The cells were observed by confocal microscopy. In the merged pictures, the fluorescent signals of THOC2 and SC35 were pseudocolored red and green, respectively.
Figure 4.
Figure 4.
Gene expression analysis of the Nsp14-expressing cell line. Total RNA prepared from 293F_Nsp14_wt2 cells before (uninduced) or 48 h after (induced) DOX induction was subjected to poly(A)+-RNA-seq analysis. After adaptor trimming and quality filtering of the 101 base paired-end raw reads, the passed reads were mapped to the human genome 19 (hg19) assembly. (A) Distribution of the 4.89 × 109 (uninduced) and 4.15 × 109 (induced) mapped bases on different gene features was analyzed by CollectRNAseqMetrics from gatk4-4.1.6.0–0 and shown as percentages. CDS: coding sequence, UTR: 5′- and 3′-untranslated regions. (BC) Intron retention ratios were calculated by IR finder. Overall changes in IR ratios (B) or changes at individual introns (C) are shown. In (B), the centerlines show the medians; the box limits indicate the 25th and 75th percentiles as determined by R software; the whiskers extend 1.5 times the interquartile range from the 25th and 75th percentiles; and the crosses show the means. Orange transparent dots are individual data points. (D, E) IGV view of the RNA-seq data at the ACTB and GAPDH loci. CPM-normalized RNA-seq read coverage of uninduced and induced samples is shown. (F–H) Total RNA prepared from 293F_Nsp14_wt2 and 293F_Nsp14_AIG44 cells cultured for the indicated periods in the presence of DOX was subjected to qRT−PCR analysis. The schematics shown above the graphs (F and G) are the relative positions of the PCR primers. In (F) and (G), the amounts of intron RNA were normalized to that of corresponding exon RNA. In (H), the amount of U1 snRNA was normalized to that of GAPDH. The data are presented as the means ± SDs of three biological replicates. ** and *** indicate P values <0.01 and <0.001, respectively. (I) Changes in RNA-seq read coverage at replication-dependent (RD) histone genes before (uninduced) and after (induced) Nsp14 expression. The heatmaps range from 0.5 kb upstream of the transcription start site (TSS) to 2 kb downstream of the transcription termination site (TES) of 69 RD histone genes. (J) IGV view of the RNA-seq read coverage of uninduced and induced samples at the histone H4C5 locus. CPM-normalized read coverage was calculated by DeepTools. Red vertical arrowheads indicate the positions of the polyadenylation signal, whereas the black arrowheads indicate the position of the stem−loop-dependent cleavage site. (K) Total RNA prepared from 293F_Nsp14_wt2 and 293F_Nsp14_AIG44 cells before (0 h) or 24 and 48 h after DOX induction was subjected to qRT-PCR analysis using the indicated PCR primers. The amount of downstream RNA was normalized to that of CDS RNA. The data are presented as the means ± SDs of three biological replicates. * and *** mean P value <0.05 and <0.001, respectively. The schematic shown above the graph indicates the relative positions of the PCR primers. Black and red vertical arrowheads show the positions of the SL sequence and the canonical polyadenylation signals, respectively.
Figure 5.
Figure 5.
Production of m7GTP in Nsp14-expressing cells. (A) Detection of m7GTP in extracts prepared from cells cultured under the indicated conditions using CE-MS. Each analysis was performed in triplicate. Peak migration times are shown in parentheses. (B) 293F_Nsp14_wt2 cells were transiently transfected with the FLAG-tagged DcpS expression vector. Twenty-four hours after transfection, 2.5 μg/ml DOX was added to the culture medium, and the cells were cultured for an additional 48 h. The cells were fixed and subjected to IFA using anti-FLAG M2 mAb followed by FISH using a Cy3-labeled oligo-dT50 probe. The cells were observed by confocal microscopy. Maximum intensity projections of a single stack (10 consecutive slices, 0.35 μm z-distance) of images are shown. In the merged picture, the fluorescent signals of FLAG-DcpS and poly(A)+ RNAs were pseudocolored blue and red, respectively. (CD) 293F_hACE2_DcpS_29 cells were left untreated (–) or induced by DOX for 24 h (DcpS). The cells were mock transfected (mock) or transfected with the GFP-Nsp14 expression vector (Nsp14) and cultured for an additional 48 h. (C) Whole-cell extracts were subjected to Western blotting using the indicated antibodies. (D) Total RNA was subjected to qRT-PCR analysis as in Figure 4K. The amount of downstream RNA was normalized to that of CDS RNA. The data are presented as the means ± SDs of three biological replicates. * means P value < 0.05.
Figure 6.
Figure 6.
Impairment of mRNA recognition by NCBC, SLBP, and mRNA export factors in Nsp14-expressing cells. (A) Extracts prepared from 293F_Nsp14_wt2 cells before (0 h), 24 and 48 h after DOX induction were subjected to Western blotting using the indicated antibodies. The positions of molecular weight markers are indicated on the left in kilodaltons. (B) Structures of the GAPDH and H4C5 loci. Thin and thick boxes indicate UTRs and CDSs, respectively, whereas the lines indicate introns or intergenic regions. Vertical lines with horizontal arrows indicate (major) transcription start sites. The positions of the PCR amplicons are shown below the schematics. The positions of the PCR primers used for amplification of the spliced GAPDH mRNA (F1 and R1) are shown above the schematics. Black and red arrowheads indicate the positions of the AAUAAA hexamer. Note that the schematics are not drawn to scale. (C) RIP analysis was carried out before (uninduced: gray) and 48 h after (induced: black) the induction of Nsp14. Input RNAs and RNAs copurified with anti-CBP80 and anti-CBP20 antibodies as well as control antibodies were subjected to qRT−PCR with the indicated PCR primers. RIP efficiency was calculated by dividing the amounts of RNAs immunopurified with each antibody by that of the corresponding input. The data are presented as the means ± SDs of three technical replicates. ** means P value < 0.01. (D) Whole-cell extracts prepared from UV-crosslinked 293F_Nsp14_wt2 cells induced for the indicated periods were immunoprecipitated with an anti-snRNP U1C antibody. The amounts of GAPDH pre-mRNA and 5S rRNA in the immune-pellets were divided by that in the corresponding input to calculate CLIP efficiency. Shown is a representative of three independent experiments. The data are presented as the means ± SDs of three technical replicates. * and ** indicate P values < 0.05 and < 0.01, respectively. (E) Whole-cell extracts prepared from UV-crosslinked 293F_Nsp14_wt2 cells induced for the indicated periods were immunoprecipitated with an anti-SLBP antibody. The amounts of H4C5 pre-mRNA in the immune pellets were divided by the amounts in the corresponding input to calculate CLIP efficiency. Shown is a representative of three independent experiments. The data are presented as the means ± SDs of three technical replicates. ** means P value < 0.01. (F) The parental 293F (lanes 1–4) and 293F_Nsp14_wt2 (lanes 5–8) cells treated as indicated were subjected to UV crosslinking. The UV dose was 300 mJ/cm2. Expression of Nsp14 was induced for 48 h. Poly(A)+ RNPs (Poly(A)+: lanes 3, 4, 7, 8) were purified from whole-cell extracts (input: lanes 1, 2, 5, 6) prepared from each cell culture. The samples were analyzed by Western blotting using the antibodies indicated on the right of each panel. The lowest panel is a composite of relevant areas of two separate membranes. (G) Whole-cell extracts prepared from UV-crosslinked 293F_Nsp14_wt2 cells with (induced) or without (uninduced) Nsp14 expression were immunoprecipitated with anti-ALYREF and anti-Tap as well as control antibodies. The amount of GAPDH mRNA in the immune pellet was divided by that in the corresponding input to calculate CLIP efficiency. Shown is a representative of two independent experiments. The data are presented as the means ± SDs of three technical replicates. ** means P value < 0.01.
Figure 7.
Figure 7.
Gene expression analysis of SARS-CoV-2-infected cells. (A) Distribution of the 9.48 × 109 (uninfected) and 8.49 × 109 (infected) mapped bases on different gene features was analyzed by CollectRNAseqMetrics from gatk4-4.1.6.0–0 and shown in percentages. CDS: coding sequence, UTR: 5′- and 3′-untranslated regions. (B) Intron retention ratios were calculated by IR finder. Overall changes in IR ratios are shown. The centerlines show the medians; the box limits indicate the 25th and 75th percentiles as determined by R software; the whiskers extend 1.5 times the interquartile range from the 25th and 75th percentiles; and the crosses show the means. Orange transparent dots are individual data points. (C) Changes in RNA-seq read coverage at replication-dependent (RD) histone genes before (uninfected) and after (infected) SARS-CoV-2 infection. The heatmaps range from 0.5 kb upstream of the transcription start site (TSS) to 2 kb downstream of the transcription termination site (TES) of 69 RD histone genes. (DF) IGV view of the RNA-seq data at the H2BC12, H3C10 and H4C5 loci. The CPM-normalized RNA-seq read coverage of uninfected and infected samples is shown (top two rows). As a comparison, the read coverage of control (uninduced) and Nsp14-expressing (induced) samples is also shown (bottom two rows). (G) Total RNA prepared from 293F_hACE2_21 cells infected with SARS-CoV-2 at the indicated multiplicity of infection (MOI) was subjected to qRT-PCR analysis as in Figure 4K. The amount of the downstream RNA was normalized to that of the CDS RNA. Shown is a representative of two independent experiments. The data are presented as the means ± SDs of three technical replicates. ** and *** indicate P values <0.01 and <0.001, respectively. (H) 293F_hACE2_DcpS_29 cells were left untreated (–) or induced GFP-DcpS expression by DOX for 24 h (DcpS). The cells were infected with SARS-CoV-2 at an MOI of 1.0 and cultured for another 24 h. Left: Total RNAs prepared from each culture were subjected to qRT-PCR to analyze the read-through transcription of the H4C5 locus as in Figure 4K. The data are presented as the means ± SDs of three biological replicates. ** and *** mean P values <0.01 and <0.001, respectively. Right: The amount of SARS-CoV-2 N mRNA normalized to that of GAPDH mRNA was also quantitated. The data are presented as the means ± SDs of three biological replicates. *** means P value <0.001. ND means none detected.

Similar articles

Cited by

References

    1. Köhler A., Hurt E.. Exporting RNA from the nucleus to the cytoplasm. Nat. Rev. Mol. Cell Biol. 2007; 8:761–773. - PubMed
    1. Obado S.O., Rout M.P., Field M.C.. Sending the message: specialized RNA export mechanisms in trypanosomes. Trends Parasitol. 2022; 38:854–867. - PMC - PubMed
    1. Müller-McNicoll M., Neugebauer K.M.. How cells get the message: dynamic assembly and function of mRNA-protein complexes. Nat. Rev. Genet. 2013; 14:275–287. - PubMed
    1. Meinel D.M., Sträßer K.. Co-transcriptional mRNP formation is coordinated within a molecular mRNP packaging station in S. cerevisiae. Bioessays. 2015; 37:666–677. - PMC - PubMed
    1. Katahira J. Nuclear export of messenger RNA. Genes (Basel). 2015; 6:163–184. - PMC - PubMed

Publication types

MeSH terms