. 2023 Jun 1;150(11):dev201041.
doi: 10.1242/dev.201041. Epub 2023 Jun 1.

Normal cell cycle progression requires negative regulation of E2F1 by Groucho during S phase and its relief at G2 phase

Affiliations

Normal cell cycle progression requires negative regulation of E2F1 by Groucho during S phase and its relief at G2 phase

Shaked Bar-Cohen et al. Development. .

Abstract

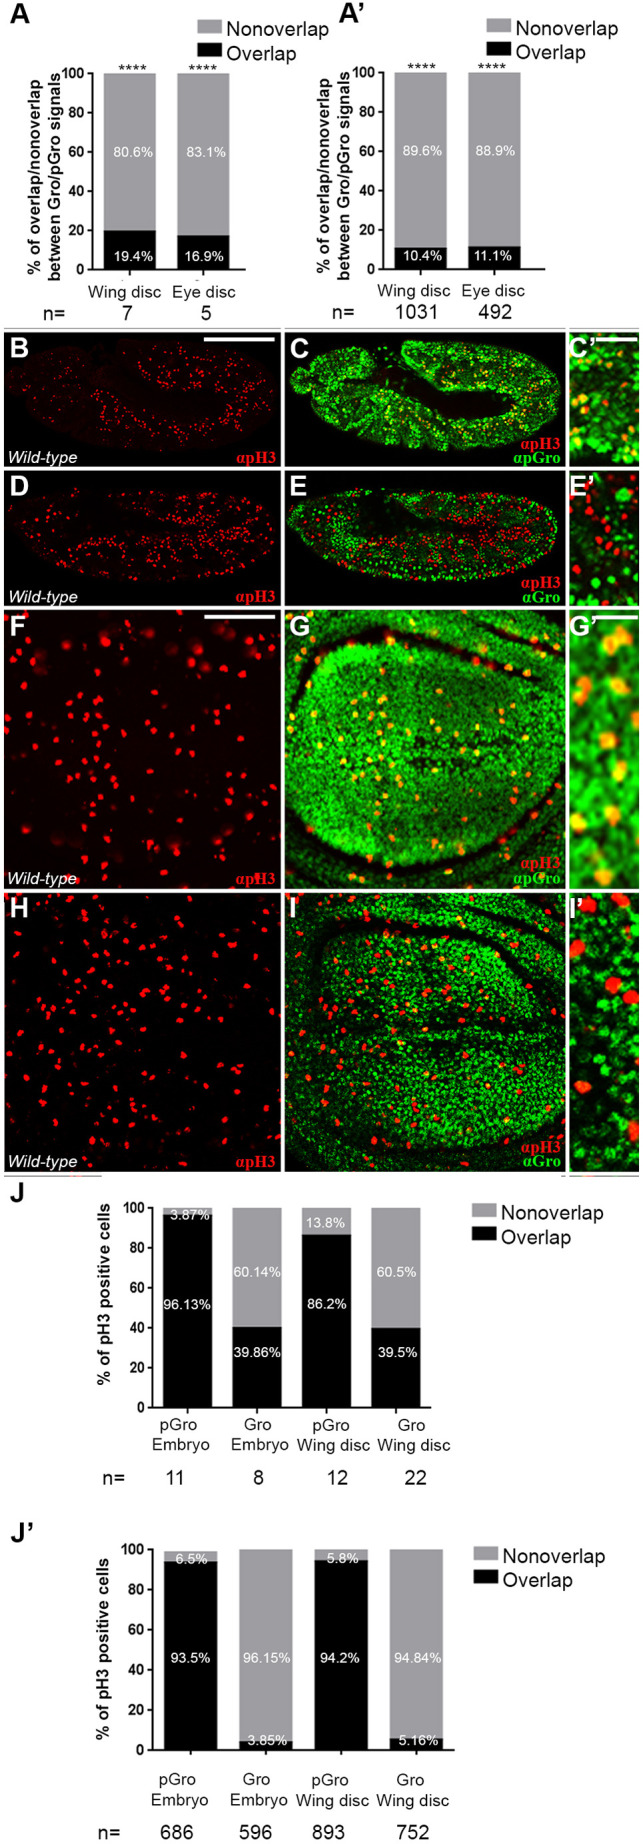
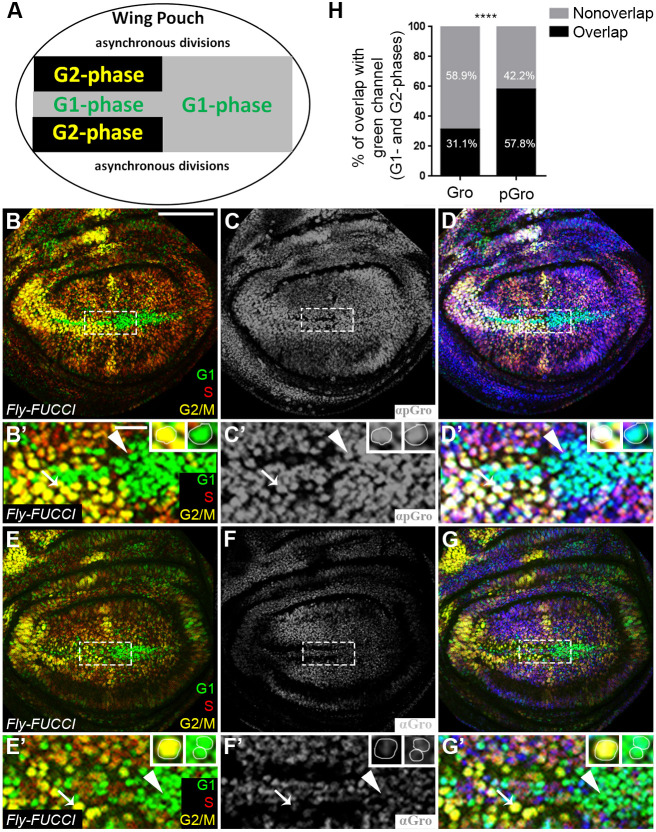
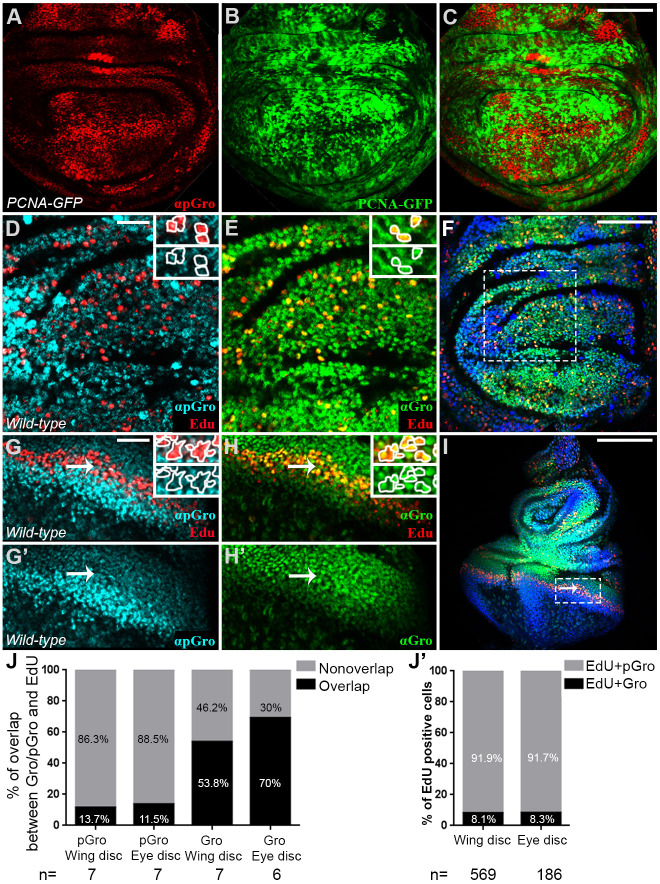
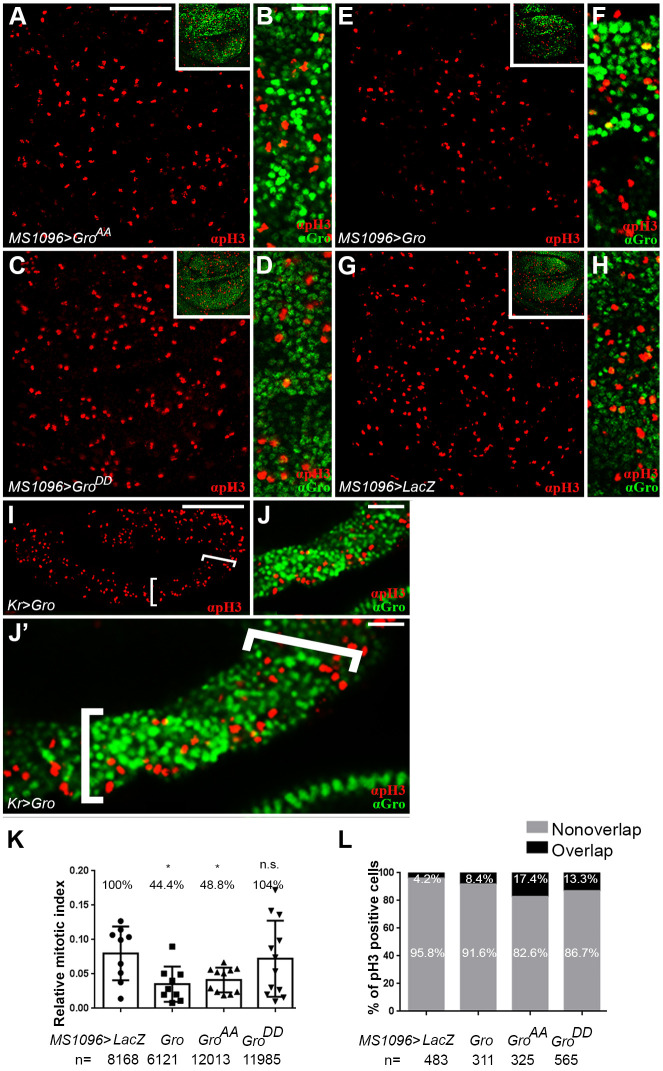
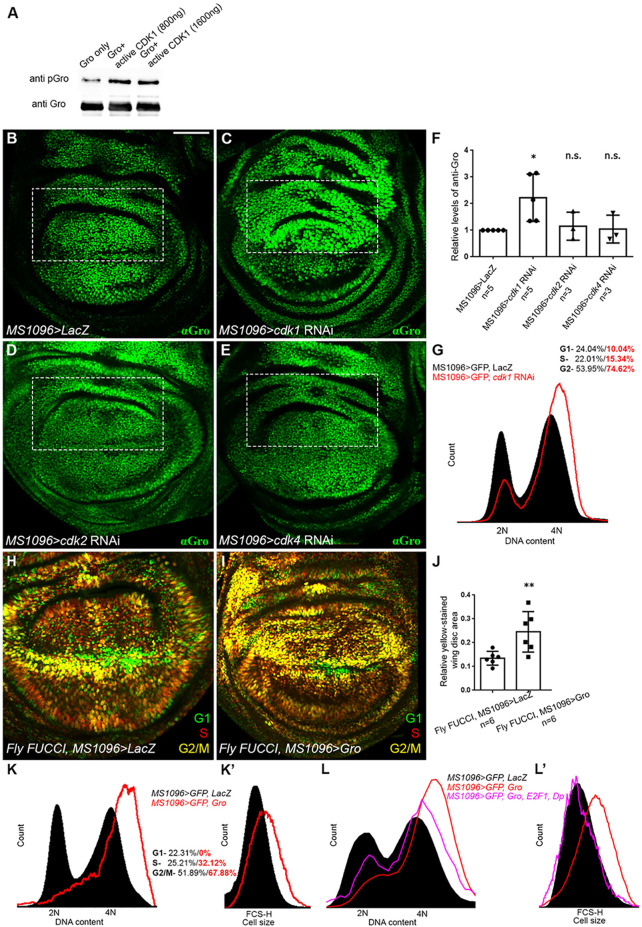
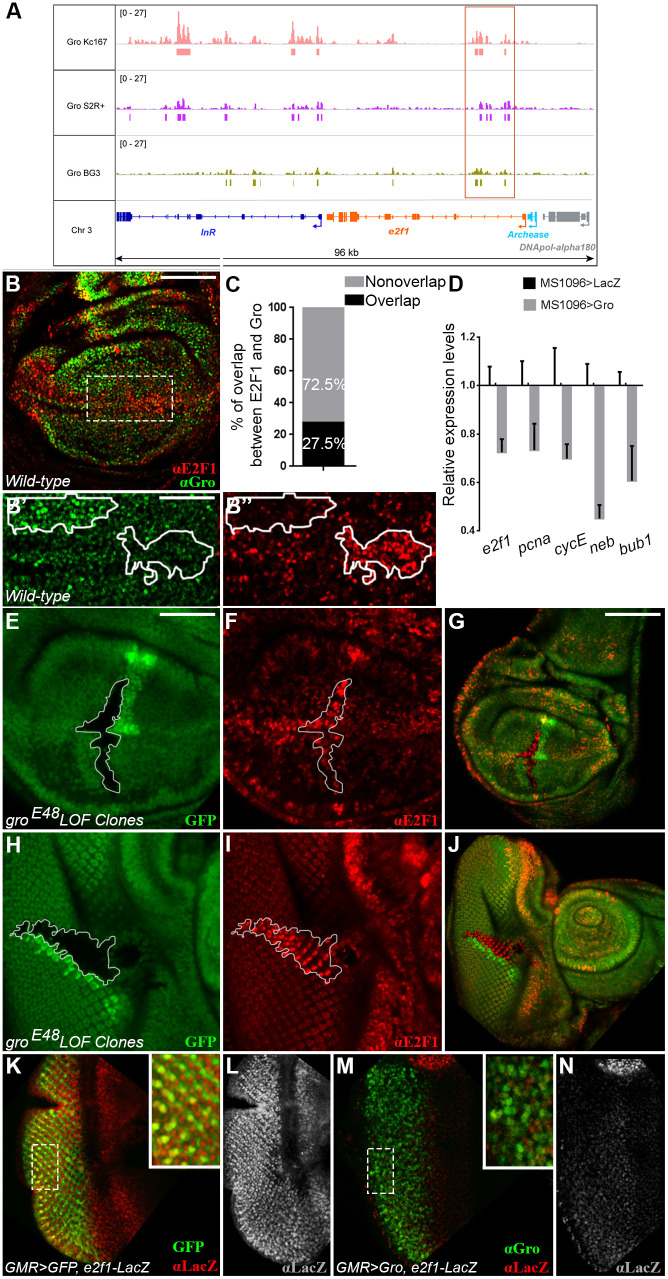
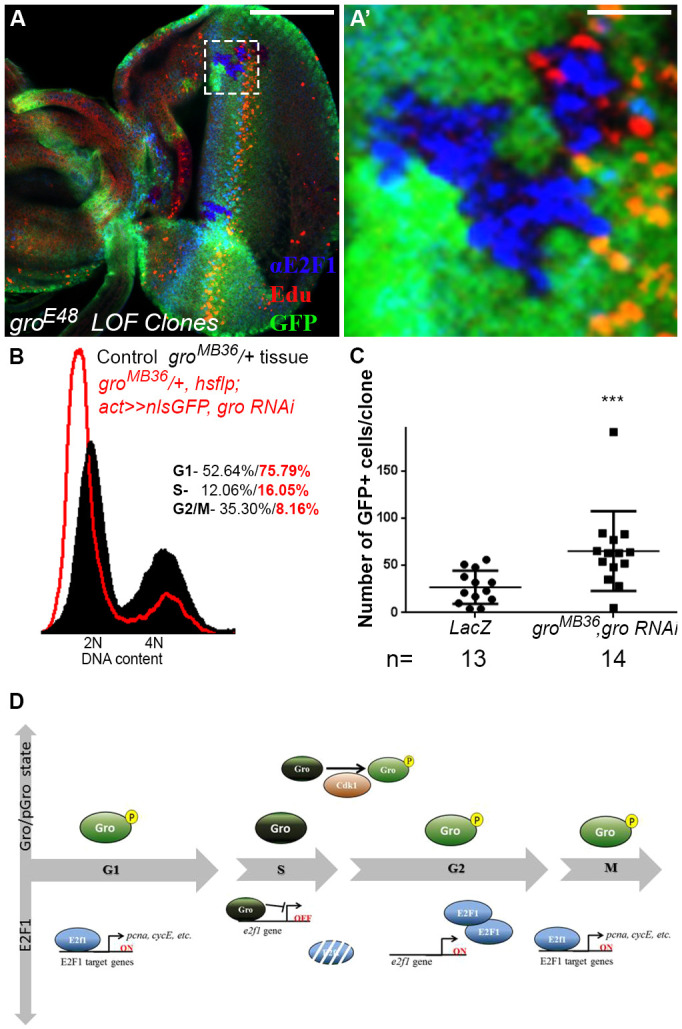
The cell cycle depends on a sequence of steps that are triggered and terminated via the synthesis and degradation of phase-specific transcripts and proteins. Although much is known about how stage-specific transcription is activated, less is understood about how inappropriate gene expression is suppressed. Here, we demonstrate that Groucho, the Drosophila orthologue of TLE1 and other related human transcriptional corepressors, regulates normal cell cycle progression in vivo. We show that, although Groucho is expressed throughout the cell cycle, its activity is selectively inactivated by phosphorylation, except in S phase when it negatively regulates E2F1. Constitutive Groucho activity, as well as its depletion and the consequent derepression of e2f1, cause cell cycle phenotypes. Our results suggest that Cdk1 contributes to phase-specific phosphorylation of Groucho in vivo. We propose that Groucho and its orthologues play a role in the metazoan cell cycle that may explain the links between TLE corepressors and several types of human cancer.

Keywords: Drosophila; Cell cycle regulation; E2F1; Groucho; Protein phosphorylation; Repression.


Conflict of interest statement

Competing interests The authors declare no competing or financial interests.

Figures

Fig. 1.
Fig. 1.
Groucho is primarily phosphorylated in pH3-positive mitotic cells. (A,A′) Quantification of the percentage of area (semi-automated; A) and the proportion of nuclei (manually scored; A′), co-stained (black) or not (grey) for both pGro and Gro in wing and eye imaginal discs (Fig. S1). (A) n=number of wing or eye imaginal discs scored in each case. (A′) n=number of nuclei scored in each case. ****P<0.0001 (binomial test, based on previous studies showing that these signals do not overlap in the embryo). (B-I′) Confocal images of stage 11 wild-type embryos (lateral views; B-E′) and wing imaginal discs from wild-type third instar wandering larvae (F-I′), co-stained for pH3 (red; B-I′) together with either pGro (green; C,C′,G,G′) or Gro (green; E,E′,I,I′). (C′,E′,G′,I′) Magnified views of C,E,G and I, respectively. (J,J′) Quantification of the percentage of pH3-positive area (semi-automated; J), and of the percentage of pH3-positive nuclei (manually scored; J′), co-stained (black) or not (grey) for pGro or for Gro, in embryos (two left columns) and in wing imaginal discs (two right columns). (J) n=number of embryos or wing imaginal discs scored in each case. (J′) n=number of pH3-positive cells scored in each case. Scale bars: 100 µm (B-I); 16.6 µm (C′,E′,G′,I′).
Fig. 2.
Fig. 2.
Groucho is phosphorylated during G1 , G2 and M phases. (A) Schematic representation of the central part of the wing imaginal disc (area boxed in B-G) (adapted from Zielke et al., 2014). In this region, a stripe of anterior cells that are arrested at the G1 phase (grey) are flanked by cells arrested at the G2 phase (black), and cells in the posterior domain are arrested at G1 phase. (B-G′) Confocal images of Fly-FUCCI third instar wandering larval wing imaginal discs, stained for pGro (grey in C,C′; blue in D,D′) or for Gro (grey in F,F′; blue in G,G′). In this system, the S-phase cell population is in red, cells at G2/M phases are stained yellow and those at the G1 phase are in green (B,B′,D-E′,G,G′). (B′,C′,D′,E′,F′,G′) Magnified views of the central (boxed) region of the wing imaginal disc blade shown in B,C,D,E,F,G, respectively. Insets in panels of magnified views show representative cells either in G2/M phase (yellow; left) or in G1 phase (green; right). Note that pGro staining is evident in G2/M-phase nuclei, as well as in cells at G1 phase (arrow and arrowhead, respectively, in B′,C′,D′), but that of Gro is undetectable in these cells (arrow and arrowhead in E′,F′,G′, respectively). The red S-phase marker alone was not analysed due to intensity ambiguity. (H) Semi-automated quantification of the percentage of the area covered by cells in G1 and G2 phases (green), co-stained (black) or not (grey) with anti-Gro (left) or with anti-pGro (right) in wing imaginal discs. Nine discs were quantified for pGro and ten for Gro. ****P<0.0001 (two-tailed t-test). Scale bars: 100 µm (B-G); 16.6 µm (B′-G′).
Fig. 3.
Fig. 3.
Groucho is unphosphorylated during S phase. (A-C) Confocal image of a PCNA-GFP third instar wandering larval wing imaginal disc, stained for pGro (red; A,C). Cells in S phase are GFP-positive (green; B,C). (D-I) Confocal images of third instar wild-type wandering larval wing (D-F) and eye (G-I) imaginal discs, stained for pGro (turquoise in D,G,G′; blue in F,I), Gro (green; E,F,H-I) and EdU (red; D-I). (D,E,G-H′) Magnified views of the boxed regions in F and I, respectively. Arrows (G-I) point at the stripe of EdU-positive, S-phase cells posterior to the morphogenetic furrow. Insets in (D,E,G,H) show magnified views of individual cells stained either for pGro and EdU (D,G) or for Gro and EdU (E,H). (J) Semi-automated quantification of the percentage of EdU-positive area, co-stained (black) or not (grey) for pGro or for Gro in wing imaginal discs (two left columns) and in eye imaginal discs (two right columns). n=number of imaginal discs scored in each case. (J′) Percentage of manually scored EdU-positive nuclei, co-stained for Gro (black) or for pGro (grey) in wing and eye imaginal discs. n=number of EdU-positive cells scored in each case. Scale bars: 100 µm (A-C,F); 33.3 µm (D,E,G-H′); 200 µm (I).
Fig. 4.
Fig. 4.
Ectopic expression of Groucho reduces the number of pH3-positive cells. (A-J′) Confocal images of wing imaginal discs (A-H) and stage 11 embryo (lateral view; I-J′), ectopically expressing non-phosphorylatable Gro (GroAA; A,B), phosphomimetic Gro (GroDD; C,D) or native Gro (E,F,I-J′). (G,H) lacZ-expressing control. Embryos and imaginal discs were co-stained for pH3 (red; A-J′) and for Gro (green; B,D,F,H,J,J′). (I,J′) The Kr>Gal4 expression domain is delineated by brackets. (B,D,F,H,J,J′) Magnified views of cells in panels A,C,E,G,I, respectively. Insets in A,C,E,G show that ectopic expression of either GroAA (A) or Gro (E) masks the detection of endogenous Gro by the anti-Gro antibody, and that this anti-Gro antibody does not recognise ectopically-expressed GroDD (C) due to its specificity towards unphosphorylated Gro. Hence, endogenous Gro is only observed in discs expressing GroDD (C) or lacZ (G) (Fig. S3; Materials and Methods). (B,F,J,J′) Patchy Gal4-driven expression leads to uneven Gro protein levels (Fig. S3). (K) Graph showing relative mitotic indices, quantified based on the ratio of pH3-positive cells relative to the number of total nuclei marked by DAPI staining. Each dot in the graph represents the relative mitotic index measured in a single wing imaginal disc (nine discs were analysed for lacZ, nine for Gro, 11 for GroAA and 12 for GroDD). n=number of nuclei scored in each case. *P<0.05 mitotic indices of Gro and GroAA compared with that of lacZ (Mann–Whitney U-test). The mitotic index of GroDD compared with that of lacZ is non-significant (n.s.). In all cases, data represent the mean±s.d. The calculated mitotic index in each case is presented as percentage relative to the lacZ index (given a value of 100%). (L) Percentage of pH3-positive nuclei, coinciding (black) or not (grey) with Gro staining in the indicated wing imaginal discs. n=number of pH3-positive cells scored in each case. Scale bars: 100 µm (A,C,E,G,I); 16.6 µm (B,D,F,H); 50 µm (J); 33.3 µm (J′).
Fig. 5.
Fig. 5.
Cells accumulate at G2 phase upon ectopic expression of Groucho. (A) An activated Cdk1/CycB complex phosphorylates GST-tagged, full-length Gro in vitro. Three independent kinase assays resulted in similar outcomes. (B-F) Cdk1 phosphorylates Groucho in vivo. (B-E) Confocal images of third instar wandering larval wing imaginal discs expressing either lacZ (B) or RNAi constructs for cdk1 (C), cdk2 (D) or cdk4 (E), stained for Gro (green). Two RNAi lines, targeting each Cdk, produced similar outcomes. The boxed regions demarcate the predominantly dorsal expression domain of the MS1096-Gal4 driver (Fig. S3). Note that RNAi-based knockdown of cdk1 (C), but not of cdk2 (D) or cdk4 (E), leads to the accumulation of unphosphorylated Gro (see lacZ-expressing disc; B). (F) Graph showing relative Gro protein levels determined by western blot analyses of whole wing imaginal disc lysates from the indicated genetic backgrounds, immunoblotted with anti-Gro and anti-Actin antibodies. Relative Gro levels were determined based on the ratio between Gro and Actin, normalised to that in lacZ-expressing controls. The fold increase in the level of unphosphorylated Gro upon cdk1 knockdown (2.222±0.3975) is not observed in cdk2 or cdk4 knockdowns (1.152±0.3023 and 1.045±0.3030, respectively); *P<0.05 for cdk1 RNAi compared with lacZ control; non-significant (n.s.) for cdk2 and cdk4 RNAi compared with lacZ control (Mann–Whitney U-test). n=number of biological repeats conducted for each genotype. In all cases, data represent the mean±s.d. The increase in the level of unphosphorylated Gro following cdk1 knockdown is probably a gross underestimate, given that MS1096-Gal4 drives non-uniform expression in only a subset of cells in the wing imaginal disc (Fig. S3). (G) Cell cycle distribution of GFP-positive cells, dissociated from larval wing imaginal discs co-expressing either GFP together with lacZ (black) or along with cdk1 RNAi (red contour) under the MS1096-Gal4 driver. DNA content was determined using Hoechst 33342 and normalised to number of events. (H,I) Confocal images of wing imaginal discs, dissected from Fly-FUCCI third instar wandering larvae expressing either lacZ (H) or Gro (I) under MS1096-Gal4 regulation. (J) The enrichment of yellow-stained, G2/M-phase cells following Gro overexpression, relative to lacZ-expressing controls, was quantified by delimiting the wing pouch regions and then measuring levels of yellow colour coverage (restricted to the yellow channel; Adobe Photoshop) in the selected area using ImageJ. Graph shows the relative area of yellow-stained Fly-FUCCI cells in lacZ- (left) or Gro-expressing (right) wing imaginal discs, under the regulation of MS1096 driver. n=number of wing discs scored in each case. **P<0.01 (Mann–Whitney U-test). In all cases, data represent the mean±s.d. (K,K′) Flow cytometric analyses of GFP-positive cells, dissociated from wing imaginal discs of flies expressing GFP together with lacZ (black) or GFP along with Gro (red contour), under the regulation of the MS1096-Gal4 driver. The DNA content was determined using Hoechst 33342 and normalised to number of events. (K) Cell cycle distribution of GFP-positive lacZ-expressing cells or of GFP-positive Gro-expressing cells is depicted as percentages in black and red, respectively. The number of cells at G2/M phases, following Gro misexpression, increases. (K′) Forward scatter-height (FSC-H) from the same experiment, showing that the relative cell size in the Gro-expressing population (red contour) is generally larger than that of cells in the control population (black). (L,L′) Cell cycle distribution (L) and FSC-H reflecting cell size (L′) of GFP-positive cells, dissociated from larval wing imaginal discs co-expressing either GFP together with lacZ (black); GFP together with Gro alone (red contour); or GFP together with Gro, E2F1 and Dp (pink contour) under the MS1096-Gal4 driver. DNA content was determined using Hoechst 33342 and normalised to number of events. Scale bar: 100 µm (B-E,H,I).
Fig. 6.
Fig. 6.
Groucho represses e2f1 expression. (A) Gro binds in shared clusters within (boxed) and downstream of the e2f1 gene locus in three Drosophila cell lines, derived from different origins. Panel shows Genome Browser view of ChIP-seq data analyses depicting the profiles of Gro binding in Kc167, S2R+ and BG3 cells. ChIP-seq signals are quantified as counts per million. Significant peaks of Gro binding are marked as bars under the ChIP-seq tracks in each cell line (typically FDR≤10%; Materials and Methods). (B-B″) Confocal image of wild-type third instar wandering larval wing imaginal disc, co-stained for E2F1 (red) and Gro (green). B′ and B″ show magnified views of the boxed region in B. (C) Semi-automated quantification of the percentage of area co-stained for E2F1 and Gro in 12 wing imaginal discs. (D) RT-PCR analyses of mRNA extracted from third instar wandering larval wing imaginal discs expressing either Gro (grey) or lacZ (black) under MS1096-Gal4 regulation. Relative transcript levels of e2f1 and its targets pcna, cycE, neb and bub1 are reduced in Gro-expressing discs, normalised to lacZ controls. Gro does not bind in proximity to the pcna and cycE loci, and neb and bub1 each appears in a single gene set; therefore, Gro probably affects their expression levels indirectly, via repression of e2f1. The ∼30% reduction in e2f1 levels is probably an underestimation, given the mosaic expression driven by MS1096>Gal4 (Fig. S3). Data represent the mean±s.d. (E-J) Homozygous groE48 loss-of-function clones (demarcated by white contours in E,F,H,I), discernible as GFP-negative and accompanied by GFP-positive twin spot clones (green; E,G,H,J), were induced in larval wing (E-G) and eye (H-J) imaginal discs. E,F,H and I show magnified views of clones in G and J, respectively. E2F1 (red; F,G,I,J) is derepressed and ectopically accumulates in gro mutant clones. (K-N) Confocal images of third instar wandering larval eye imaginal discs, in which GMR-Gal4 drives the expression of either GFP (green; K) or of Gro (green; M), co-stained for e2f1-lacZ reporter expression (lacZ; red in K,M; grey in L,N). Insets show magnified views of the boxed regions in K and M, respectively. (K) GMR-Gal4 drives expression of GFP (green) in differentiating retinal neurons (Yeates et al., 2019). These cells also express the lacZ reporter gene (red) derived from the e2f1-lacZ enhancer trap. (M) Gro expression causes an overall reduction in anti-lacZ staining (red), particularly in the retinal neuronal cells overexpressing Gro (green). Scale bars: 100 µm (B,E,F,K-N); 50 µm (B′,B″,H,I); 200 µm (G,J).
Fig. 7.
Fig. 7.
Cells devoid of groucho undergo accelerated cell cycles and accumulate at G1 phase. (A,A′) Confocal images of third instar wandering larval eye imaginal disc, stained for E2F1 (blue) and EdU (red). gro clones are detectable by lack of GFP staining and by adjacent GFP-positive twin spot clones (green). A′ shows magnification of boxed region in A, focusing on a gro mutant clone overlapping the morphogenetic furrow. Strikingly, all gro mutant cells that accumulate E2F1 do not stain for EdU and are, therefore, not in S phase. (B) Flow cytometric analyses of dissociated cells from eye imaginal discs. groMB36/+ cells expressing gro RNAi are labelled with GFP (red contour), whereas groMB36/+ cells that do not express gro RNAi are GFP-negative (black). The DNA content was determined using Hoechst 33342, and normalised to number of events. The cell cycle distribution of GFP-positive cells in which gro was downregulated, or of the remaining GFP-negative cells, is depicted as percentages in red and black, respectively. Note the increased number of cells at G1 phase following Gro downregulation. (C) Graph representing the number of GFP-positive cells per clone, in lacZ-expressing (left) as well as in groMB36/+ cells expressing gro RNAi (right) clones, under the regulation of hsflp;actin>CD2>nlsGFP driver. RNAi-based reduction in Gro levels results in bigger clones, indicative of rapid cell cycles. n=number of clones analysed in each case. ***P<0.001 (Mann–Whitney U-test). In all cases, data represent the mean±s.d. (D) Schematic model depicting how phosphorylation and dephosphorylation of Gro during the cell cycle restrict its negative regulation of E2F1 to the S phase (see text for details). Scale bars: 100 µm (A); 16.6 µm (A′).

References

    1. Asano, M., Nevins, J. R. and Wharton, R. P. (1996). Ectopic E2F expression induces S phase and apoptosis in Drosophila imaginal discs. Genes Dev. 10, 1422-1432. 10.1101/gad.10.11.1422 - DOI - PubMed
    1. Barth, J. M. I., Hafen, E. and Köhler, K. (2012). The lack of autophagy triggers precocious activation of Notch signaling during Drosophila oogenesis. BMC Dev. Biol. 12, 35. 10.1186/1471-213X-12-35 - DOI - PMC - PubMed
    1. Becker, K., Bluhm, A., Casas-Vila, N., Dinges, N., Dejung, M., Sayols, S., Kreutz, C., Roignant, J.-Y., Butter, F. and Legewie, S. (2018). Quantifying post-transcriptional regulation in the development of Drosophila melanogaster . Nat. Commun. 9, 4970. 10.1038/s41467-018-07455-9 - DOI - PMC - PubMed
    1. Bennett, J. D., Farlie, P. G. and Watson, R. J. (1996). E2F binding is required but not sufficient for repression of B-myb transcription in quiescent fibroblasts. Oncogene 13, 1073-1082. - PubMed
    1. Bettencourt-Dias, M., Giet, R., Sinka, R., Mazumdar, A., Lock, W. G., Balloux, F., Zafiropoulos, P. J., Yamaguchi, S., Winter, S., Carthew, R. W.et al. (2004). Genome-wide survey of protein kinases required for cell cycle progression. Nature 432, 980-987. 10.1038/nature03160 - DOI - PubMed

Publication types

MeSH terms

LinkOut - more resources