. 2023 Aug 7;32(16):2600-2610.
doi: 10.1093/hmg/ddad091.

Continuous, but not intermittent, regimens of hypoxia prevent and reverse ataxia in a murine model of Friedreich's ataxia

Affiliations

Continuous, but not intermittent, regimens of hypoxia prevent and reverse ataxia in a murine model of Friedreich's ataxia

Tslil Ast et al. Hum Mol Genet. .

Abstract

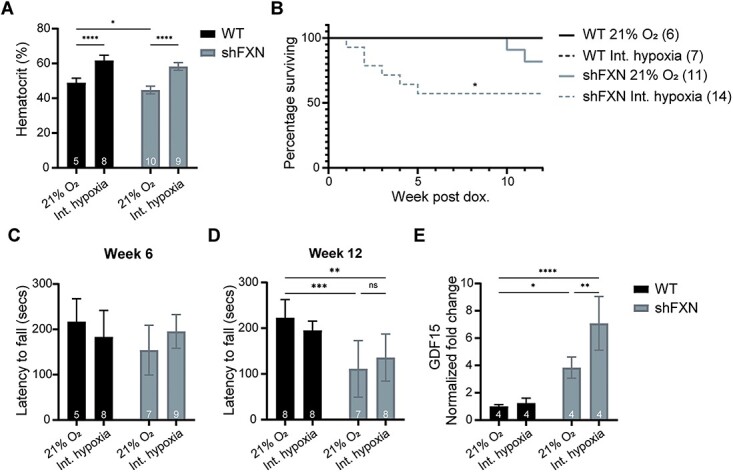
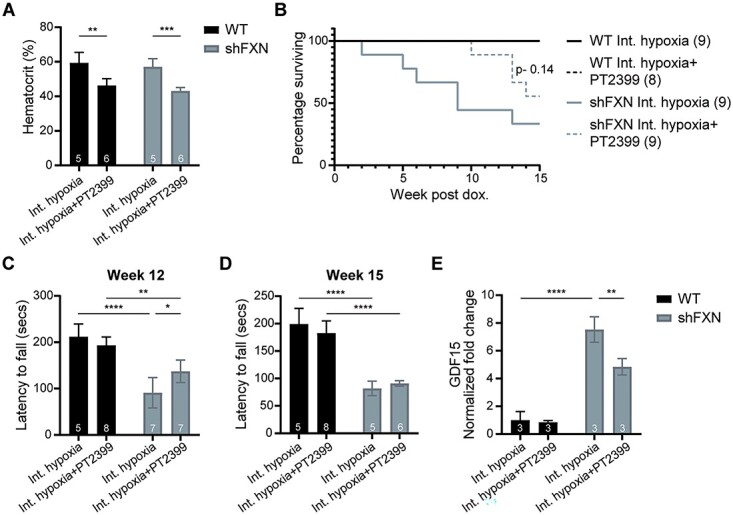
Friedreich's ataxia (FA) is a devastating, multi-systemic neurodegenerative disease affecting thousands of people worldwide. We previously reported that oxygen is a key environmental variable that can modify FA pathogenesis. In particular, we showed that chronic, continuous normobaric hypoxia (11% FIO2) prevents ataxia and neurological disease in a murine model of FA, although it did not improve cardiovascular pathology or lifespan. Here, we report the pre-clinical evaluation of seven 'hypoxia-inspired' regimens in the shFxn mouse model of FA, with the long-term goal of designing a safe, practical and effective regimen for clinical translation. We report three chief results. First, a daily, intermittent hypoxia regimen (16 h 11% O2/8 h 21% O2) conferred no benefit and was in fact harmful, resulting in elevated cardiac stress and accelerated mortality. The detrimental effect of this regimen is likely owing to transient tissue hyperoxia that results when daily exposure to 21% O2 combines with chronic polycythemia, as we could blunt this toxicity by pharmacologically inhibiting polycythemia. Second, we report that more mild regimens of chronic hypoxia (17% O2) confer a modest benefit by delaying the onset of ataxia. Third, excitingly, we show that initiating chronic, continuous 11% O2 breathing once advanced neurological disease has already started can rapidly reverse ataxia. Our studies showcase both the promise and limitations of candidate hypoxia-inspired regimens for FA and underscore the need for additional pre-clinical optimization before future translation into humans.


Figures

Figure 1
Figure 1
Intermittent hypoxia does not prevent ataxia, shortens lifespan and exacerbates cardiac ISR activation. (A) Hematocrit measurements from WT and shFxn mice housed in 21% O2 or intermittent 11% O2 for 5 weeks. (B) Survival of WT or shFxn mice housed in 21% O2 or intermittent 11% O2. (C, D) Accelerating rotarod analysis for WT or shFxn mice housed in 21% O2 or intermittent 11% O2 at 6 and 12 weeks. Latency to fall measured as mean value of triplicate trials per mouse E. Cardiac Gdf15 mRNA levels at 12 weeks, normalized to Tbp and 21% O2 WT mice. All bar plots show mean ± SD. Numbers represent group sizes. * = P < 0.05, ** = P < 0.01, *** = P < 0.001, **** = P < 0.0001. Two-way ANOVA with Bonferroni’s post-test.
Figure 2
Figure 2
Blunting the polycythemic response prevents the detrimental effects of intermittent hypoxia. (A) Hematocrit measurements from WT and shFxn mice housed in intermittent 11% O2 with or without daily dosing of PT2399 for 5 weeks. (B) Survival of WT or shFxn mice housed at intermittent 11% O2 with or without PT2399 treatment. (C, D) Accelerating rotarod analysis for WT or shFxn mice housed at intermittent 11% O2 with or without PT2399 treatment at 12 and 15 weeks. Latency to fall measured as mean value of triplicate trials per mouse. (E) Cardiac Gdf15 mRNA levels at 12 weeks, normalized to Tbp and WT mice housed at intermittent 11% O2.All bar plots show mean ± SD. Numbers represent group sizes. * = P < 0.05, ** = P < 0.01, *** = P < 0.001, **** = P < 0.0001. Two-way ANOVA with Bonferroni’s post-test.
Figure 3
Figure 3
Mild, chronic hypoxia (17% O2) prevents ataxia at early timepoints. (A) Hematocrit measurements from WT and shFxn mice housed in 21% O2 or 17% O2 for 6 weeks. (B) Survival of WT or shFxn mice housed in 21% O2 or 17% O2. (C, D) Accelerating rotarod analysis for WT or shFxn mice housed in 21% O2 or 17% O2 at 12 and 15 weeks. Latency to fall measured as mean value of triplicate trials per mouse. (E) Cardiac Gdf15 mRNA levels at 12 weeks, normalized to Tbp and 21% O2 WT mice. All bar plots show mean ± SD. Numbers represent group sizes. * = P < 0.05, ** = P < 0.01, *** = P < 0.001, **** = P < 0.0001. Two-way ANOVA with Bonferroni’s post-test.
Figure 4
Figure 4
Blunting the polycythemic response upon mild chronic hypoxia (17% O2) prevents ataxia at early timepoints but does not result in additional benefits. (A) Hemoglobin measurements of shFxn mice housed in 21% O2 or 17% O2 with or without PT2399 treatment for 5 weeks. (B) Survival of shFxn mice housed in 21% O2 or 17% O2 with or without PT2399 treatment. (C, D) Accelerating rotarod analysis for shFxn mice housed in 21% O2 or 17% O2 with or without PT2399 treatment at 12 and 15 weeks. Latency to fall measured as mean value of triplicate trials per mouse. (E) Cardiac Gdf15 mRNA levels at 12 weeks, normalized to Tbp and 21% O2shFxn mice. All bar plots show mean ± SD. Numbers represent group sizes. * = P < 0.05, ** = P < 0.01, *** = P < 0.001, **** = P < 0.0001. Two-way ANOVA with Bonferroni’s post-test.
Figure 5
Figure 5
Chronic anemia neither blunts ataxia nor improves lifespan. (A) Hemoglobin measurements of WT or shFxn mice following serial phlebotomy every 2 to 3 days for 21 days, in combination with an Fe-deficient diet. (B) Brain PO2 (vestibular nuclei) of WT or shFxn mice that are untreated or made anemic using phlebotomy, in combination with an Fe-deficient diet. (C) Survival of untreated or anemic WT and shFxn mice. (D, E) Accelerating rotarod and untreated or anemic WT and shFxn mice at 12 and 15 weeks. Latency to fall measured as mean value of triplicate trials per mouse. (F) Cardiac Gdf15 mRNA levels at 13 weeks, normalized to Tbp and untreated WT mice. All bar plots show mean ± SD. Numbers represent group sizes. * = P < 0.05, ** = P < 0.01, *** = P < 0.001, **** = P < 0.0001. Two-way ANOVA with Bonferroni’s post-test.
Figure 6
Figure 6
Genetic ablation of hepcidin reduces the lifespan and exacerbates the cardiac stress of shFxn mice. (A) Survival of single or double KO mice. (B) Accelerating rotarod analysis for single or double KO mice at 7 weeks. Latency to fall measured as mean value of triplicate trials per mouse. (C) Cardiac Gdf15 mRNA levels at 6–7 weeks, normalized to Tbp and WT mice. (D) Echocardiogram measurement of left ventricular internal diameter at end-systole from single or double KO mice (16). (E) Echocardiogram measurement of cardiac output from single or double KO mice. All bar plots show mean ± SD. Numbers represent group sizes. * = P < 0.05, ** = P < 0.01, *** = P < 0.001, **** = P < 0.0001. Two-way ANOVA with Bonferroni’s post-test.
Figure 7
Figure 7
Initiating chronic, continuous 11% O2 breathing in late-stage disease can rapidly reverse ataxia. (A) Hematocrit measurements from WT and shFxn mice housed in 21% O2 or 11% O2 for 3 weeks, following 12 weeks of doxycycline treatment. (B) Survival of WT or shFxn mice housed in 21% O2 or 11% O2. (C, D) Accelerating rotarod analysis for WT or shFxn mice upon doxycycline removal or hypoxia treatment at 15 and 18 weeks. Latency to fall measured as mean value of triplicate trials per mouse. (E) Cardiac Gdf15 mRNA levels at 19 weeks, normalized to Tbp and 21% O2 WT mice. All bar plots show mean ± SD. Numbers represent group sizes. * = P < 0.05, ** = P < 0.01, *** = P < 0.001, **** = P < 0.0001. Two-way ANOVA with Bonferroni’s post-test.

References

    1. Keita, M., McIntyre, K., Rodden, L.N., Schadt, K. and Lynch, D.R. (2022) Friedreich ataxia: clinical features and new developments. Neurodegener. Dis. Manag, 12, 267–283. - PMC - PubMed
    1. Koeppen, A.H. (2011) Friedreich’s ataxia: pathology, pathogenesis, and molecular genetics. J. Neurol. Sci., 303, 1–12. - PMC - PubMed
    1. Pandolfo, M. (2012) Friedreich ataxia. Handb. Clin. Neurol., 103, 275–294. - PubMed
    1. Harding, A.E. (1981) Friedreich’s ataxia: a clinical and genetic study of 90 families with an analysis of early diagnostic criteria and intrafamilial clustering of clinical features. Brain, 104, 589–620. - PubMed
    1. Tsou, A.Y., Paulsen, E.K., Lagedrost, S.J., Perlman, S.L., Mathews, K.D., Wilmot, G.R., Ravina, B., Koeppen, A.H. and Lynch, D.R. (2011) Mortality in Friedreich ataxia. J. Neurol. Sci., 307, 46–49. - PubMed

Publication types