

3D printing of PLA:CaP:GO scaffolds for bone tissue applications
- PMID: 37260570
- PMCID: PMC10227527
- DOI: 10.1039/d3ra00981e
3D printing of PLA:CaP:GO scaffolds for bone tissue applications
Abstract
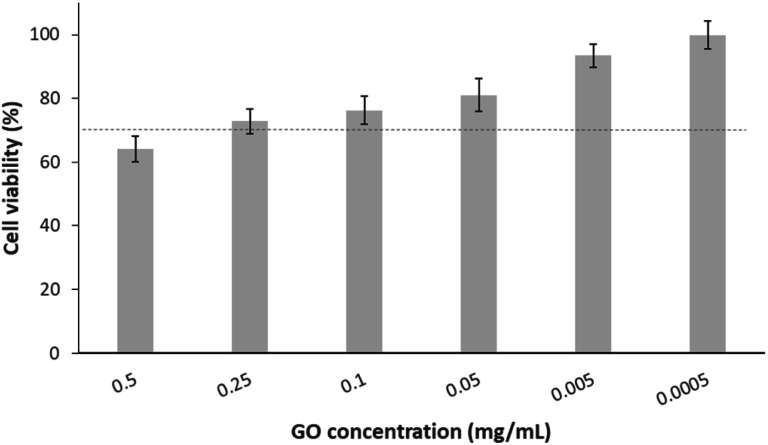
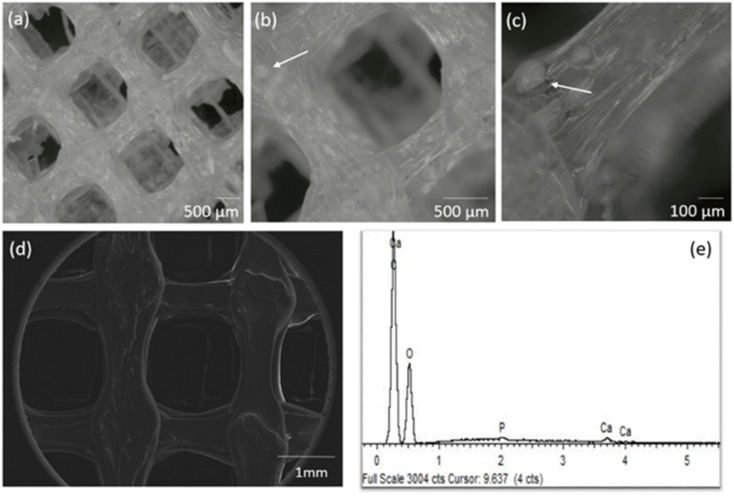
Graphene oxide (GO) has attracted increasing interest for biomedical applications owing to its outstanding properties such as high specific surface area, ability to bind functional molecules for therapeutic purposes and solubility, together with mechanical resistance and good thermal conductivity. The combination of GO with other biomaterials, such as calcium phosphate (CaP) and biodegradable polymers, presents a promising strategy for bone tissue engineering. Presently, the development of these advanced biomaterials benefits from the use of additive manufacturing techniques, such as 3D printing. In this study, we develop a 3D printed PLA:CaP:GO scaffold for bone tissue engineering. First, GO was characterised alone by XPS to determine its main bond contributions and C : O ratio. Secondly, we determined the GO dose which ensures the absence of toxicity, directly exposed in vitro (human osteoblast-like cells MG-63) and in vivo (zebrafish model). In addition, GO was microinjected in the zebrafish to evaluate its effect on immune cells, quantifying the genetic expression of the main markers. Results indicated that the GO tested (C : O of 2.14, 49.50% oxidised, main bonds: C-OH, C-O-C) in a dose ≤0.25 mg mL-1 promoted MG63 cells viability percentages above 70%, and in a dose ≤0.10 mg mL-1 resulted in the absence of toxicity in zebrafish embryos. The immune response evaluation reinforced this result. Finally, the optimised GO dose (0.10 mg mL-1) was combined with polylactic acid (PLA) and CaP to obtain a 3D printed PLA:CaP:GO scaffold. Physicochemical characterisation (SEM/EDS, XRD, FT-Raman, nano-indentation) was performed and in vivo tests confirmed its biocompatibility, enabling a novel approach for bone tissue-related applications.
This journal is © The Royal Society of Chemistry.
Conflict of interest statement
The authors have no conflicts of interest to declare.
Figures


References
-
- Wibroe P. P. Petersen S. V. Bovet N. Laursen B. W. Moghimi S. M. Biomaterials. 2016;78:20–26. - PubMed
-
- Rozhina E. Batasheva S. Miftakhova R. Yan X. Vikulina A. Volodkin D. Fakhrullin R. Appl. Clay Sci. 2021;205:106041.
-
- Zhang L. Xia J. Zhao Q. Liu L. Zhang Z. Small. 2010;6:537–544. - PubMed
-
- Ruiz O. N. Fernando K. A. S. Wang B. Brown N. A. Luo P. G. McNamara N. D. Vangsness M. Sun Y. P. Bunker C. E. ACS Nano. 2011;5:8100–8107. - PubMed
-
- Chen G. Y. Pang D. W. P. Hwang S. M. Tuan H. Y. Hu Y. C. Biomaterials. 2012;33:418–427. - PubMed
LinkOut - more resources
Full Text Sources
Miscellaneous