

Aging affects GABAergic function and calcium homeostasis in the mammalian central clock
- PMID: 37260848
- PMCID: PMC10229097
- DOI: 10.3389/fnins.2023.1178457
Aging affects GABAergic function and calcium homeostasis in the mammalian central clock
Abstract
Introduction: Aging impairs the function of the central circadian clock in mammals, the suprachiasmatic nucleus (SCN), leading to a reduction in the output signal. The weaker timing signal from the SCN results in a decline in rhythm strength in many physiological functions, including sleep-wake patterns. Accumulating evidence suggests that the reduced amplitude of the SCN signal is caused by a decreased synchrony among the SCN neurons. The present study was aimed to investigate the hypothesis that the excitation/inhibition (E/I) balance plays a role in synchronization within the network.
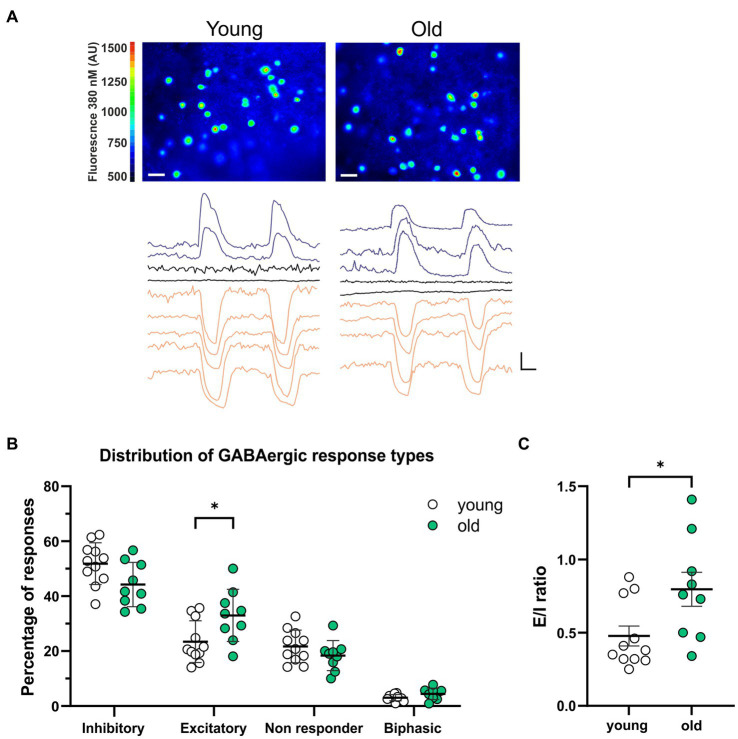
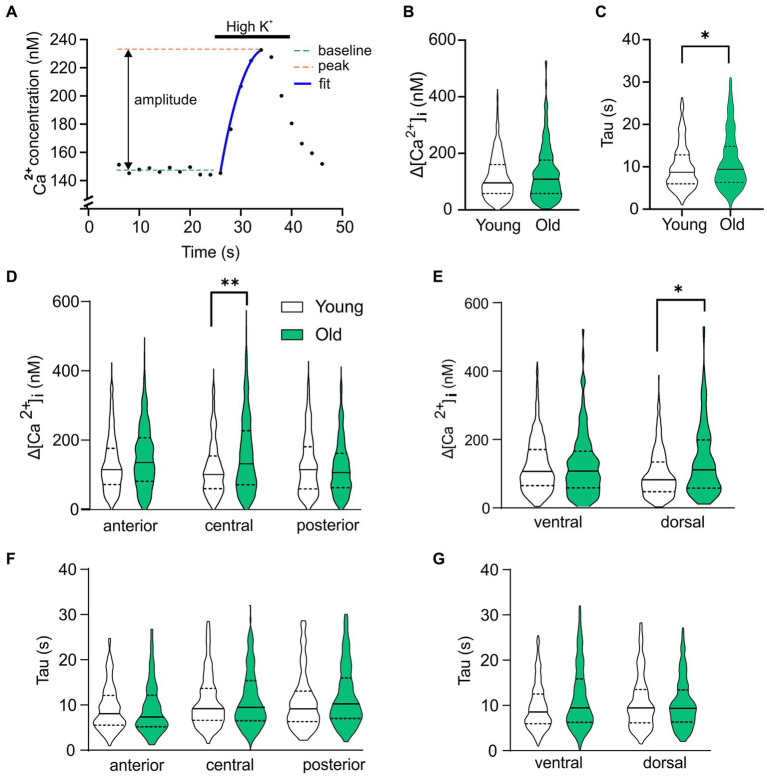
Methods: Using calcium (Ca2+) imaging, the polarity of Ca2+ transients in response to GABA stimulation in SCN slices of old mice (20-24 months) and young controls was studied.
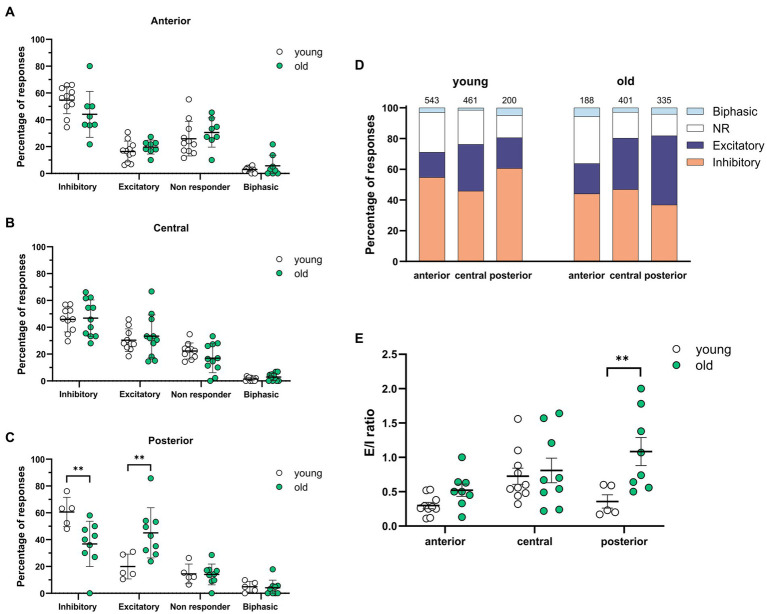
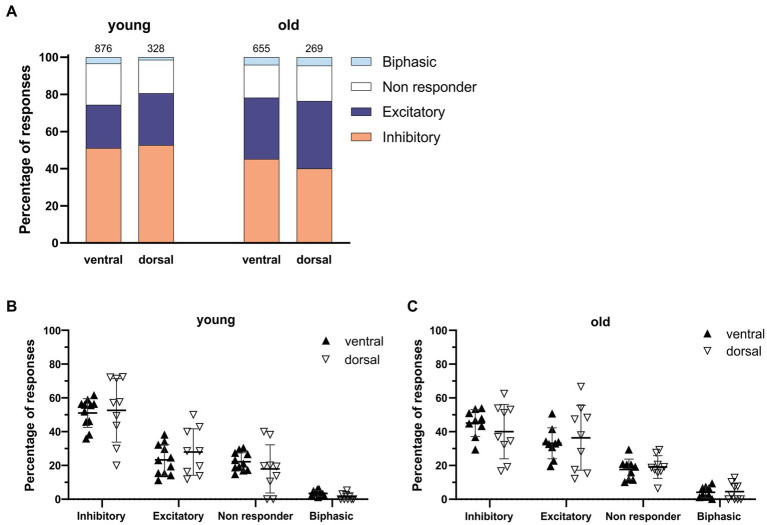
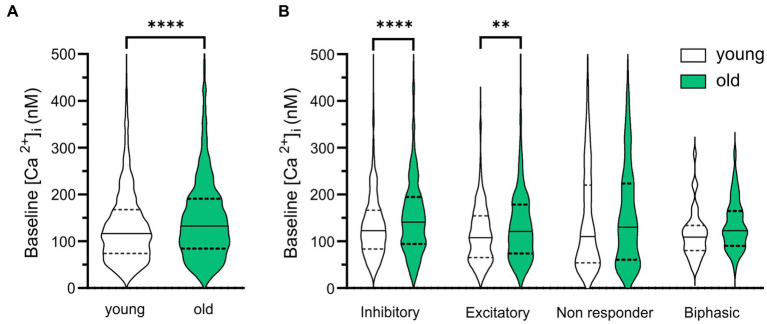
Results: We found that the amount of GABAergic excitation was increased, and that concordantly the E/I balance was higher in SCN slices of old mice when compared to young controls. Moreover, we showed an effect of aging on the baseline intracellular Ca2+ concentration, with higher Ca2+ levels in SCN neurons of old mice, indicating an alteration in Ca2+ homeostasis in the aged SCN. We conclude that the change in GABAergic function, and possibly the Ca2+ homeostasis, in SCN neurons may contribute to the altered synchrony within the aged SCN network.
Keywords: calcium imaging; chloride transporters; circadian; excitatory/inhibitory balance; old mice; suprachiasmatic nucleus.
Copyright © 2023 Olde Engberink, de Torres Gutiérrez, Chiosso, Das, Meijer and Michel.
Conflict of interest statement
The authors declare that the research was conducted in the absence of any commercial or financial relationships that could be construed as a potential conflict of interest.
Figures
Similar articles
-
Chloride cotransporter KCC2 is essential for GABAergic inhibition in the SCN.Neuropharmacology. 2018 Aug;138:80-86. doi: 10.1016/j.neuropharm.2018.05.023. Epub 2018 May 18. Neuropharmacology. 2018. PMID: 29782876
-
Calcium Circadian Rhythmicity in the Suprachiasmatic Nucleus: Cell Autonomy and Network Modulation.eNeuro. 2017 Aug 18;4(4):ENEURO.0160-17.2017. doi: 10.1523/ENEURO.0160-17.2017. eCollection 2017 Jul-Aug. eNeuro. 2017. PMID: 28828400 Free PMC article.
-
Delayed Cryptochrome Degradation Asymmetrically Alters the Daily Rhythm in Suprachiasmatic Clock Neuron Excitability.J Neurosci. 2017 Aug 16;37(33):7824-7836. doi: 10.1523/JNEUROSCI.0691-17.2017. Epub 2017 Jul 11. J Neurosci. 2017. PMID: 28698388 Free PMC article.
-
GABAergic mechanisms in the suprachiasmatic nucleus that influence circadian rhythm.J Neurochem. 2021 Apr;157(1):31-41. doi: 10.1111/jnc.15012. Epub 2020 Jul 3. J Neurochem. 2021. PMID: 32198942 Review.
-
The GABAergic network in the suprachiasmatic nucleus as a key regulator of the biological clock: does it change during senescence?Chronobiol Int. 2006;23(1-2):427-35. doi: 10.1080/07420520500545938. Chronobiol Int. 2006. PMID: 16687316 Review.
Cited by
-
Impact of Modern Lifestyle on Circadian Health and Its Contribution to Adipogenesis and Cancer Risk.Cancers (Basel). 2024 Nov 1;16(21):3706. doi: 10.3390/cancers16213706. Cancers (Basel). 2024. PMID: 39518143 Free PMC article. Review.
-
The effects of amyloidosis and aging on glutamatergic and GABAergic synapses, and interneurons in the barrel cortex and non-neocortical brain regions.Front Neuroanat. 2025 Feb 12;19:1526962. doi: 10.3389/fnana.2025.1526962. eCollection 2025. Front Neuroanat. 2025. PMID: 40012738 Free PMC article.
-
Alterations of Excitation-Inhibition Balance and Brain Network Dynamics Support Sensory Deprivation Theory in Presbycusis.Hum Brain Mapp. 2024 Nov;45(16):e70067. doi: 10.1002/hbm.70067. Hum Brain Mapp. 2024. PMID: 39502006 Free PMC article.
-
Scheduled feeding improves behavioral outcomes and reduces inflammation in a mouse model of Fragile X syndrome.bioRxiv [Preprint]. 2025 Jul 21:2024.09.16.613343. doi: 10.1101/2024.09.16.613343. bioRxiv. 2025. PMID: 39345407 Free PMC article. Preprint.
References
LinkOut - more resources
Full Text Sources
Miscellaneous