. 2023 Jan 18:9:50-73.
doi: 10.1007/s40830-022-00409-7.

Rotary Bend Fatigue of Nitinol to One Billion Cycles

Affiliations

Rotary Bend Fatigue of Nitinol to One Billion Cycles

J D Weaver et al. Shap Mem Superelasticity. .

Abstract

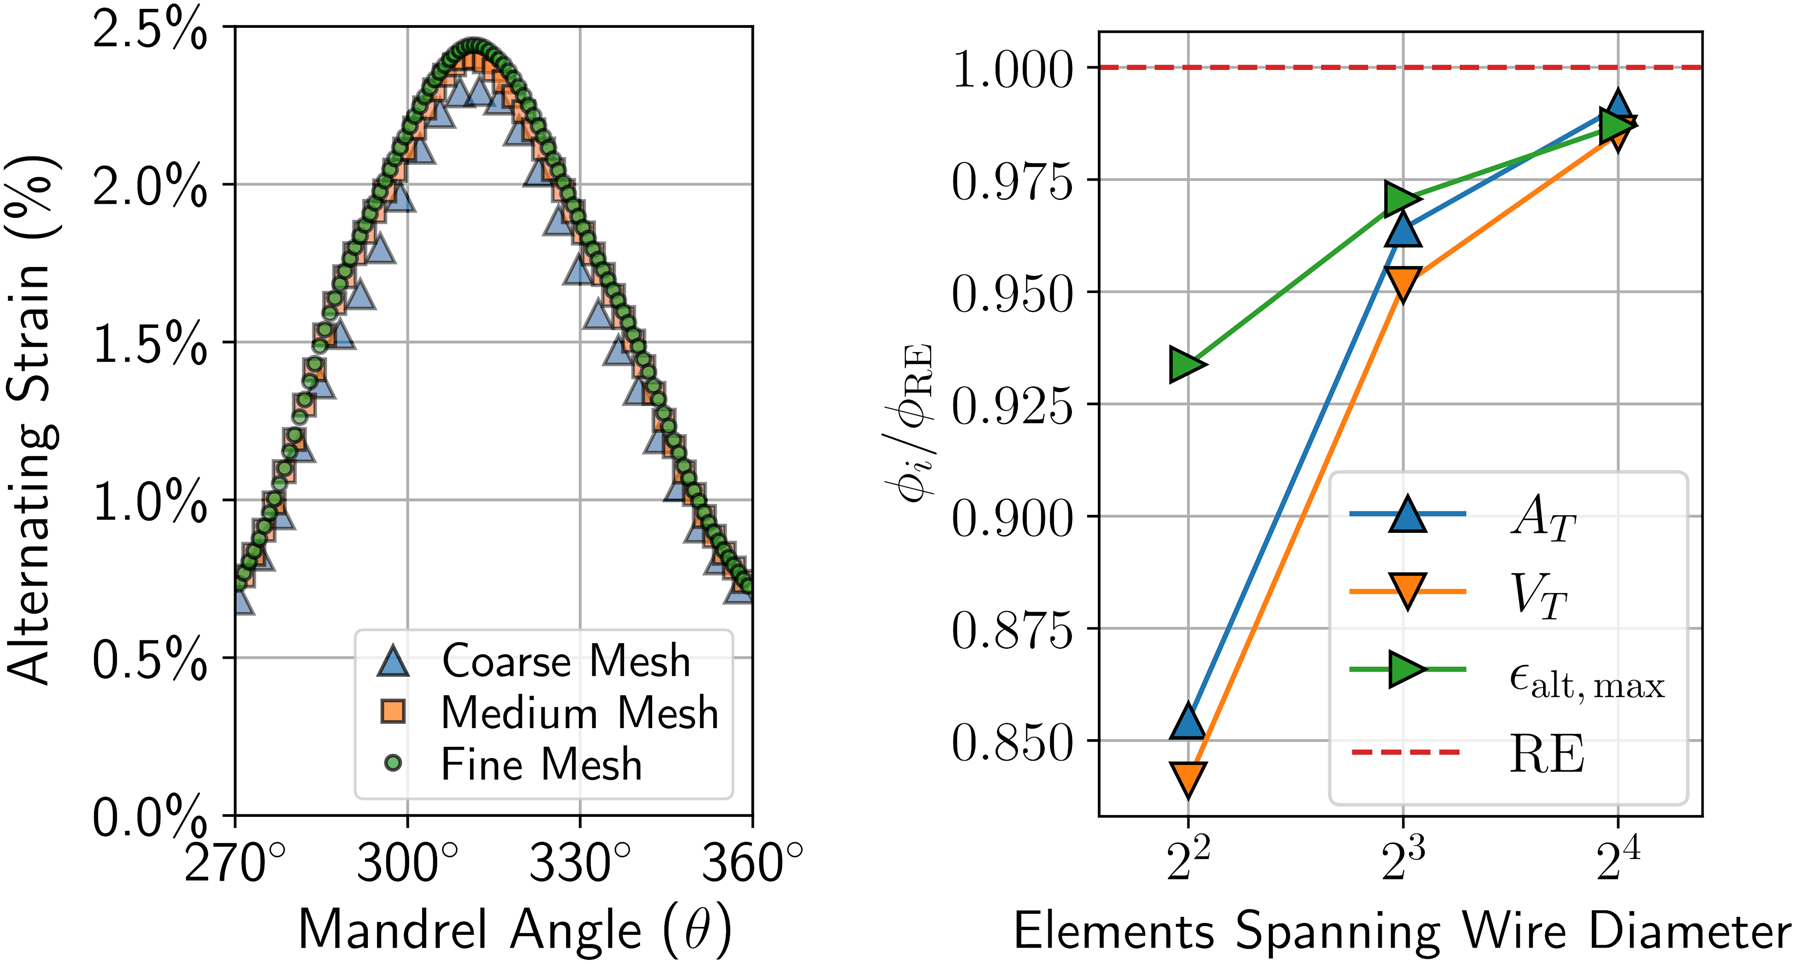
Nitinol implants, especially those used in cardiovascular applications, are typically expected to remain durable beyond 108 cycles, yet literature on ultra-high cycle fatigue of nitinol remains relatively scarce and its mechanisms not well understood. To investigate nitinol fatigue behavior in this domain, we conducted a multifaceted evaluation of nitinol wire subjected to rotary bend fatigue that included detailed material characterization and finite element analysis as well as post hoc analyses of the resulting fatigue life data. Below approximately 105 cycles, cyclic phase transformation, as predicted by computational simulations, was associated with fatigue failure. Between 105 and 108 cycles, fractures were relatively infrequent. Beyond 108 cycles, fatigue fractures were relatively common depending on the load level and other factors including the size of non-metallic inclusions present and the number of loading cycles. Given observations of both low cycle and ultra-high cycle fatigue fractures, a two-failure model may be more appropriate than the standard Coffin-Manson equation for characterizing nitinol fatigue life beyond 108 cycles. This work provides the first documented fatigue study of medical grade nitinol to 109 cycles, and the observations and insights described will be of value as design engineers seek to improve durability for future nitinol implants.

Keywords: Fatigue; Mechanical behavior; NiTi materials.


Figures

Fig. 1
Fig. 1
(Left) Experimental and (Right) computational setup for rotary bend fatigue testing. Experimental setup shown without PBS and with mandrel radius of 9.17 mm
Fig. 2
Fig. 2
Material characterization with engineering stress and strain from tensile testing (top) and differential scanning calorimetry (DSC) curve (bottom) shown with peak temperatures and Af annotated
Fig. 3
Fig. 3
Schematic of the metallographic potting for longitudinal (top) and transverse (bottom) specimens and a sample of associated SEM backscatter images. Each metallographic image was 170 μm tall by 254 μm wide
Fig. 4
Fig. 4
Numbers of inclusions per mm2 for lengths greater than x μm in the total inspected areas of 1.17 mm2 (BSC) and 1.00 mm2 (MEE) in the longitudinal (markers only) and transverse (markers and solid line) directions. All data shown are based on the square root area (√A) of an ellipse that covered the entire inclusion with the exception of the MEE transverse data. Since MEE only examined longitudinally potted specimens (reference Fig. 3), the MEE transverse data are based on the transverse Feret dimension of longitudinally potted specimens. X markers (arbitrarily placed at 0.5 on the y-axis) show inclusion √A measured at fatigue fracture initiation sites. The comparison of the metallographic √A to the fracture site makes it clear that the metallographic transverse specimen’s √A (BSC) or transverse Y-Feret (MEE) on the longitudinal specimens are better predictors than the metallographic longitudinal specimen’s √A of the fracture surface’s fracture initiating inclusion size
Fig. 5
Fig. 5
Cumulative distribution function (CDF) of inclusion sizes showing the size of the largest inclusions per transverse metallographic image (filled circle) and the corresponding Gumbel extreme value fit (solid line). The actual measured fracture site inclusion sizes for 37 LCF (N ˂ 107) fractures (times) and 20 UHCF (N ˃ 107) are also shown (plus). The Gumbel extreme value calculation using the average area at risk of fracture reasonably predicts the average fracture site inclusion size (see “Experimental Rotary Bend Fatigue and Imaging of Fractured Surfaces” section)
Fig. 6
Fig. 6
Strain-life diagram showing experiments conducted at both laboratories with filled shapes representing fractures and unfilled shapes representing runouts. Experimental alternating strains were calculated for each specimen individually using the engineering estimation in Eq. 3. Corresponding FEA calculations of transformed area AT and volume VT per wire rotation versus maximum alternating strain are shown to the right. The dashed horizontal line denotes the maximum elastic strain reached in experimental uniaxial tension testing prior to initiation of the loading plateau region (i.e., εelastic = E/σsL)
Fig. 7
Fig. 7
Representative SEM images of fracture surfaces. Left: εa = 1.87% and fracture at 2666 cycles. Right: εa = 0.48% and fracture at 642,262,481 cycles
Fig. 8
Fig. 8
SEM image of an UHCF fracture in the region of the inclusion which initiated the fracture. The cycle count at fracture for this specimen was 331,876,922
Fig. 9
Fig. 9
Mesh refinement study results. Left) Predicted maximum alternating strain εalt;max versus mandrel angle θ (see Fig. 1) for coarse, medium, and fine meshes and Right) predicted quantities of interest φ, normalized by their Richardson extrapolated (RE) values, for the 12.9 mm radius mandrel
Fig. 10
Fig. 10
From left to right, mandrel size, normalized wire radius of curvature ROC = rlocal/(rmandrel + rwire) versus mandrel angle θ (see Fig. 1), maximum alternating strain εalt;max versus mandrel angle θ, and stress–strain curves at integration points associated with the globally maximum alternating strains from FEA simulations. The maximum alternating strain versus mandrel angle also includes experimental data on angular location of fractures which shows the fracture locations correspond approximately to the predicted high strain regions
Fig. 11
Fig. 11
Top: Single-failure model fit using the Coffin-Manson Strength Model. Bottom: Two-failure model fit
Fig. 12
Fig. 12
CDF of cycles to fracture data and the two-mode model for various alternating strains. For the three lowest alternating strains which all had runouts, an arrow along with the number of runouts over the total number of specimens is shown. Runout arrows are positioned experimentally where the next fracture CDF value would be. For example, because no fractures occurred at 0.41% alternating strain level, there is no marker only an arrow and that arrow is located at 109 cycle (runout) and 0.5/13, the CDF of where the 1st fracture would be with 13 specimens
Fig. 13
Fig. 13
The prediction of the safe loading level using the Murakami-Endo model along with damage accumulation (Eq. 28). The black line represents the safe loading level prediction using the average inclusion size (7.42 μm) found at the fatigue fracture initiation site. The green and red lines are calculated with the same method only using the inclusion size that is two standard deviations from the average above (red = 12.02 μm) and below (green = 2.82 μm) the average size

References

    1. Gbur JL, Lewandowski JJ (2016) Fatigue and fracture of wires and cables for biomedical applications. Int Mater Rev 61(4):231–314
    1. Mahtabi MJ, Shamsaei N, Mitchell MR (2015) Fatigue of Nitinol: The state-of-the-art and ongoing challenges. J Mech Behav Biomed Mater 50:228–254 - PubMed
    1. Pelton A, Berg B, Saffari P, Stebner A, and Bucsek A, Pre-strain and Mean Strain Effects on the Fatigue Behavior of Superelastic Nitinol Medical Devices. Shape Memory and Superelasticity, 2022: p. 1–21.
    1. Pelton A, Pelton S, Jörn T, Ulmer J, Niedermaier D, Plaskonka K, LePage W, Saffari P, and Mitchell M The quest for fatigue-resistant nitinol for medical implants. in Fourth symposium on fatigue and fracture of metallic medical materials and devices. 2019. ASTM International.
    1. Robertson S, Pelton A, Ritchie R (2012) Mechanical fatigue and fracture of Nitinol. Int Mater Rev 57(1):1–36

LinkOut - more resources