. 2023 May 16:14:1053920.
doi: 10.3389/fimmu.2023.1053920. eCollection 2023.

Co-cultures of colon cancer cells and cancer-associated fibroblasts recapitulate the aggressive features of mesenchymal-like colon cancer

Affiliations

Co-cultures of colon cancer cells and cancer-associated fibroblasts recapitulate the aggressive features of mesenchymal-like colon cancer

Esther Strating et al. Front Immunol. .

Abstract

Background: Poor prognosis in colon cancer is associated with a high content of cancer-associated fibroblasts (CAFs) and an immunosuppressive tumor microenvironment. The relationship between these two features is incompletely understood. Here, we aimed to generate a model system for studying the interaction between cancer cells and CAFs and their effect on immune-related cytokines and T cell proliferation.

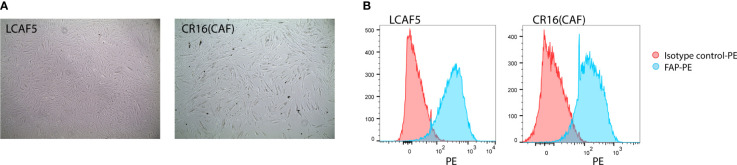
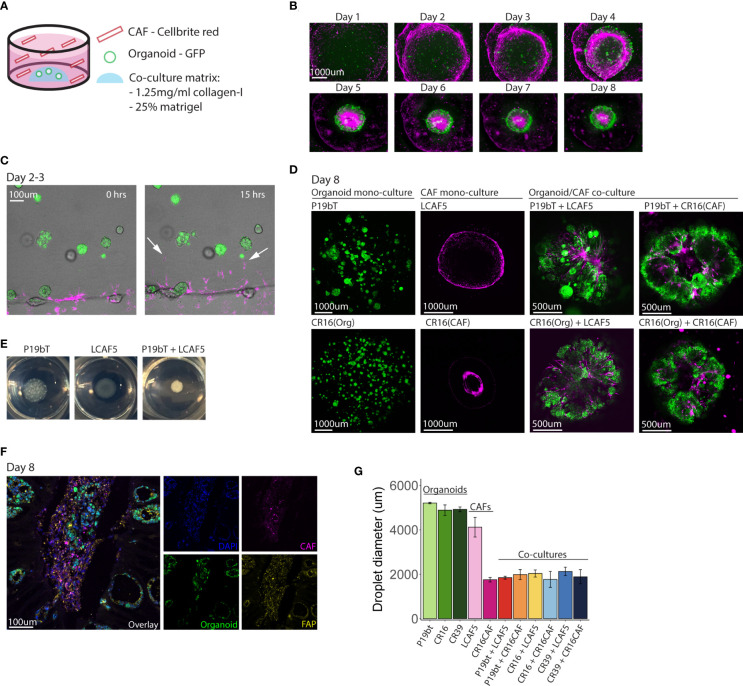
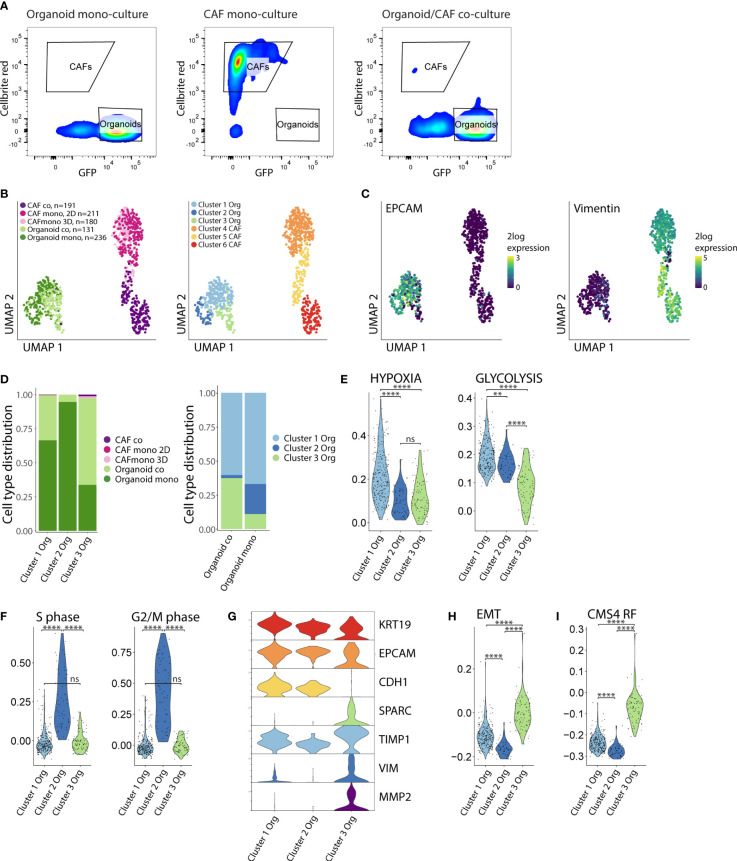
Methods: CAFs were isolated from colon cancer liver metastases and were immortalized to prolong lifespan and improve robustness and reproducibility. Established medium and matrix compositions that support the growth of patient-derived organoids were adapted to also support CAF growth. Changes in growth pattern and cellular re-organization were assessed by confocal microscopy, live cell imaging, and immunofluorescence. Single cell RNA sequencing was used to study CAF/organoid co-culture-induced phenotypic changes in both cell types. Conditioned media were used to quantify the production of immunosuppressive factors and to assess their effect on T cell proliferation.

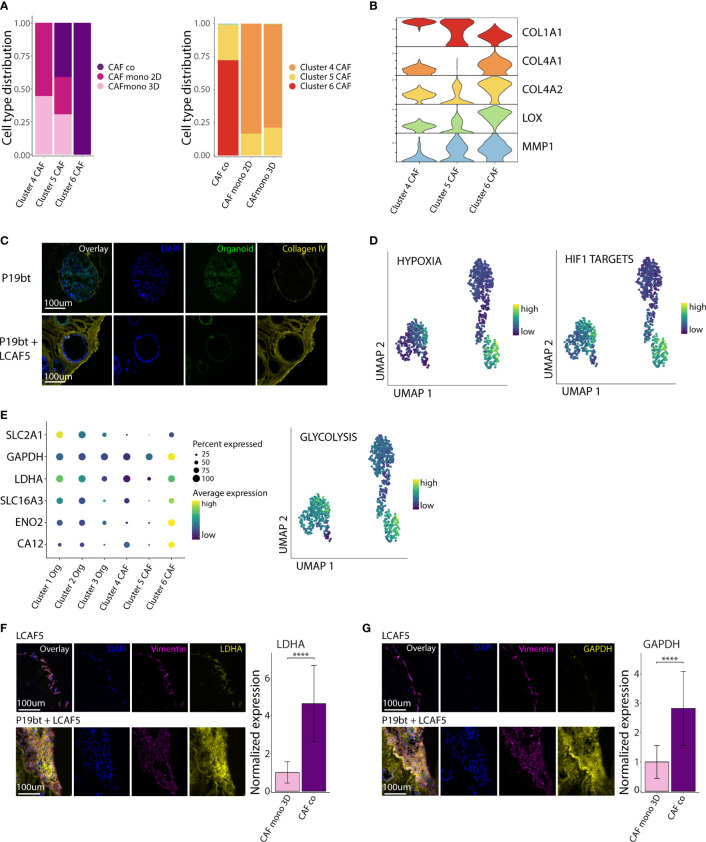
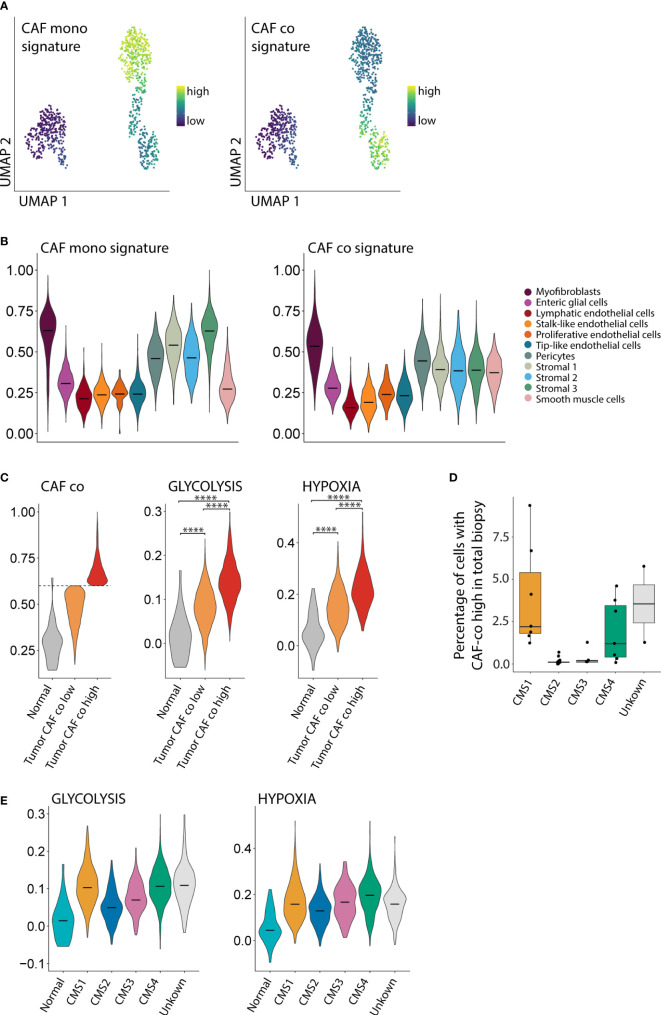
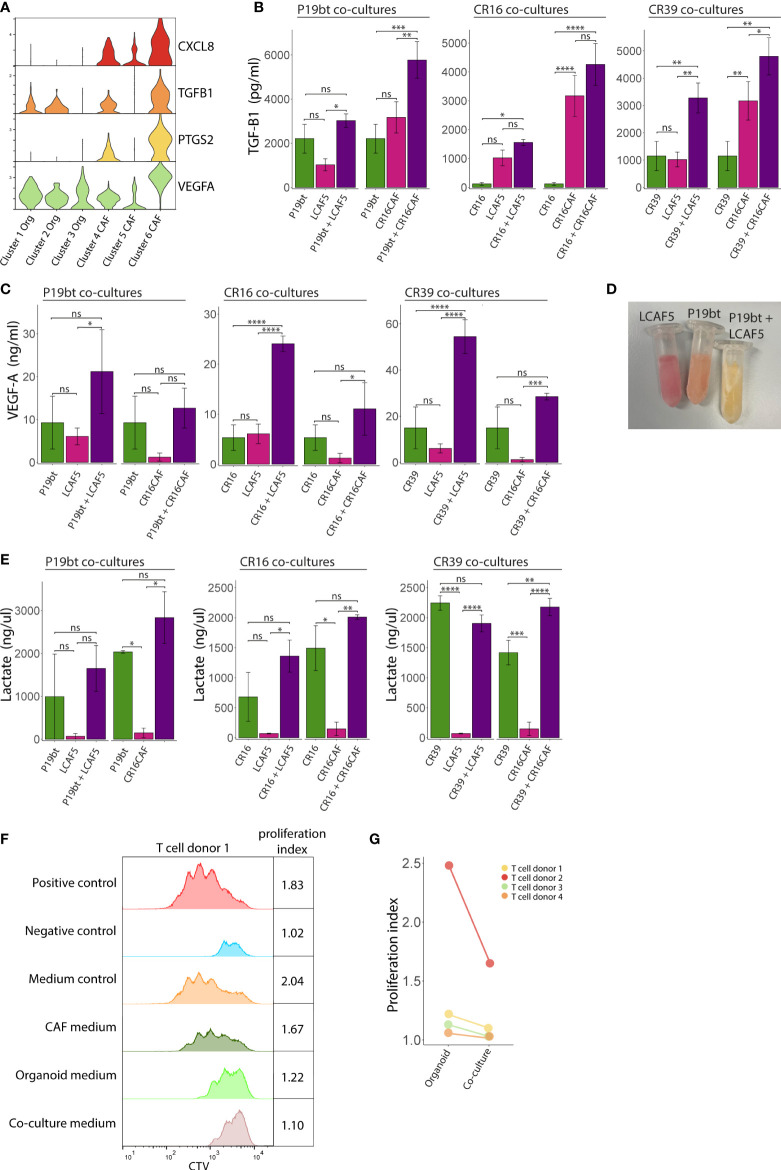
Results: We developed a co-culture system in which colon cancer organoids and CAFs spontaneously organize into superstructures with a high capacity to contract and stiffen the extracellular matrix (ECM). CAF-produced collagen IV provided a basement membrane supporting cancer cell organization into glandular structures, reminiscent of human cancer histology. Single cell RNA sequencing analysis showed that CAFs induced a partial epithelial-to-mesenchymal-transition in a subpopulation of cancer cells, similar to what is observed in the mesenchymal-like consensus molecular subtype 4 (CMS4) colon cancer. CAFs in co-culture were characterized by high expression of ECM components, ECM-remodeling enzymes, glycolysis, hypoxia, and genes involved in immunosuppression. An expression signature derived from CAFs in co-culture identified a subpopulation of glycolytic myofibroblasts specifically residing in CMS1 and CMS4 colon cancer. Medium conditioned by co-cultures contained high levels of the immunosuppressive factors TGFβ1, VEGFA and lactate, and potently inhibited T cell proliferation.

Conclusion: Co-cultures of organoids and immortalized CAFs recapitulate the histological, biophysical, and immunosuppressive features of aggressive mesenchymal-like human CRC. The model can be used to study the mechanisms of immunosuppression and to test therapeutic strategies targeting the cross-talk between CAFs and cancer cells. It can be further modified to represent distinct colon cancer subtypes and (organ-specific) microenvironments.

Keywords: CMS4; cancer-associated fibroblast (CAF); colorectal cancer; immunosuppressive; microenvironment.


Conflict of interest statement

The authors declare that the research was conducted in the absence of any commercial or financial relationships that could be construed as a potential conflict of interest.

Figures

Figure 1
Figure 1
Establishment of immortalized colorectal cancer-associated fibroblasts. (A) Bright field images of two immortalized CAF cell lines, LCAF5 and CR16CAF, taken with the EVOS light microscope. (B) Histograms of FAP expression of both CAF cell lines measured using Flow Cytometry.
Figure 2
Figure 2
Spontaneous reorganization of cancer cells and CAFs into macroscopic mini-tumors. (A) Schematic overview of the co-culture model. Small GFP expressing organoids (n=600) are plated in a co-culture matrix containing Matrigel and collagen-I, CAFs stained with Cellbrite red dye (n=28,000) are plated in suspension in the well. (B) Fluorescence pictures taken with the EVOS M5000 microscope showing the time line of co-culture formation during the course of 8 days. The organoid P19bT is in green, LCAF5 is in magenta. (C) Two stills from a live cell imaging experiment conducted on the night of day 2 going on day 3 (full movie in Supplemental Data ). The organoid is P19bT and the CAF line is LCAF5. During the course of 15 hours CAFs migrate into the matrix droplet, indicated by the white arrows. (D) Confocal images of organoid mono-cultures, CAF mono-cultures and Organoid/CAF co-cultures after 8 days. Organoids are in green, CAFs are in magenta (E) Pictures taken from the P19bT organoid mono-culture droplet, LCAF5 mono-culture droplet and P19bT/LCAF5 co-culture droplet on day 8. The co-culture droplet strongly contracted forming a macroscopically visible ‘mini tumor’. (F) Immunofluorescence image of FAP expression in a co-culture cryosection of P19bT organoid with LCAF5. (G) Diameter quantification of the matrix droplets after 8 days in culture. Bars represent the mean diameter of 5 droplets, error bars represent SD.
Figure 3
Figure 3
Co-culturing increases the fraction of cancer cells with reduced proliferation and partial EMT. (A) FACS sorting of organoids and CAFs from the mono- and co-culture conditions. Organoids were selected based on their GFP expression, CAFs were selected based on their Cellbrite red expression. Organoid = P19bT, CAF = LCAF5. (B) UMAP plots of single cell RNA seq data from organoids and CAFs from the mono- and co-culture conditions. CAF co = LCAF5 originating from the co-culture droplet, CAF mono 2D = LCAF 5 grown on the plastic of the CAF mono-culture condition, CAF 3D = LCAF5 grown on the matrix droplet of the CAF mono-culture condition, Organoid co = P19bT originating from the co-culture droplet, Organoid mono = P19bT originating from the mono-culture droplet. Graph based clustering analysis defined 3 organoid clusters and 3 CAF clusters. (C) Feature plot showing EPCAM and Vimentin expression. (D) Bar charts with cell type distribution of the 3 organoid clusters across the experimental conditions. (E) Violin plots showing the expression of Hypoxia and Glycolysis hallmark gene signatures across the 3 organoid clusters. (F) Violin plots showing the expression scores of S-phase marker genes (N=43) and G2/M-phase marker genes (N=54) across the 3 organoid clusters. Cluster 2 shows the highest expression of cell cycle genes. (G) Violin plots showing the expression of epithelial and mesenchymal genes across the 3 organoid clusters. Cluster 3 shows a lower expression of epithelial genes and a higher expression of mesenchymal genes compared to cluster 1 and 2. (H) Violin plot showing the expression of the Epithelial to Mesenchymal (EMT) Hallmark gene signature across the 3 organoid clusters. Cluster 3 cancer cells show the highest EMT gene signature scores. (I) Violin plot showing the module score of the CMS4 Random Forest (CMS4 RF) classifier genes (N=143). Cluster 3 shows the highest CMS4 RF signature score. ns, non-significant, Ns = p > 0.05, ** = p < 0.01,**** = p < 0.0001.
Figure 4
Figure 4
CAFs in co-culture acquire a hypoxic, glycolytic and matrix-remodeling phenotype. (A) Bar charts with cell type distribution of the 3 CAF clusters across the experimental conditions. (B) Stacked violin plot of genes related to Extra Cellular Matrix (ECM) remodeling across the 3 CAF clusters. (C) Immunofluorescence images of Collagen IV staining of the P19bT mono-culture and the P19bT + LCAF5 co-culture. (D) UMAP plots showing the expression of the Hypoxia hallmark gene signature and the HIF1 targets gene signature across all cells. (E) Gene expression dot plot showing the expression of several glycolysis associated genes and UMAP plot of the Glycolysis hallmark gene signature. (F) Immunofluorescence images of LDHA staining of the LCAF5 mono-culture and the P19bT + LCAF5 co-culture. Bar chart showing expression of LDHA in mono-cultured CAFs and co-cultured CAFs. Bars represent the mean normalized LDHA expression, error bars represent SD. **** = p <0.0001. (G) Immunofluorescence images of GAPDH staining of the LCAF5 mono-culture and the P19bT + LCAF5 co-culture. Bar chart showing expression of GAPDH in mono-cultured CAFs and co-cultured CAFs. Bars represent the mean normalized GAPDH expression, error bars represent SD. **** = p <0.0001.
Figure 5
Figure 5
CAFs in co-culture resemble a subpopulation of CAFs enriched in CMS1 and CMS4 tumors. (A) UMAP plot showing the expression of mono- and co-culture CAF signatures. (B) Violin plot showing the expression of the mono- and co-culture CAF signature in stromal cells from a large single cell RNA seq dataset of primary colorectal cancer (N=29 patients, N = 13,583 cells). (C) Violin plot showing the expression of the CAF co-culture signature in myofibroblasts from normal tissue and in tumor myofibroblasts classified as CAF co low and CAF co high. (D) Boxplot showing the fraction of stromal cells classified as CAF co high within the total biopsy (epithelial, immune and stromal cells combined). (E) Violin plots showing the association between the Glycolysis and Hypoxia hallmark with the CMS1 and CMS4 molecular subtypes. **** = p <0.0001.
Figure 6
Figure 6
Generation of an immunosuppressive microenvironment in co-cultures. (A) Stacked Violin plots of immunosuppressive genes showing an increased expression by the co-cultured CAFs (Cluster 6). (B) Bar charts showing the TGF-B1 concentration in the medium from the mono- and co-culture conditions. Bars represent the mean concentration of 3 experiments, error bars represent SD. (C) Bar charts showing the VEGFA concentration in the medium from the mono- and co-culture conditions. Bars represent the mean concentration of 3 experiments, error bars represent SD. (D) Picture of Eppendorf tubes containing the conditioned medium of the CAF mono-culture condition LCAF5, the organoid mono-culture condition P19bT and the co-culture condition P19bT/LCAF5. The pH indicator in the medium clearly shows a decreased pH in the co-culture condition compared to the mono-culture conditions. (E) Bar charts showing the lactate concentration in the medium from the mono- and co-culture conditions, error bars represent SD. (F) Histogram showing the Cell Trace Violet (CTV) expression of one representative T cell proliferation experiment. The organoid conditioned medium peaks show a moderate inhibitory effect on T cell proliferation whereas the co-culture conditioned medium shows the strongest inhibition that somewhat resembles the peak of the negative control. (G) Dot plot showing T cell proliferation indices of the experimental conditions with organoid and co-culture conditioned medium, from four independent experiments. ns, non-significant, Ns = p > 0.05, * = p < 0.05, ** = p < 0.01, *** = p < 0.001, **** = p < 0.0001.

References

    1. Sung H, Ferlay J, Siegel RL, Laversanne M, Soerjomataram I, Jemal A, et al. . Global cancer statistics 2020: GLOBOCAN estimates of incidence and mortality worldwide for 36 cancers in 185 countries. CA Cancer J Clin (2021) 71(3):209–49. doi: 10.3322/caac.21660 - DOI - PubMed
    1. Guinney J, Dienstmann R, Wang X, de Reynies A, Schlicker A, Soneson C, et al. . The consensus molecular subtypes of colorectal cancer. Nat Med (2015) 21(11):1350–6. doi: 10.1038/nm.3967 - DOI - PMC - PubMed
    1. Zhang B, Wang J, Wang X, Zhu J, Liu Q, Shi Z, et al. . Proteogenomic characterization of human colon and rectal cancer. Nature (2014) 513(7518):382–7. doi: 10.1038/nature13438 - DOI - PMC - PubMed
    1. Vasaikar S, Huang C, Wang X, Petyuk VA, Savage SR, Wen B, et al. . Proteogenomic analysis of human colon cancer reveals new therapeutic opportunities. Cell (2019) 177(4):1035–49.e19. doi: 10.1016/j.cell.2019.03.030 - DOI - PMC - PubMed
    1. Lee HO, Hong Y, Etlioglu HE, Cho YB, Pomella V, Van den Bosch B, et al. . Lineage-dependent gene expression programs influence the immune landscape of colorectal cancer. Nat Genet (2020) 52(6):594–603. doi: 10.1038/s41588-020-0636-z - DOI - PubMed

Publication types