. 2023 Sep 4;220(9):e20221751.
doi: 10.1084/jem.20221751. Epub 2023 Jun 1.

Neutrophil extracellular traps and extracellular histones potentiate IL-17 inflammation in periodontitis

Affiliations

Neutrophil extracellular traps and extracellular histones potentiate IL-17 inflammation in periodontitis

Tae Sung Kim et al. J Exp Med. .

Abstract

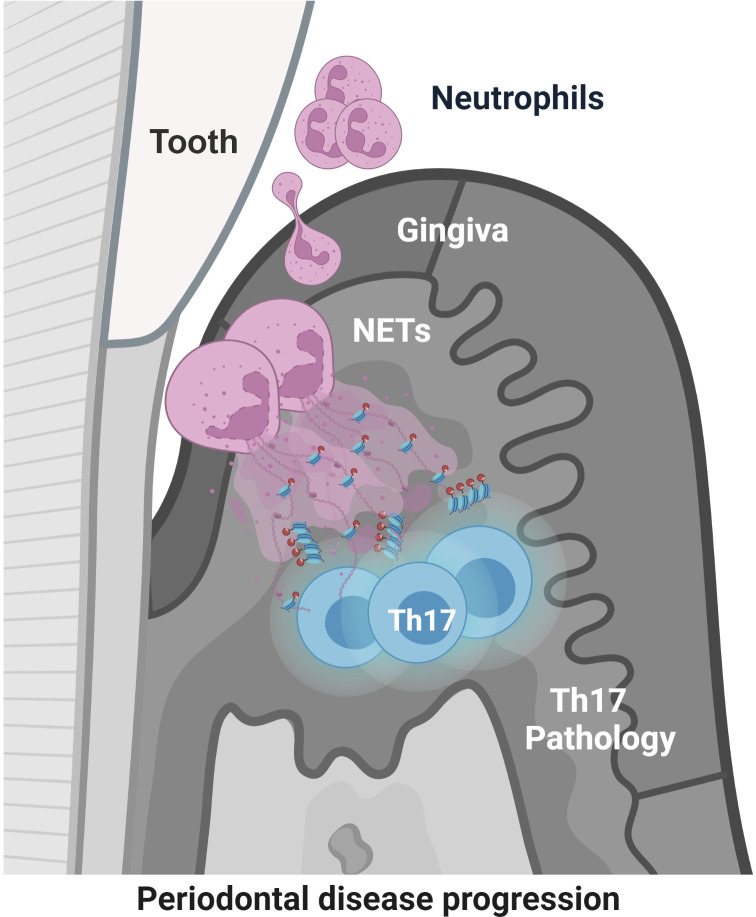
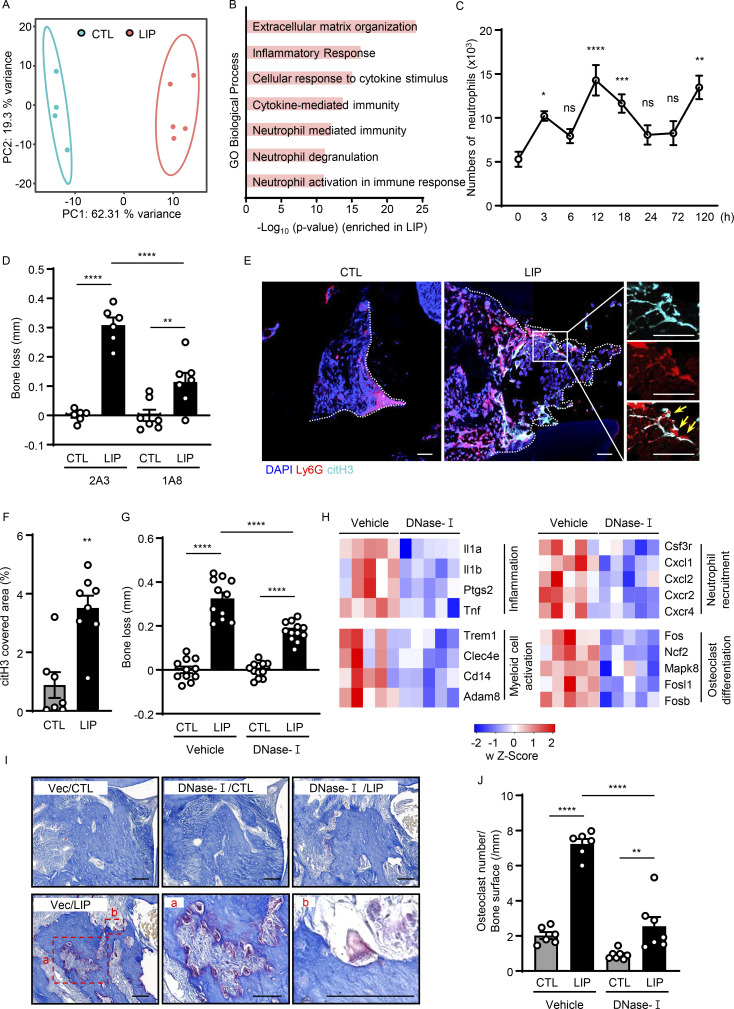
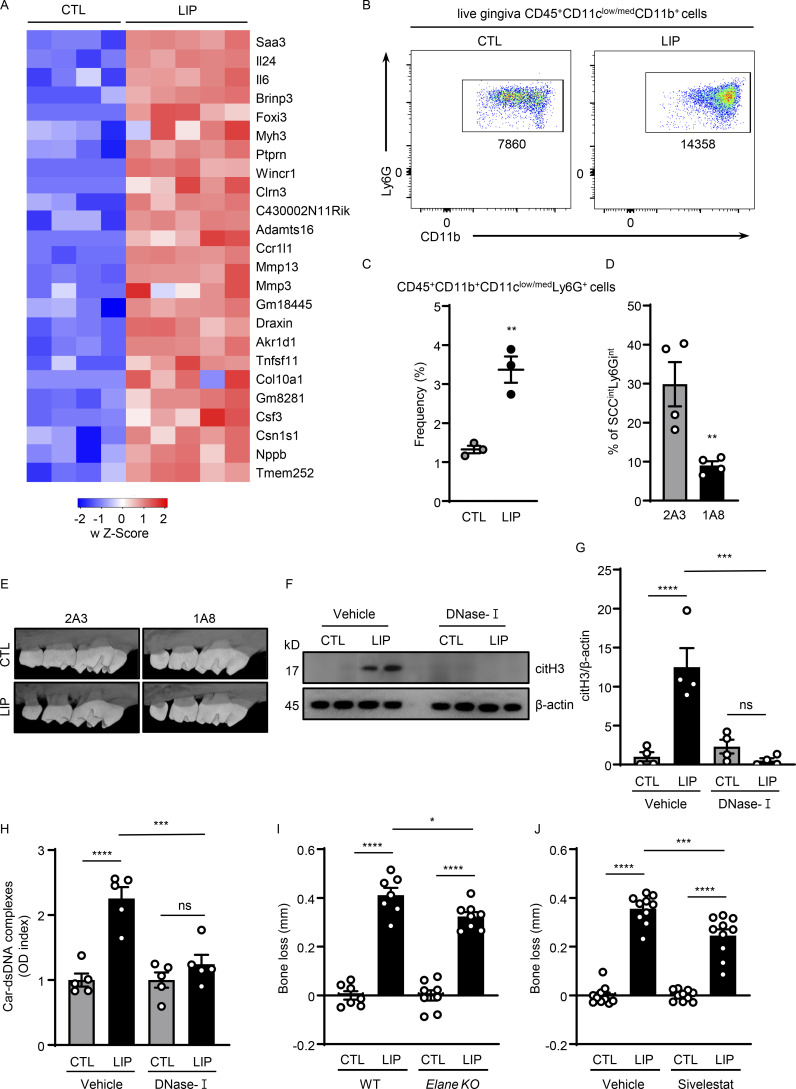
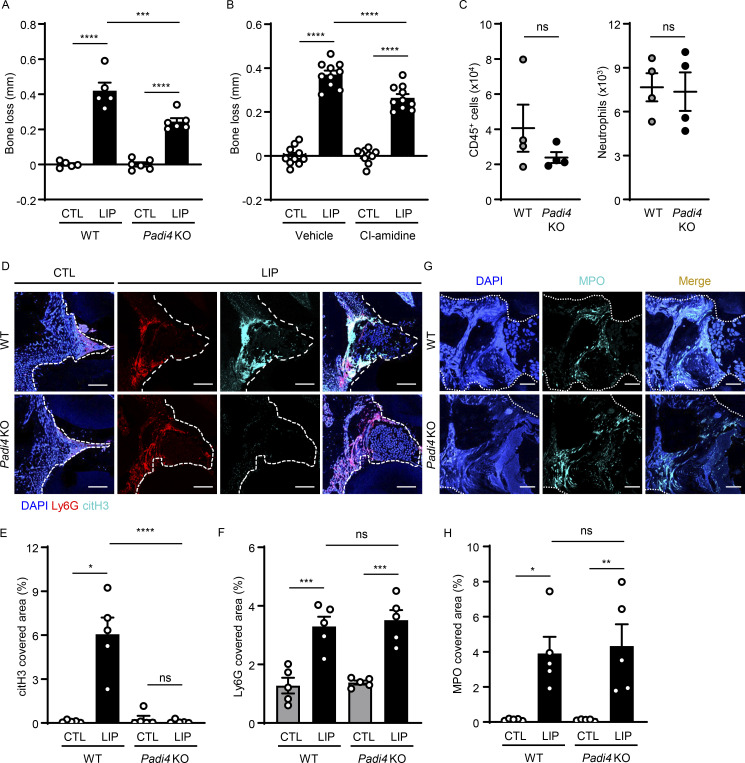
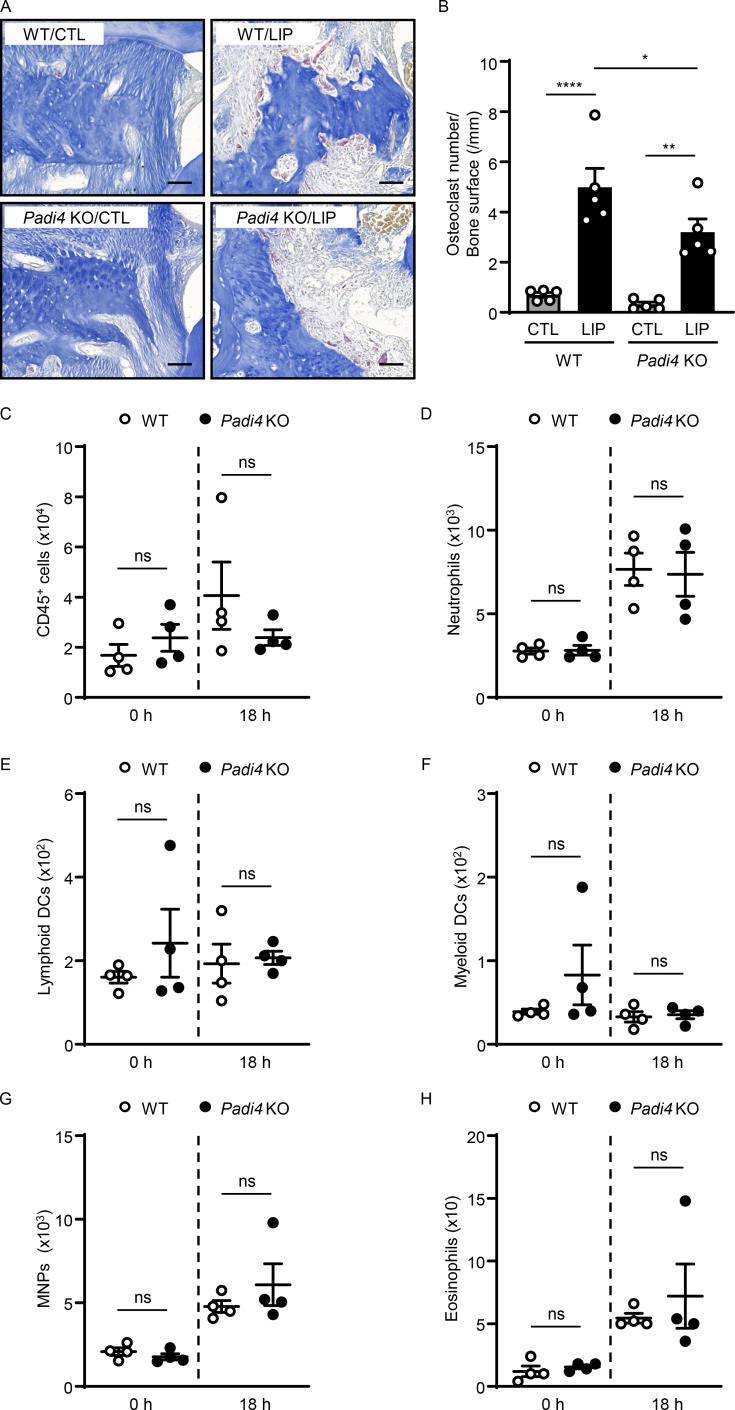
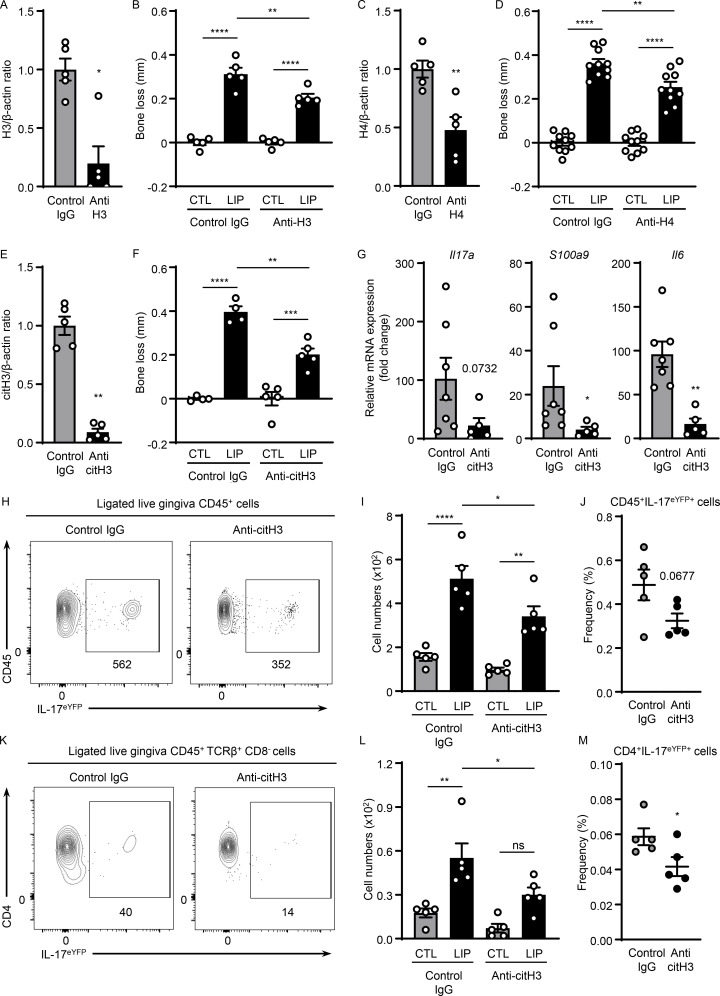
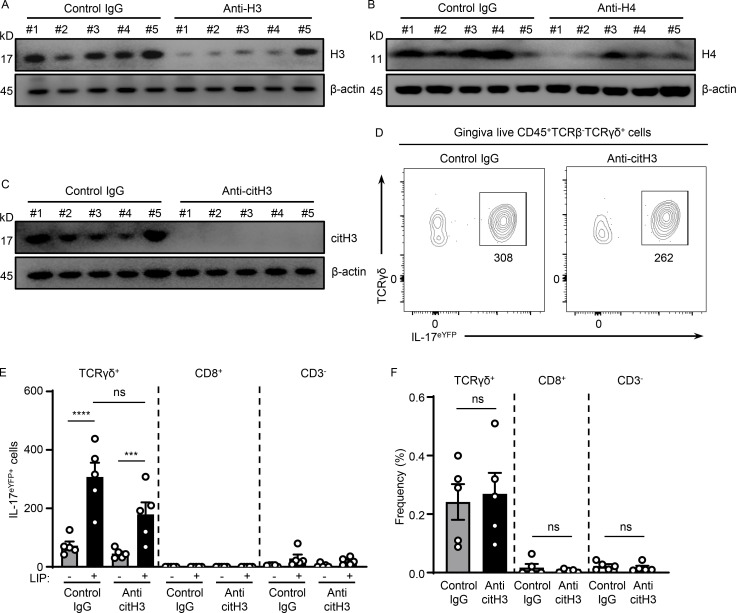
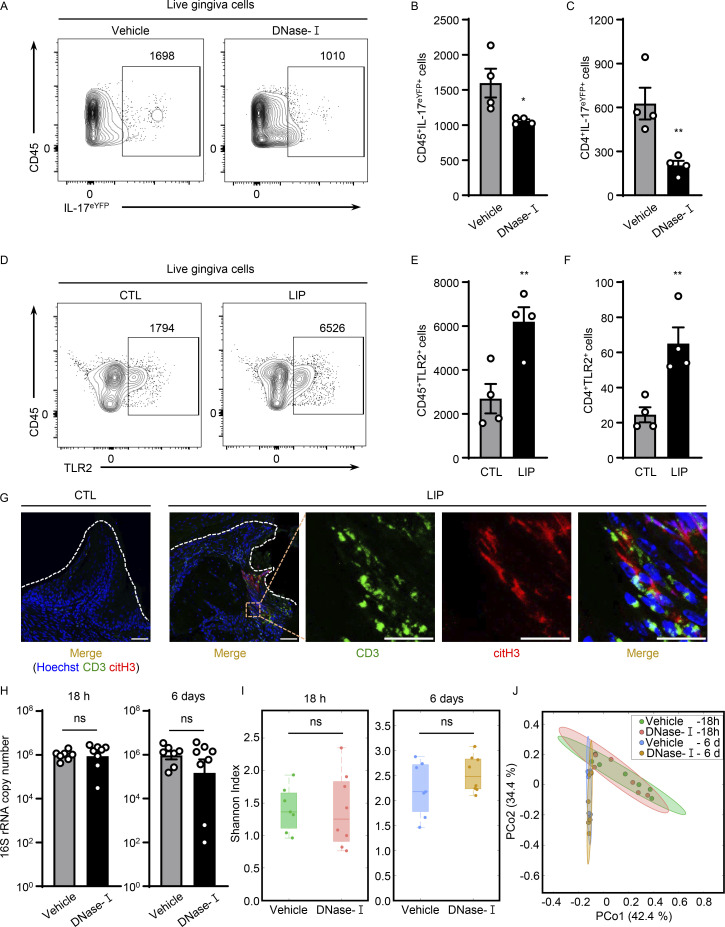
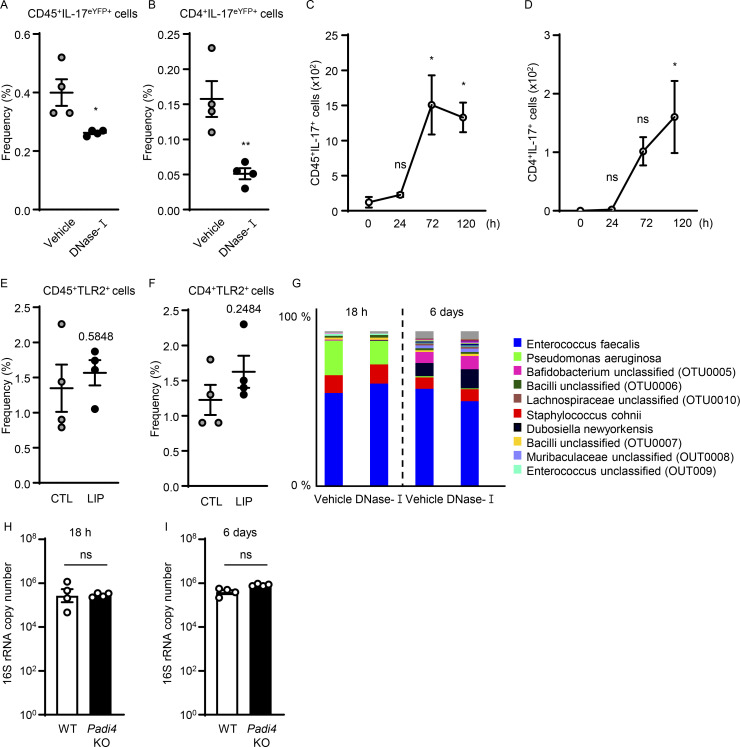
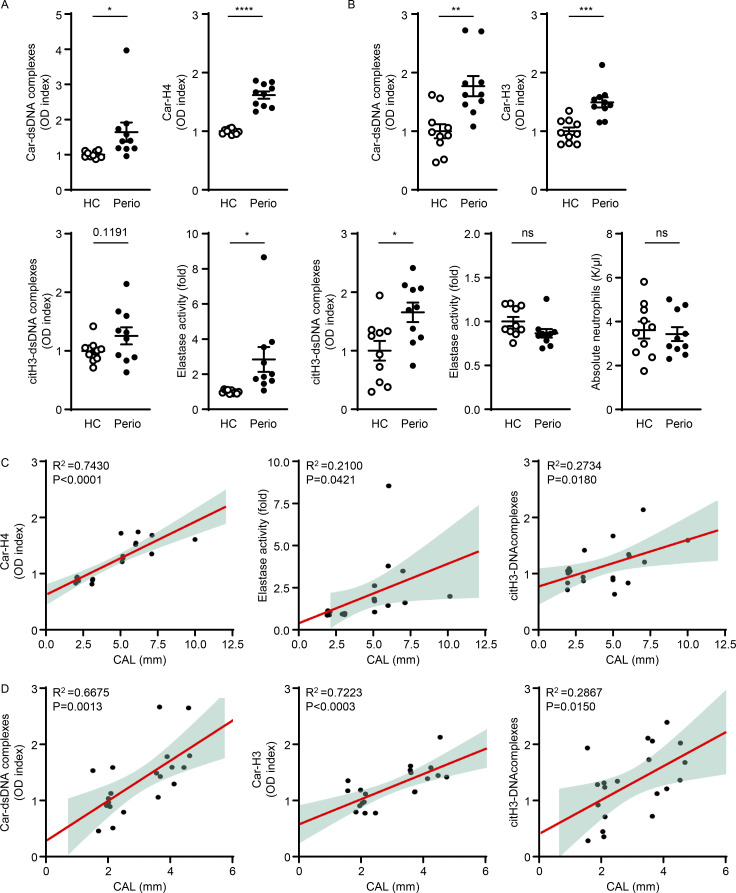
Neutrophil infiltration is a hallmark of periodontitis, a prevalent oral inflammatory condition in which Th17-driven mucosal inflammation leads to destruction of tooth-supporting bone. Herein, we document that neutrophil extracellular traps (NETs) are early triggers of pathogenic inflammation in periodontitis. In an established animal model, we demonstrate that neutrophils infiltrate the gingival oral mucosa at early time points after disease induction and expel NETs to trigger mucosal inflammation and bone destruction in vivo. Investigating mechanisms by which NETs drive inflammatory bone loss, we find that extracellular histones, a major component of NETs, trigger upregulation of IL-17/Th17 responses, and bone destruction. Importantly, human findings corroborate our experimental work. We document significantly increased levels of NET complexes and extracellular histones bearing classic NET-associated posttranslational modifications, in blood and local lesions of severe periodontitis patients, in the absence of confounding disease. Our findings suggest a feed-forward loop in which NETs trigger IL-17 immunity to promote immunopathology in a prevalent human inflammatory disease.


Conflict of interest statement

Disclosures: The authors declare no competing interests exist.

Figures

None
Graphical abstract
Figure 1.
Figure 1.
Evidence of NETosis in lesions of experimental periodontitis. (A and B) Bulk RNA-seq in mouse gingival tissues from CTL (n = 4) and LIP (n = 5, 5 d). (A) Principal components analysis. (B) Gene Ontology (GO) biological processes in ascending order of P value. (C) Flow cytometry analysis of mouse gingiva CTL/LIP mice at indicated times (0–120 h). Absolute number of neutrophils (CD45+CD11b+CD11clow/medLy6G+) per standardized tissue block (n = 3–14) is shown. (D) Bone loss after LIP with isotype control (clone 2A3) or anti-Ly6G (clone 1A8) treatment. Bar graph depicts bone loss (n = 6–7, 6 d). (E and F) Immunofluorescence for citH3 and Ly6G in gingival tissue (CTL/LIP, 18 h). (E) Representative confocal images; scale bars are 50 µm. (F) Quantification, mean fluorescence intensity of citH3 staining (n = 7–8). (G and H) LIP following treatment with DNase-I or vehicle treatment. (G) Bone loss measurement (n = 11–12, 6 d). (H) RNA-seq of gingival tissues (18 h after LIP) with DNase-I (n = 5) or vehicle (n = 5). Heatmap analysis of select significantly differentially expressed genes. Each column represents a single sample. (I and J) TRAP-stained sections of gingival tissues from DNase-I or vehicle-treated mice with or without LIP (n = 6–7, 6 d). (I) TRAP-positive cells appear purplish to dark red in the sections. Scale bars are 50 µm; representative image. (J) Quantification of osteoclasts per condition, number of osteoclast/bone surface (N/mm). Data are representative of three (D, F, G, and J) or four (C) independent experiments. Graphs show the mean ± SEM. *P < 0.05, **P < 0.01, ***P < 0.001, ****P < 0.0001. One-way ANOVA with Tukey’s multiple comparison test (B–D, G, and J), unpaired t test (F).
Figure S1.
Figure S1.
NETs play a pathogenic role in inflammatory bone loss. (A) Mouse gingival tissues of CTL (n = 4) and LIP (n = 5, 5 d) were harvested, and processed for RNA-seq analysis. Heatmap analysis of the RNA-seq data. Significantly differentially expressed genes between CTL and LIP are shown. Each column represents an individual sample. (B and C) Flow cytometry analysis of mouse oral gingival tissues in CTL and LIP (n = 3, 5 d) mice. FACS plot shows changes in neutrophil numbers (B) and graph indicates percentage of CD45+CD11b+ CD11clow/medLy6G+ cells (C). (D) Percentage of neutrophils in gingival tissue after 1A8 (n = 4) or 2A3 (n = 4) treatment. (E) Representative microcomputed tomography images of maxilla from isotype control-treated and anti-Ly6G-treated mice (n = 3). (F–H) Gingival tissues with or without LIP (18 h) in mice treated with DNase-I (n = 4–5) or vehicle (n = 4–5) were harvested, processed, and then subjected to (F and G) immunoblot for citH3 and (H) ELISA for Car–dsDNA complexes. (I and J) Bone loss measurements with or without LIP (6 d) in (I) WT and Elane KO (n = 7–8) mice or (J) mice treated with sivelestat or vehicle (n = 10). Bar graph depicts bone loss. Data are representative of three (C, D, and H) or four (F, G, I, and J) independent experiments. Graphs show the mean ± SEM. * P <0.05, **P < 0.01, ***P < 0.001, ****P < 0.0001. One-way ANOVA with Tukey’s multiple comparison test (G–J), unpaired t test (C and D). Source data are available for this figure: SourceData FS1.
Figure 2.
Figure 2.
Inhibition of citrullination protects from periodontal bone loss. (A and B) Bone loss measurements with or without LIP (6 d) in (A) WT and Padi4 KO (n = 5–6) mice or (B) mice treated with CI-amidine or vehicle (n = 10). (C) Flow cytometry analysis of mouse oral gingival tissues after LIP (18 h) in WT and Padi4 KO mice (n = 4). Graph indicating absolute number of CD45+ or neutrophils (CD45+CD11b+CD11clow/medLy6G+) per standardized tissue block. (D–H) Immunofluorescence for citH3, Ly6G, MPO in gingival tissues from Padi4 KO and WT mice, with or without LIP (n = 5, 18 h). (D and G) Representative images and conditions are indicated. Scale bars are 50 µm. (E, F, and H) Quantification, mean fluorescence intensity for citH3, Ly6G, and MPO staining (n = 5). Data are representative of three (A, C, E, F, and H) or four (B) independent experiments. Graphs show the mean ± SEM. *P < 0.05, **P < 0.01, ***P < 0.001, ****P < 0.0001. One-way ANOVA with Tukey’s multiple comparison test (A, B, E, F, and H), unpaired t test (C).
Figure S2.
Figure S2.
Citrullination of NETs potentiates inflammatory bone destruction. (A and B) Representative TRAP-stained sections of gingival tissues with or without LIP (6 d) in WT (n = 5) and Padi4 KO (n = 5) mice. (A) TRAP-positive cells appear as purplish to dark red in the sections. Scale bars are 50 µm; representative image. (B) Quantification of osteoclasts per condition, number of osteoclast/bone surface (N/mm). (C–H) Flow cytometry analysis of mouse oral gingival tissues with or without LIP (18 h) in WT (n = 4) and Padi4 KO (n = 4) mice. Graph indicating absolute number of CD45+ (C), neutrophils (CD45+CD11b+CD11clow/medLy6G+; D), lymphoid DCs (CD11bCD11c+; E), myeloid DCs (CD11b+ CD11clow-med; F), MNPs (CD11b+CD11clow-medLy6GLy6Clow-highSSClow; G), and eosinophils (CD11b+CD11clow-medLy6GLy6Clow-neg SSChigh; H) per standardized tissue block. Data are representative of three (B–H) independent experiments. Graphs show the mean ± SEM. *P < 0.05, **P < 0.01, ****P < 0.0001. One-way ANOVA with Tukey’s multiple comparison test (B), unpaired t test (C–H).
Figure 3.
Figure 3.
Histones trigger periodontal inflammation and bone destruction. Mice with or without LIP were treated with isotype IgG, anti-H3, anti-H4, or anti-citH3. (A, C, and E) Western blot analysis for H3, H4, citH3, and β-actin in gingival tissues with or without LIP (6 d) in isotype IgG (n = 5), (A) anti-H3 (n = 5), (C) anti-H4 (n = 5), or (E) citH3 (n = 5) treated mice. Densitometric values for H3, H4, and citH3 were normalized against those of β-actin. (B, D, and F) Bone loss measurements in mice treated with isotype IgG (n = 4–10), (B) anti-H3 (n = 5), (D) anti-H4 (n = 10), or (F) citH3 (n = 4–5) treated mice, with or without LIP. (G) qPCR analysis for Il17a, S100a9, and Il6 in gingival tissues in mice treated with isotype IgG (n = 7) or anti-citH3 (n = 5, fold change 4 d after LIP shown for each treatment). (H–M) Flow cytometry analysis of gingival in IL-17acreR26ReYFP mice treated with isotype IgG (n = 5) or anti-citH3 (n = 5), with or without LIP. (H and K) FACS plot and graph indicating (I and L) numbers and (J and M) percentage of CD45+eYFP+ or CD4+eYFP+ cells. Data are representative of three (A–C, E, F, I, J, L, and M) or four (G) independent experiments. Graphs show the mean ± SEM. *P < 0.05, **P < 0.01, ***P < 0.001, ****P < 0.0001. One-way ANOVA with Tukey’s multiple comparison test (B, D, F, I, and L) or unpaired t test (A, C, E, G, J, and M).
Figure S3.
Figure S3.
Histones meditate IL-17 cell accumulation in periodontitis. (A–C) Western blot analysis for H3, H4, citH3, and β-actin in mouse oral gingival tissues with or without LIP (6 d) in isotype IgG H3 (n = 5), (A) anti-H3 (n = 5), (B) anti-H4 (n = 5), or (C) anti-citH3 treated mice (n = 5). (D–F) Flow cytometry analysis of mouse oral gingival tissues with or without LIP (4 d) in isotype IgG (n = 5) and anti-citH3 (n = 5) treated IL-17acreR26ReYFP mice. (D) FACS plot and graphs indicating (E) numbers and (F) percentage of γδT+eYFP+, CD8eYFP+, as well as CD3−eYFP+ cells. Data are representative of three (A–C, E, and F) independent experiments. Graphs show the mean ± SEM. ***P < 0.001, ****P < 0.0001. One-way ANOVA with Tukey’s multiple comparison test (E and F). Source data are available for this figure: SourceData FS3.
Figure 4.
Figure 4.
NETs potentiate IL-17/Th17 inflammation in periodontitis. (A–C) Flow cytometry analysis of IL-17acreR26ReYFP mice oral gingival tissues with or without LIP (4 d) treated with DNase-I (n = 4) or vehicle (n = 4) control. (A) FACS plot of CD45eYFP+ and (B and C) quantification of CD45eYFP+ and CD4eYFP+ cells (LIP, 4 d, numbers of cells/per standardized block). (D–F) Flow cytometry analysis in WT mice with or without LIP (n = 4, 4 d). (D) FACS plot and quantification of (E) CD45+TLR2+ or (F) CD4+TLR2+ cells. (G) Immunofluorescence for citH3 and CD3 in mice without/with LIP (n = 3, 18 h). Scale bars, 50 µm; representative images shown. (H) Total oral microbial biomass in mice treated with DNase-I (n = 8) or vehicle (n = 7) treated mice at 18 h and 6 d after LIP. (I and J) 16S rRNA sequencing of LIP microbial communities from DNase-I and vehicle-treated mice at 18 h and 6 d (n = 7–8). (I) Plots show alpha-diversity based on the Shannon index. (J) Principal Coordinate analysis (PCoA) of beta-diversity based on Bray-Curtis dissimilarity. Vehicle and DNase-I are not significantly different regarding beta-diversity at either 18 h or 6 d. Data are representative of three (B, C, E, F, and H) independent experiments. Graphs show the mean ± SEM. *P < 0.05, **P < 0.01. Unpaired t test (B, C, E, F, H, and I) or permutational multivariate ANOVA (J).
Figure S4.
Figure S4.
NETs support IL-17 cell accumulation in periodontitis. (A and B) Flow cytometry analysis of IL-17acreR26ReYFP mice oral gingival tissues after LIP (4 d) treated with DNase-I (n = 4) or vehicle (n = 4). Graphs indicating the percentage of (A) CD45+eYFP+ or (B) CD4+eYFP+ cells. (C and D) Flow cytometry analysis of mouse oral gingival tissues in CTL/LIP mice at the indicated times (n = 3, 0–120 h). Graphs indicating numbers of (C) CD45+ or (D) CD4+IL-17+ cells. (E and F) Flow cytometry analysis in WT mice with or without LIP (n = 4, 4 d). Graph indicating percentage of (E) CD45+ or (F) CD4+TLR2+ cells. (G) 16S rRNA sequencing of LIP microbial communities from DNase-I and vehicle-treated mice at 18 h and 6 d (n = 7–8). Relative abundance of most abundant bacteria, OTU level. (H and I) Total oral microbial biomass in WT (n = 4) and Padi4 KO (n = 4) mice at (H) 18 h and (I) 6 d after LIP. Data are representative of three (A–F, H, and I) independent experiments. Graphs show the mean ± SEM. *P < 0.05. ns, not significant. One-way ANOVA with Tukey’s multiple comparison test (C and D), Unpaired t test (A, B, E, F, H, and I).
Figure 5.
Figure 5.
Levels of NET complexes in GCF and serum correlate with severity of periodontitis. (A) Human GCF samples were analyzed for the levels of Car–dsDNA complexes, Car-H4, citH3–dsDNA complex, and NE activity in HC (n = 10) and periodontitis (perio) patients (n = 10). (B) Serum samples were analyzed to quantify the levels of Car–dsDNA, Car-H3, citH3–dsDNA complex, NE activity, and absolute neutrophils number in HC and perio patients. (C) Correlation analysis of CAL (in mm) with GCF levels of Car-H4 and elastase activity or serum levels of Car-H3 measured in periodontitis patients. (D) Correlation between plasma levels of Car–dsDNA complexes and Car-H3 measured in periodontitis patients. Results are expressed as OD index. Data are representative of three (A and B) independent experiments. Graphs show the mean ± SEM. *P < 0.05, **P < 0.01, ***P < 0.001****P < 0.0001. Unpaired t test (A and B).

Comment in

References

    1. Abusleme, L., Hong B.Y., Hoare A., Konkel J.E., Diaz P.I., and Moutsopoulos N.M.. 2017. Oral microbiome characterization in murine models. Bio Protoc. 7:e2655. 10.21769/BioProtoc.2655 - DOI - PMC - PubMed
    1. Barman, M., Unold D., Shifley K., Amir E., Hung K., Bos N., and Salzman N.. 2008. Enteric salmonellosis disrupts the microbial ecology of the murine gastrointestinal tract. Infect. Immun. 76:907–915. 10.1128/IAI.01432-07 - DOI - PMC - PubMed
    1. Bright, R., Proudman S.M., Rosenstein E.D., and Bartold P.M.. 2015. Is there a link between carbamylation and citrullination in periodontal disease and rheumatoid arthritis? Med. Hypotheses. 84:570–576. 10.1016/j.mehy.2015.03.006 - DOI - PubMed
    1. Bright, R., Thiele G.M., Manavis J., Mikuls T.R., Payne J.B., and Bartold P.M.. 2018. Gingival tissue, an extrasynovial source of malondialdehyde-acetaldehyde adducts, citrullinated and carbamylated proteins. J. Periodontal Res. 53:139–143. 10.1111/jre.12486 - DOI - PMC - PubMed
    1. Brinkmann, V., Reichard U., Goosmann C., Fauler B., Uhlemann Y., Weiss D.S., Weinrauch Y., and Zychlinsky A.. 2004. Neutrophil extracellular traps kill bacteria. Science. 303:1532–1535. 10.1126/science.1092385 - DOI - PubMed

Publication types