. 2023 Jul 17;133(14):e158348.
doi: 10.1172/JCI158348.

Anti-miR-93-5p therapy prolongs sepsis survival by restoring the peripheral immune response

Affiliations

Anti-miR-93-5p therapy prolongs sepsis survival by restoring the peripheral immune response

Mihnea P Dragomir et al. J Clin Invest. .

Abstract

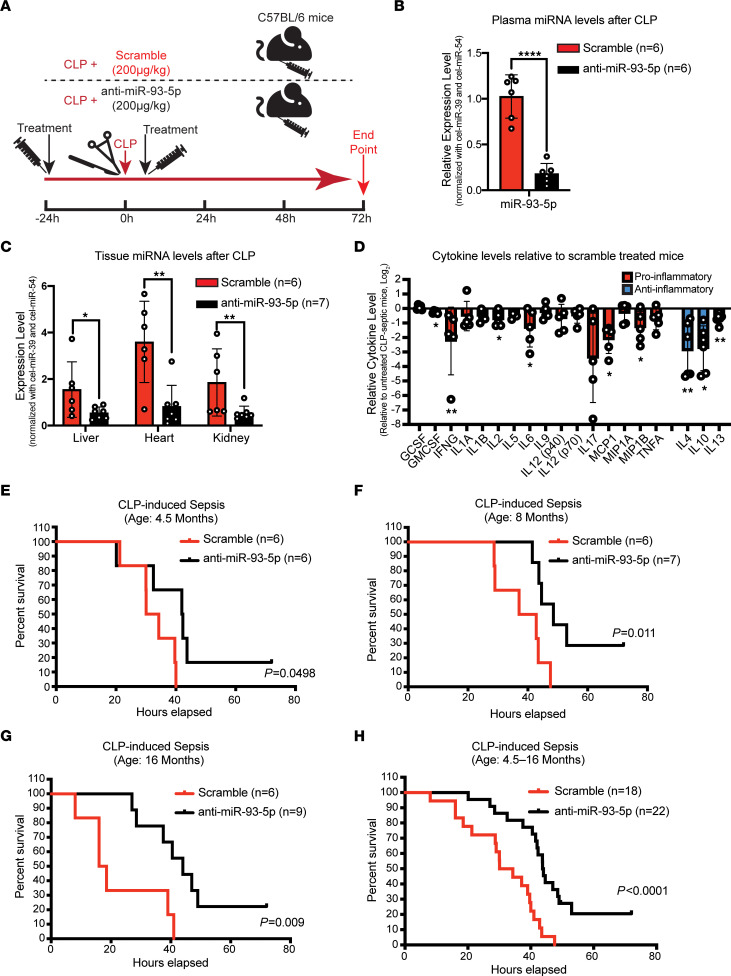
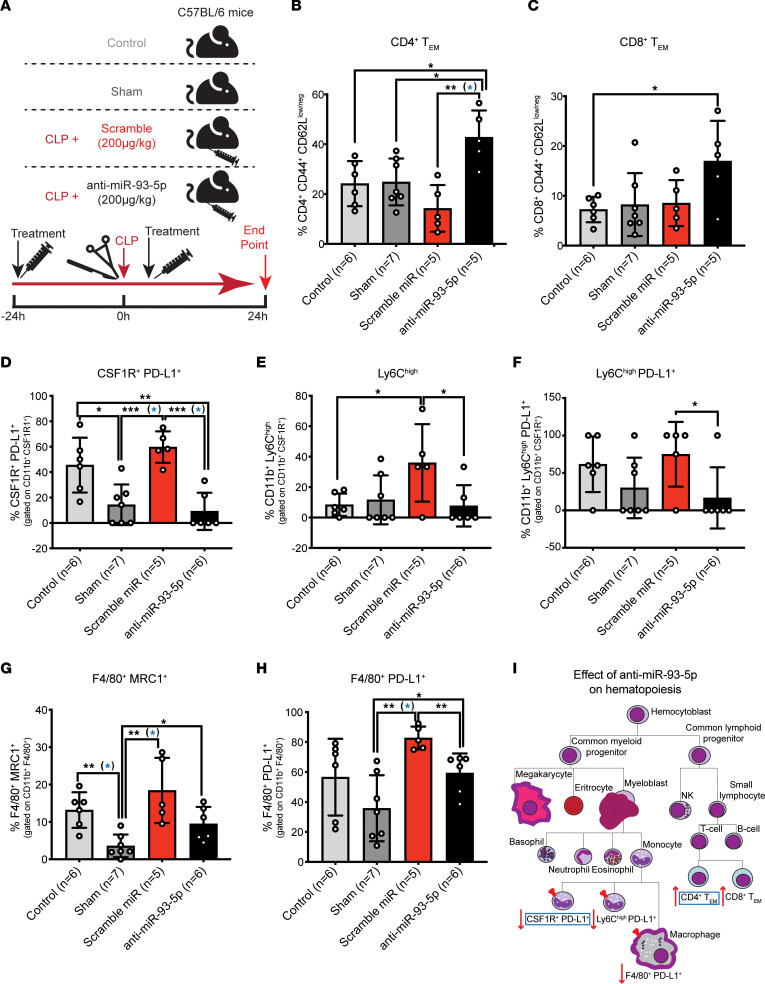
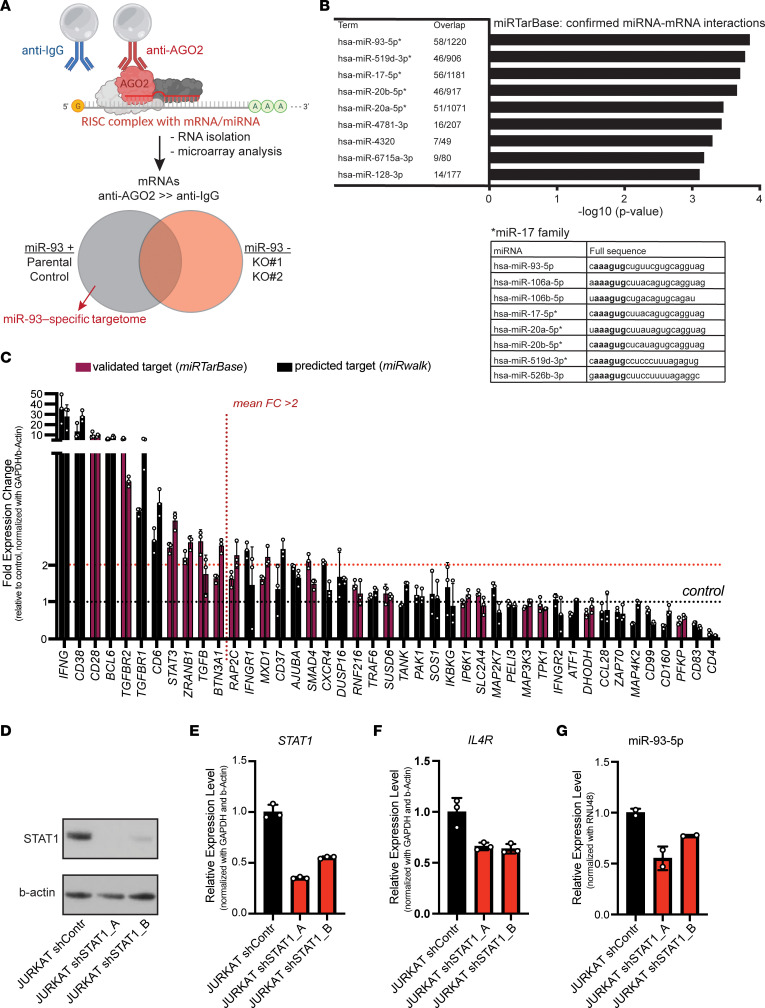
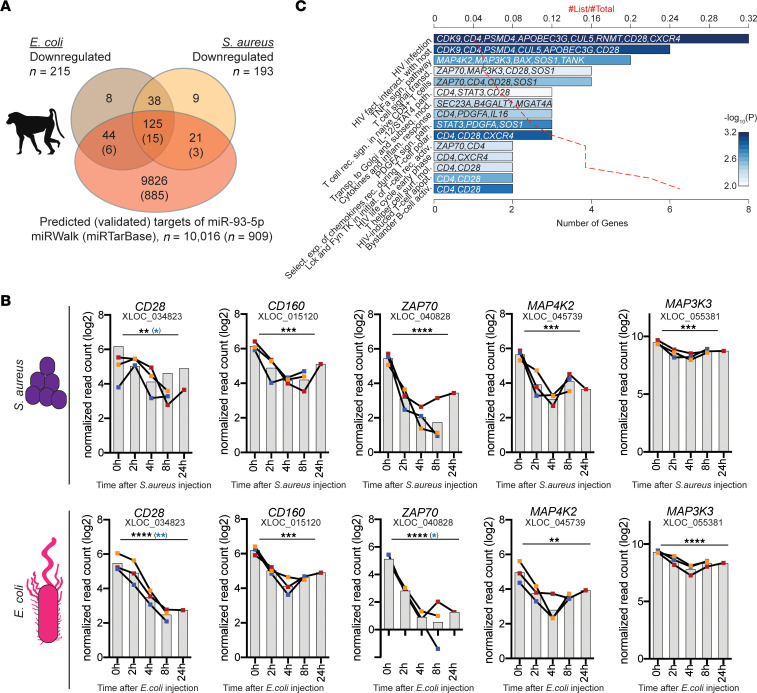
Sepsis remains a leading cause of death for humans and currently has no pathogenesis-specific therapy. Hampered progress is partly due to a lack of insight into deep mechanistic processes. In the past decade, deciphering the functions of small noncoding miRNAs in sepsis pathogenesis became a dynamic research topic. To screen for new miRNA targets for sepsis therapeutics, we used samples for miRNA array analysis of PBMCs from patients with sepsis and control individuals, blood samples from 2 cohorts of patients with sepsis, and multiple animal models: mouse cecum ligation puncture-induced (CLP-induced) sepsis, mouse viral miRNA challenge, and baboon Gram+ and Gram- sepsis models. miR-93-5p met the criteria for a therapeutic target, as it was overexpressed in baboons that died early after induction of sepsis, was downregulated in patients who survived after sepsis, and correlated with negative clinical prognosticators for sepsis. Therapeutically, inhibition of miR-93-5p prolonged the overall survival of mice with CLP-induced sepsis, with a stronger effect in older mice. Mechanistically, anti-miR-93-5p therapy reduced inflammatory monocytes and increased circulating effector memory T cells, especially the CD4+ subset. AGO2 IP in miR-93-KO T cells identified important regulatory receptors, such as CD28, as direct miR-93-5p target genes. In conclusion, miR-93-5p is a potential therapeutic target in sepsis through the regulation of both innate and adaptive immunity, with possibly a greater benefit for elderly patients than for young patients.

Keywords: Adaptive immunity; Immunology; Infectious disease; Innate immunity; Noncoding RNAs.


Figures

Figure 1
Figure 1. miR-93-5p is a potential therapeutic target in sepsis.
(A) Schematic workflow of the selection, confirmation, and therapeutic and comprehensive functional characterization of an upregulated miRNA target in sepsis. (B) Heatmap displaying the miRNAs most differentially expressed in PBMCs from patients with sepsis (n = 8) compared with PBMCs from healthy controls (n = 8). Black arrows represent human miRNAs upregulated in PBMCs from patients with sepsis. (C) Representative image of the CLP-induced sepsis mouse model (8-month-old mouse). (D) Bar graphs of log2-transformed mean plasma levels of measured pro- and antiinflammatory cytokines in CLP-induced septic mice (n = 10) relative to sham-operated mice (n = 10). All mice were 8 months old. Proinflammatory cytokines: granulocyte-CSF (G-CSF), eotaxin, GM-CSF, IFN-γ (IFNG), IL-1α (IL1A), IL-1β (IL1B), IL-2 (IL2), IL-5 (IL5), IL-6 (IL6), IL-9 (IL9), IL-12 (p40) [IL12(p40)], IL-12 (p70) [IL12(p70)], IL-17 (IL17), macrophage inflammatory protein 1α (MIP1A), macrophage inflammatory protein 1β (MIP1B), TNF-α (TNFA); antiinflammatory cytokines: IL-4 (IL4), IL-10 (IL10), and IL-13 (IL13). Data represent the mean ± SD. (E) Plasma levels of selected miRNAs in sham-operated mice (n = 10) compared with CLP-induced septic mice (n = 10). These mice were 8 months old. The relative expression level was normalized to cel-miR-39-3p and cel-miR-54-3p. Data are presented as the mean ± SD. *P < 0.05, **P < 0.01, and ***P < 0.001, by 2-tailed Student’s t test.
Figure 2
Figure 2. miR-93-5p expression in 2 baboon models of sepsis and in long-term sepsis survivors.
(A) Left panel: Plasma levels of miR-93-5p at different time points in an E. coli (Gram–) baboon sepsis model (n = 6). Purple bar represents the expression of miR-93-5p before death in baboons that died late after inoculation; red bar represents the expression of miR-93-5p before death in baboons that died early after inoculation. Middle panel: miR-93-5p dynamics in E. coli–inoculated baboons that died late (n = 3). Right panel: miR-93-5p dynamics in E. coli–inoculated baboons that died early (n = 3). (B) Left panel: Plasma levels of miR-93-5p at different time points in an S. aureus (Gram+) baboon sepsis model (n = 5). Purple bar represents the expression of miR-93-5p before death in baboons that died late after inoculation; red bar represents the expression of miR-93-5p before death in baboons that died early after inoculation. Middle panel: miR-93-5p dynamics in S. aureus–inoculated baboons that died late (n = 3). Right panel: miR-93-5p dynamics in baboons S. aureus–inoculated baboons that died early (n = 2). Expression of (C) miR-K12-12* and (D) miR-93-5p in whole blood from long-term survivors of sepsis (n = 23) at 3 different time points: day 0 = shortly after sepsis diagnosis, day 1 = 1 day after diagnosis, and day 7 = 7 days after sepsis diagnosis. The relative expression level was normalized to U6. Data are presented as the mean ± SD. ***P < 0.001 and ****P < 0.0001, by Friedman’s test. (E) Correlation between miR-93-5p levels in plasma and SOPED score (n = 59). (F) Correlation between miR-93-5p levels in plasma and the ALC (n = 48). Data were evaluated by Pearson’s correlation test (E and F).
Figure 3
Figure 3. Effect of anti–miR-93-5p therapy in the CLP-induced sepsis model.
(A) Twenty-four hours before CLP-induced sepsis, male and female C57BL/6 mice of different ages were treated i.p. with scrambled miRNA or anti–miR-93-5p. The treatment was repeated 2 hours after the induction of sepsis. Mice were followed up for 72 hours after CLP. (B) Plasma levels of miR-93-5p in septic mice treated with scrambled miRNA (n = 6) compared with septic mice treated with anti–miR-93-5p (n = 6). (C) Tissue levels of miR-93-5p in mice with sepsis treated with scrambled miRNA (n = 6) compared with septic mice treated with anti–miR-93-5p (n = 7) in organs frequently affected by sepsis: liver, heart, and kidney. (D) Pro- and antiinflammatory cytokine levels in anti–miR-93-5p–treated mice relative to levels in mice treated with scrambled miRNA. Data are presented as the mean ± SD. *P < 0.05, **P < 0.01, and ****P < 0.0001, by 2-tailed Student’s t test (BD). (E) Kaplan-Meier survival analysis for 4.5-month-old CLP-induced septic mice treated with scrambled miRNA (n = 6) versus CLP-induced septic mice treated with anti–miR-93-5p (n = 6). (F) Kaplan-Meier survival analysis for 8-month-old CLP-induced septic mice treated with scrambled miRNA (n = 6) versus CLP-induced septic mice treated with anti–miR-93-5p (n = 7). (G) Kaplan-Meier survival analysis for 16-month-old CLP-induced septic mice treated with scrambled miRNA (n = 6) versus CLP-induced septic mice treated with anti–miR-93-5p (n = 9). (H) Kaplan-Meier survival analysis for all CLP-induced septic mice treated with scrambled miRNA together (n = 18) versus all CLP-induced septic mice treated with anti–miR-93-5p together (n = 22).
Figure 4
Figure 4. Effect of anti–miR-93-5p therapy on the lymphoid and myeloid lineages.
(A) Flow cytometric characterization of circulating lymphoid and myeloid cells in 4 different mouse groups: control (no intervention), sham-operated, CLP-induced sepsis with scrambled miRNA treatment, and CLP-induced sepsis with anti–miR-93-5p treatment. Treatment was administrated 24 hours before and 2 hours after sepsis induction. Mice were sacrificed 24 hours after surgery (sham) or CLP-induced sepsis. Control mice were sacrificed together with mice in the other 3 groups. (B) Percentage of CD4+CD44+CD62Llo/neg Tem cells (CD4+ Tem) in control mice, sham-operated mice, CLP-induced septic mice treated with scrambled miRNA, and CLP-induced septic mice treated with anti–miR-93-5p mice. (C) Percentage of CD8+ Tem cells (CD8+ Tem) in all 4 groups. (D) Percentage of CSF1R+PD-L1+ cells in the entire pool of CD11b+CSF1R+ monocytes in control mice, sham-operated mice, CLP-induced septic mice treated with scrambled miRNA, and CLP-induced septic mice treated with anti–miR-93-5p. (E) Percentage of LyChi cells in the entire pool of CD11b+CSF1R+ monocytes and of (F) LyChiPD-L1+ monocytes in control mice, sham-operated mice, CLP-induced septic mice treated with scrambled miRNA, and CLP-induced septic mice treated with anti–miR-93-5p. (G) Percentage of F4/80+MRC1+ macrophages and of (H) F4/80+PD-L1+ macrophages in all 4 experimental mouse groups. (I) Schematic representation of the effect of anti–miR-93-5p therapy on hematopoiesis during sepsis. Blue rectangles mark the cell subtypes that were significantly differentially expressed in the anti–miR-93-5p–treated group versus the scrambled miRNA–treated group after adjustment for multiple testing using the FDR. Data are presented as the mean ± SD. *P < 0.05, **P < 0.01, and ***P < 0.001, by 2-tailed Student’s t test (BH). P values that are significant after adjustment for multiple testing using the FDR are highlighted in blue.
Figure 5
Figure 5. Identification of miR-93-5p target genes in sepsis and miR-93-5p upstream regulation.
(A) Schematic of the AGO2 IP method. Beads coupled to anti-AGO2 antibody or control (IgG) antibody are used to pull down the RISC complex including bound miRNA/mRNA interactors in the presence or absence of miR-93 expression. Putative miR-93 targets (n = 579) were defined as being enriched in the AGO2 IP of parental or control cells but not miR-93–KO cells. (B) Pathway analysis on 570 putative miR-93 target genes showed strong enrichment for previously known mRNA targets (miRTarBase) of miR-93 or other miR-17 family members that share the same seed sequence. The top 9 most enriched are shown. (C) Forty-three genes with immune functions that were identified in the AGO2 IP and validated (purple) or predicted (black) targets of miR-93-5p were assessed in JURKAT miR-93–KO cells compared with control by RT-qPCR. Bars indicate the mean fold change (FC) in gene expression in the KO 1 and KO 2 samples relative to control (control = 1). (D) STAT1 protein expression measured by Western blotting in cell lysates of JURKAT shControl, JURKAT shSTAT1_A, and shSTAT1_B cells. (E) STAT1 mRNA expression, (F) IL4 mRNA expression, and (G) miR-93-5p measured by RT-qPCR in JURKAT shControl, and JURKAT shSTAT1_A, and shSTAT1_B cells.
Figure 6
Figure 6. Confirmation of dysregulated miR-93-5p target genes in 2 baboon sepsis models.
(A) The 579 putative miR-93 target genes were overlapped with genes that showed an opposite expression (i.e., downregulation) with miR-93 levels in the 2 baboon models (gray and yellow circles). Of the 465 genes that could be assigned to a baboon ortholog (of 579 IP enriched genes; 80%), 215 and 193 were downregulated upon injection with E. coli and S. aureus, respectively. In addition, this set of genes was overlapped with predicted and validated targets of mir-93-5p as extracted from miRWalk and miRTarBase (red circle). (B) Downregulation of CD28, CD160, ZAP70, MAP3K3, and MAP4K2 upon sepsis induction in the S. aureus– and E. coli–mediated baboon models. **Q < 0.01, ***Q < 0.001, and ****Q < 0.0001, by moderate t test. Results were also adjusted to the subject effects using the LMM; significant P values after adjustment are highlighted in blue. (C) Pathway analysis of the 190 genes that were IP enriched, downregulated in either E. coli– or S. aureus–induced sepsis, or both in baboons and predicted targets of miR-93-5p. BioPlanet 2019 pathways with a P value of less than 0.01 are shown. CD28 and STAT3 are validated targets of miR-93-5p. fact., factor; interact., interaction; sign., signaling; transd., transduction; rec., receptor; path., pathway; Transp., transport; subseq., subsequent; mod., modification; inflam., inflammatory; Select., selective; exp., expression; rec., receptors; polar., polarization; initiat., initiation; activ., activation; surf., surface; mol., molecular; apopt., apoptosis.

References

    1. Singer M, et al. The third international consensus definitions for sepsis and septic shock (Sepsis-3) JAMA. 2016;315(8):801–810. doi: 10.1001/jama.2016.0287. - DOI - PMC - PubMed
    1. Rudd KE, et al. Global, regional, and national sepsis incidence and mortality, 1990-2017: analysis for the Global Burden of Disease Study. Lancet. 2020;395(10219):200–211. doi: 10.1016/S0140-6736(19)32989-7. - DOI - PMC - PubMed
    1. Rhee C, et al. Incidence and trends of sepsis in US hospitals using clinical vs claims data, 2009-2014. JAMA. 2017;318(13):1241–1249. doi: 10.1001/jama.2017.13836. - DOI - PMC - PubMed
    1. Liu V, et al. Hospital deaths in patients with sepsis from 2 independent cohorts. JAMA. 2014;312(1):90–92. doi: 10.1001/jama.2014.5804. - DOI - PubMed
    1. Gaieski DF, et al. Benchmarking the incidence and mortality of severe sepsis in the United States. Crit Care Med. 2013;41(5):1167–1174. doi: 10.1097/CCM.0b013e31827c09f8. - DOI - PubMed

Publication types