. 2023 Jul 24;8(14):e170181.
doi: 10.1172/jci.insight.170181.

Mucosal transcriptomics highlight lncRNAs implicated in ulcerative colitis, Crohn's disease, and celiac disease

Affiliations

Mucosal transcriptomics highlight lncRNAs implicated in ulcerative colitis, Crohn's disease, and celiac disease

Tzipi Braun et al. JCI Insight. .

Abstract

Ulcerative colitis (UC), Crohn's disease (CD), and celiac disease are prevalent intestinal inflammatory disorders with nonsatisfactory therapeutic interventions. Analyzing patient data-driven cohorts can highlight disease pathways and new targets for interventions. Long noncoding RNAs (lncRNAs) are attractive candidates, since they are readily targetable by RNA therapeutics, show relative cell-specific expression, and play key cellular functions. Uniformly analyzing gut mucosal transcriptomics from 696 subjects, we have highlighted lncRNA expression along the gastrointestinal (GI) tract, demonstrating that, in control samples, lncRNAs have a more location-specific expression in comparison with protein-coding genes. We defined dysregulation of lncRNAs in treatment-naive UC, CD, and celiac diseases using independent test and validation cohorts. Using the Predicting Response to Standardized Pediatric Colitis Therapy (PROTECT) inception UC cohort, we defined and prioritized lncRNA linked with UC severity and prospective outcomes, and we highlighted lncRNAs linked with gut microbes previously implicated in mucosal homeostasis. HNF1A-AS1 lncRNA was reduced in all 3 conditions and was further reduced in more severe UC form. Similarly, the reduction of HNF1A-AS1 ortholog in mice gut epithelia showed higher sensitivity to dextran sodium sulfate-induced colitis, which was coupled with alteration in the gut microbial community. These analyses highlight prioritized dysregulated lncRNAs that can guide future preclinical studies for testing them as potential targets.

Keywords: Gastroenterology; Inflammatory bowel disease.


Figures
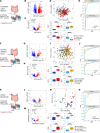
Figure 1
Figure 1. Dysregulated lncRNAs atlas in UC rectum, CD ileum, and celiac duodenum.
(A, F, and K) Schemes of test and validation cohorts used for each disease (Supplemental Table 1). (A) UC rectum PROTECT test (206 UC and 20 controls) and RISK validation (43 UC and 55 controls). (F) CD ileum SOURCE test (18 CD and 25 controls) and RISK validation (213 CD and 47 controls). (K) Celiac duodenum SEEM test (17 celiac cases and 25 controls) and PRJNA528755 validation (12 celiac and 15 controls). (B, G, and L) Volcano plots of differentially expressed lncRNAs between disease and control in the test cohorts: PROTECT, SOURCE, SEEM (FC ≥ 1.5, FDR ≤ 0.05). (C, H, and M) Volcano-like plots of the validation cohorts, showing log (FC) and –log10(Q value) values for DE genes obtained in the test cohorts: RISK UC (C), RISK CD (H), PRJNA528755 celiac (M). The direction of change in the test cohort is marked by color. (D, I, and N) PCA of test and validation cohorts: PROTECT and RISK UC (D), SOURCE and RISK CD (I), SEEM and PRJNA528755 celiac (N). lncRNA that passed DE in the test cohorts were used. PC1 and PC2 values box plots for cases and controls within each cohort. (E, J, and O) Receiver operating characteristic (ROC) curves of random forest (RF) analysis trained on the test cohort and tested on both test and validation cohorts showing accurate classification of most cases and controls using either lncRNA or protein-coding gene expression: UC rectum (E), CD ileum (J), celiac duodenum (O). **P < 0.01, ***P < 0.001, Mann-Whitney U test.
Figure 2
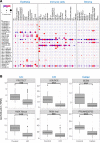
Figure 2. Expression of the lncRNAs in UC, CD, and celiac.
(A) Cellular expression of the lncRNAs that were dysregulated in UC, CD, and celiac and included (32 of 45) in adult colon single-cell RNA-Seq data set (26). The size and color of the dots are proportional to the percentage of cells expressing the gene and the normalized expression, respectively. (B) Box plots showing GATA6-AS1 expression between cases and control in all 6 cohorts: PROTECT UC (206 UC and 20 controls) and RISK UC rectal (43 UC and 55 controls), SOURCE (18 CD and 25 controls) and RISK CD ileal (213 CD and 47 controls), SEEM celiac (17 celiac cases and 25 controls), and the celiac cohort (PRJNA528755, 12 celiac and 15 controls). Similar box plots are available for all lncRNAs expressed in 1 of 3 main cohorts in https://tzipi.shinyapps.io/lncRNA_gut/ (28). ***P < 0.001, Mann-Whitney U test.
Figure 3
Figure 3. lncRNAs show more location-specific expression along the small and large intestine than do protein-coding genes.
(A) Scheme of the control samples from 3 main and 3 validation cohorts: 2 rectum cohorts (PROTECT, n = 20, RISK, n = 55), 2 ileum cohorts (SOURCE, n = 25, RISK, n = 47), and 2 duodenum cohorts (SEEM, n = 25, PRJNA52875, n = 15). (B) Box plot showing the mean TPM values of all expressed protein-coding genes and lncRNAs of these control samples. ***q < 0.001, Mann-Whitney U test with FDR correction. (C) Venn diagrams indicating the number of expressed lncRNAs (left) and protein-coding genes (right) in control samples in the 3 main test cohorts that were processed similarly (TPM > 1 in at least 20% of samples); 48% of all lncRNAs and 89% of protein-coding genes are shared along these 3 locations in the GI tract. (D) Examples of lncRNAs TPM values in controls using all 6 main test and validation cohorts, showing expression in control rectum, ileum, and duodenum (28). Graphs’ central lines indicate median and lateral lines represent upper and lower quartiles.
Figure 4
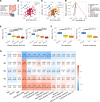
Figure 4. Ulcerative colitis mucosal transcriptomes reveal lncRNA landscape linked with personalized disease severity and treatment response.
(A) Scheme for the PROTECT transcriptomics (206 UC and 20 controls). The scheme was created with biorender.com. (B andC) PCA using 2,378 lncRNAs that passed expression filtering in PROTECT, colored by diagnosis (B) and disease severity (C). Pediatric Ulcerative Colitis Activity Index (PUCAI): mild, 10−30; moderate, 35−60; and severe, 65 or higher. (D) Spearman’s correlation between clinical metadata and lncRNAs PCA’s PC1 (22.8% variation) and PC2 values (13.2% variation) showing significant correlations with PC1 or PC2 values (P ≤ 0.05); PC1 and PC2 r values mark the arrowhead x axis and y axis coordinates, respectively. (E) Box plots of PC2 values stratified by clinical (left, PUCAI; 53 mild, 85 moderate, 68 severe UC cases) and endoscopic severity (right, endoscopic Mayo score: 27 Mayo 1, 108 Mayo 2, 71 Mayo 3 UC cases stratified by endoscopic severity). (F) Box plots of PC2 values stratified by UC course (left, week 4 remissions after 5-ASA/steroids: 105 W4R and 101 no W4R; right, colectomy within 3 years: 189 no colectomy and 17 had colectomy). *q < 0.05, **q < 0.01 ***q < 0.001, calculated using Mann-Whitney U test with Benjamini-Hochberg FDR correction. (G) WGCNA lncRNAs coexpression modules heatmap (represented by module eigengenes and numbered M1–M5), which were correlated with UC diagnosis (P < 0.001, Supplemental Data 1 includes all modules) and the indicative clinical features. Data are shown as the correlation coefficient and P value for each comparison. All clinical data besides the outcome data are from the time of diagnosis. Graphs’ central lines indicates median and lateral lines represent upper and lower quartiles.
Figure 5
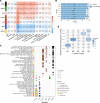
Figure 5. lncRNA prioritization and inferred function from coexpression with protein-coding genes.
(A) WGCNA coexpression modules heatmap that includes lncRNAs and protein-coding genes, generated using the PROTECT cohort (206 UC and 20 controls). Modules that were correlated with UC diagnosis (P < 0.001) and other clinical features are shown. Numbers represent the correlation coefficient and P value for each comparison. (B) For each WGCNA module associated with disease and for all modules combined, the fraction of lncRNAs and protein-coding genes are marked on the x axis, and the actual number of genes is written within the bar. (C) ToppGene/ToppCluster functional annotation enrichment of protein-coding genes within each module. FDR is shown as circle size; selected annotations origin database is marked on the y axis (full list in Supplemental Data 1). (D) Heatmap showing the overlap between UC lncRNA–only modules (numbered M1–M5), and UC lncRNA plus protein-coding gene modules (colored). For each lncRNA module, the number of lncRNAs shared between lncRNAs plus protein-coding gene modules is noted as well as the percentage of those lncRNAs of the lncRNAs-only WGCNA modules.
Figure 6
Figure 6. lncRNAs showing UC severity predict outcomes similar to protein-coding genes and are associated with the gut microbiome.
(A) Volcano plot of the 192 differentially expressed lncRNAs between 53 patients with mild UC and 68 patients with severe UC (FC ≥ 1.5, FDR ≤ 0.05). (B and C) Receiver operating characteristic (ROC) curves of random forest (RF) analysis using either the 960 protein-coding genes or the 192 lncRNA severity-associated genes, or both lncRNAs and protein-coding genes, for W4 early response and for W52SFR in the moderate-severe patients’ group (n = 153) that received standardized initial treatment with corticosteroids. The graph showed 1 representative iteration out of 100 RF performed iterations. The mean ROC AUC for W4, using the lncRNA was 0.68 (min, 0.65; max, 0.70), which was similar to those obtained using only the protein-coding genes (mean, 0.67; min, 0.65; max, 0.69), and those obtained using both lncRNAs and protein-coding genes (mean, 0.67; min, 0.65; max, 0.69). For W52SFR, the mean ROC AUC using the lncRNA was 0.63 (min, 0.60; max, 0.66), the mean ROC AUC using the protein-coding was 0.65 (min, 0.63; max, 0.67) and the mean ROC AUC using both lncRNAs and protein-coding genes was 0.65 (min, 0.62; max, 0.67). (D) Heatmap showing significant differential bacterial ASVs (47 ASVs more abundant in mild and 12 more abundant in severe cases) between 38 samples from patients with mild UC and 54 samples from patients with severe UC (rank-mean test with FDR < 0.1). Each row represents an ASV, and each column is a patient sample (38 mild, 64 moderate, 54 severe). (E) Heatmap summarizing the association between lncRNA expression and microbial ASV abundance using HAllA testing, with FDR < 0.1, using the 156 samples with matching microbial ASV and lncRNA expression data.
Figure 7
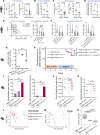
Figure 7. HNF1A-AS1 reduction is linked with UC severity.
(A and B) HNF1A-AS1 expression is reduced in CD ileum (A and B) — SOURCE (18 CD, 25 control [Ctl]) and RISK (213 CD, 47 Ctl) bulk biopsies and isolated epithelia (38) (25 CD, 27 Ctl) — and in UC rectum (C and D) —PROTECT (206 UC, 20 Ctl) and RISK (43 UC, 55 Ctl) bulk biopsies and isolated epithelia (16 UC and 16 Ctl). (E and F) HNF1A-AS1 at baseline is further reduced in UC cases with more severe clinical and endoscopic phenotype (E) and in those with less favorable outcome — week4 and week52 nonresponders (noR), or required colectomy within 3 years (F). Mice experiments included HNF1A-AS1intestine–/– (intestine-specific deletion of the HNF1A-AS1 promotor), HNF1A-AS1+/+, and HNF1A-AS1intestine+/–. (G) HNF1A-AS1 was significantly reduced in rectal tissue of HNF1A-AS1intestine–/– in comparison HNF1A-AS1+/+, Kruskal-Wallis test with Dunn’s correction, n = 4. Mice were treated with DSS (2.5%) for 5 days, followed by 6 days of water washout. (H) Kaplan-Meier survival curve during the experiment and differences between groups were calculated using the Mantel-Cox test. (I) Rectal bleeding was recorded (Left: bleeding duration more than one day. Right, bleeding duration more than 2 days). Differences were calculated using 2-sided Fisher exact test. (J) Colon weight to length (colon mass) at the end of the experiment. Histopathological evaluation using a predefined histologic scoring focusing on Inflammation score & percent of the involved region. (K) Differences between groups were tested using a 2-tailed t test. (L and M) PCoA Plot of fecal microbiome prior to the DSS treatment (Day 1) colored by mice group (L) or cage (M) n = 52. α Divesity (Faith’s phylogenetic) between HNF1A-AS1+/+ (n = 20), HNF1A-AS1intestine+/– (n = 8), and HNF1A-AS1intestine –/– (n = 24), prior to the DSS treatment (Day1). The q values were calculated using Mann-Whitney U test with FDR correction (N). *P ≤ 0.05, **P ≤ 0.01, ***P ≤ 0.001, ****P ≤ 0.0001 Mann-Whitney test. Graphs central line indicates median and lateral lines represent upper and lower quartiles.

References

    1. Fasano A, Catassi C. Clinical practice. Celiac disease. N Engl J Med. 2012;367(25):2419–2426. doi: 10.1056/NEJMcp1113994. - DOI - PubMed
    1. Peery AF, et al. Burden of gastrointestinal disease in the United States: 2012 update. Gastroenterology. 2012;143(5):1179–1187. doi: 10.1053/j.gastro.2012.08.002. - DOI - PMC - PubMed
    1. Rubio-Tapia A, et al. Increased prevalence and mortality in undiagnosed celiac disease. Gastroenterology. 2009;137(1):88–93. doi: 10.1053/j.gastro.2009.03.059. - DOI - PMC - PubMed
    1. Hyams JS, et al. Clinical outcome of ulcerative colitis in children. J Pediatr. 1996;129(1):81–88. doi: 10.1016/S0022-3476(96)70193-2. - DOI - PubMed
    1. Burisch J, et al. Natural disease course of Crohn’s disease during the first 5 years after diagnosis in a European population-based inception cohort: an Epi-IBD study. Gut. 2019;68(3):423–433. doi: 10.1136/gutjnl-2017-315568. - DOI - PubMed

Publication types

Substances