. 2023 Aug 1;133(15):e170733.
doi: 10.1172/JCI170733.

Macrophage-endothelial cell crosstalk orchestrates neutrophil recruitment in inflamed mucosa

Affiliations

Macrophage-endothelial cell crosstalk orchestrates neutrophil recruitment in inflamed mucosa

Xingsheng Ren et al. J Clin Invest. .

Abstract

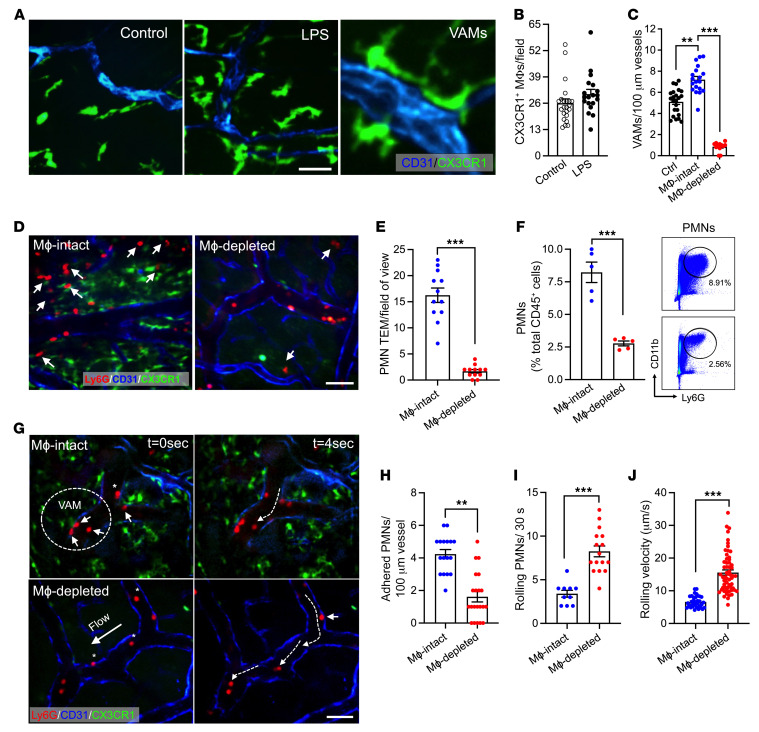
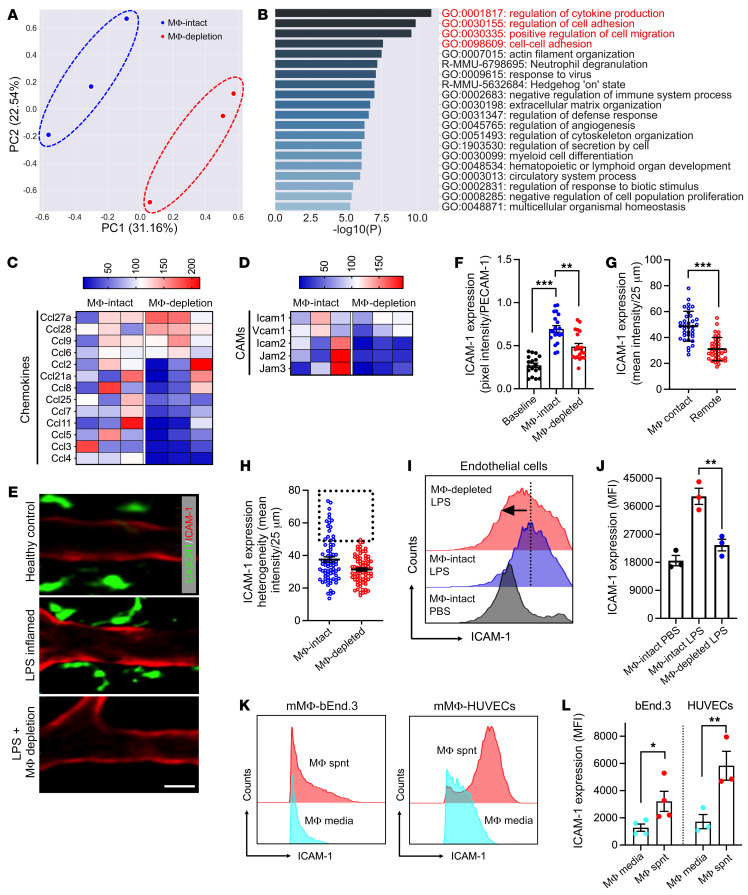
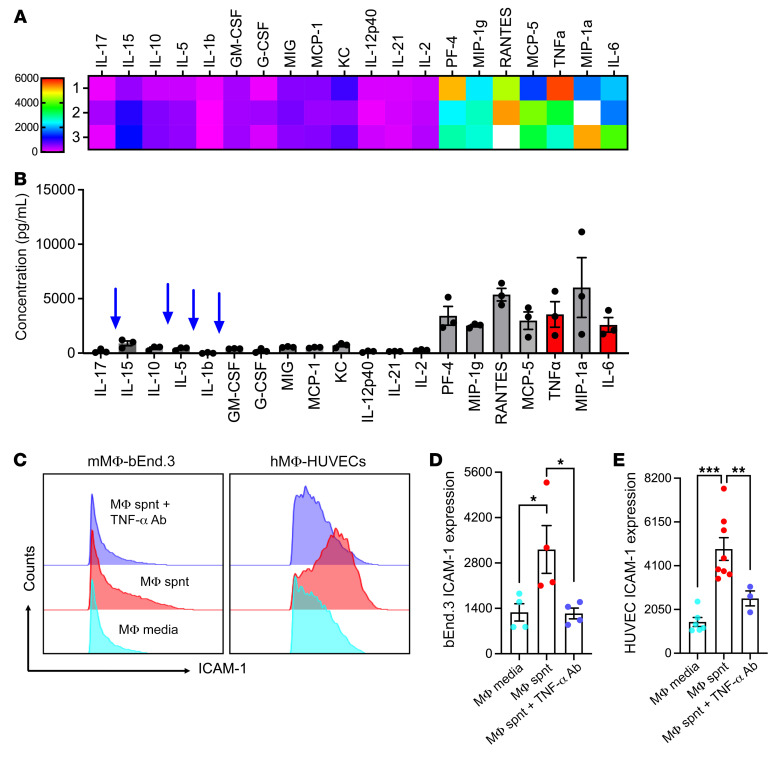
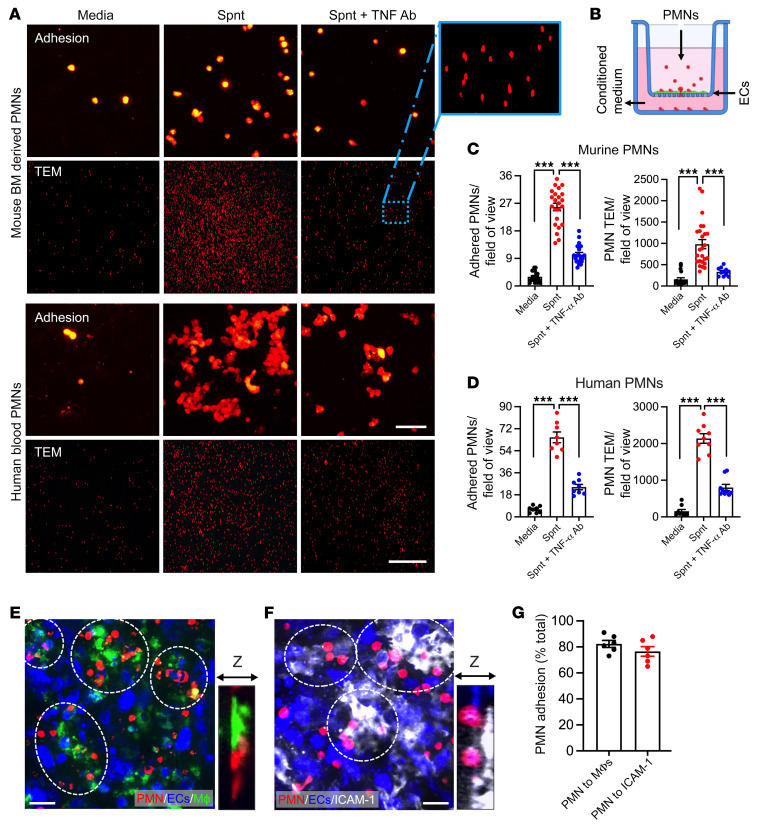
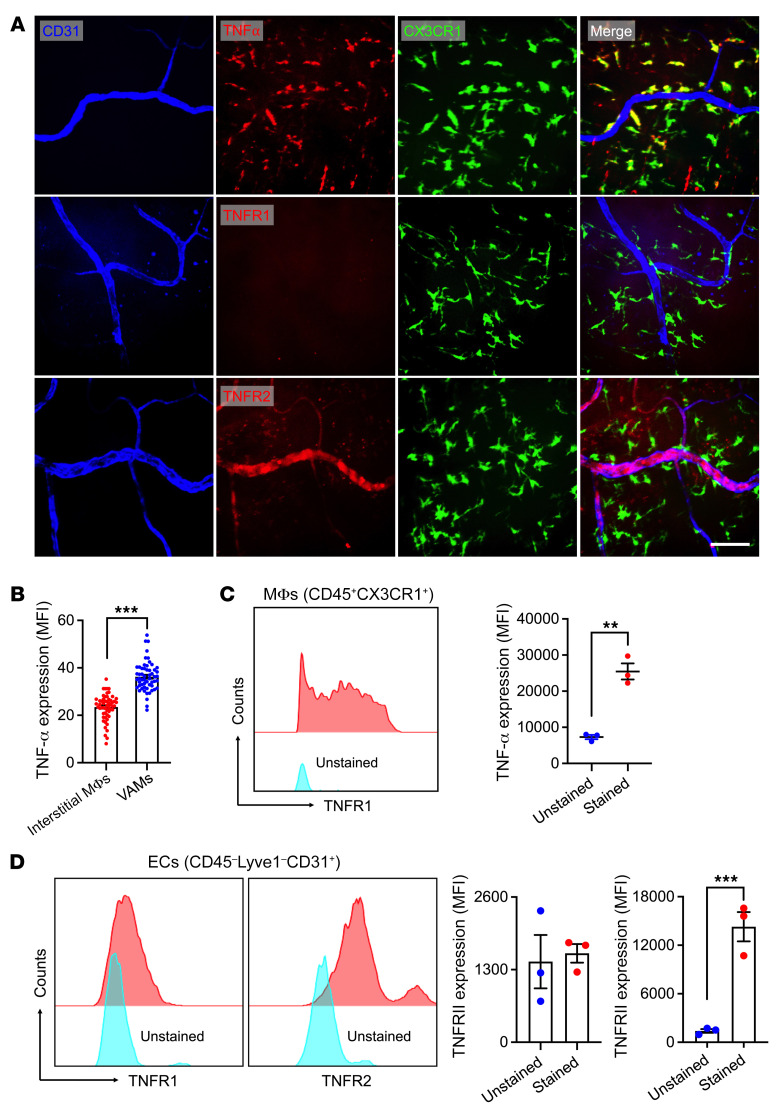
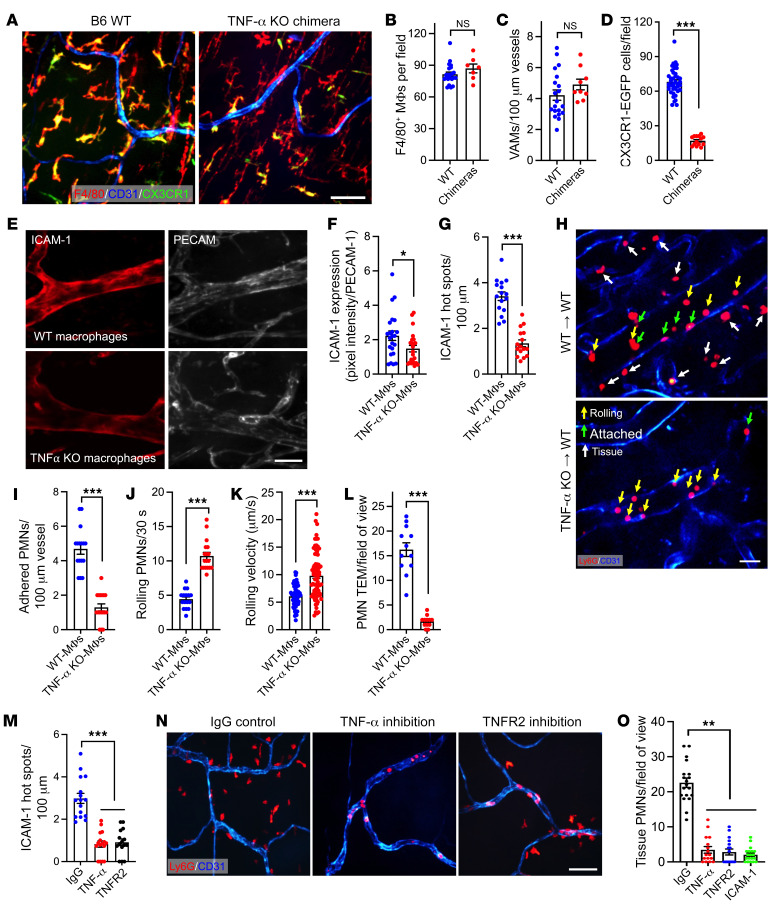
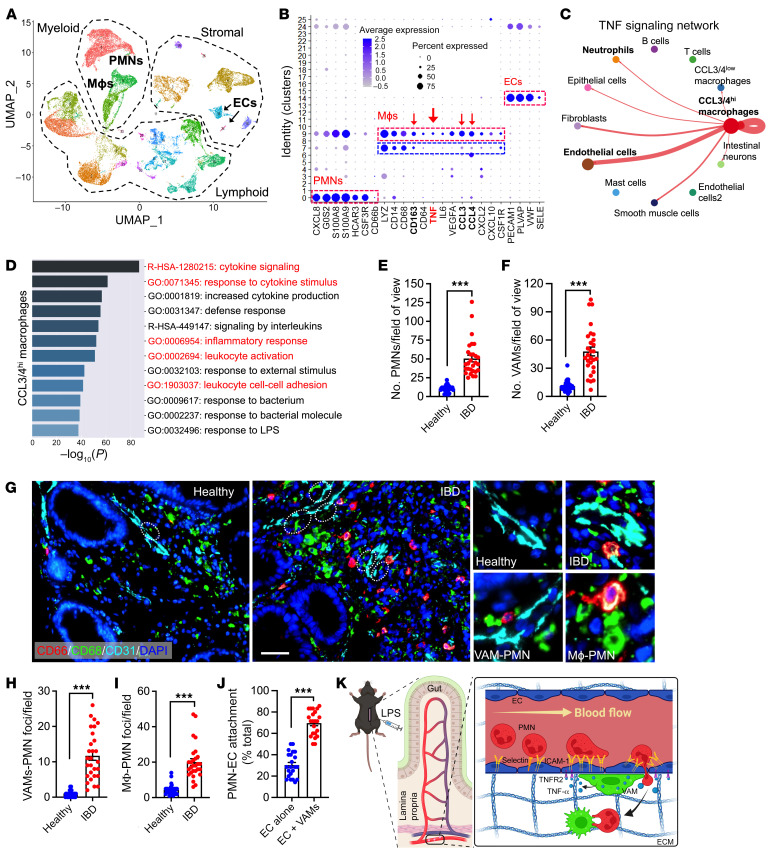
Neutrophil (PMN) mobilization to sites of insult is critical for host defense and requires transendothelial migration (TEM). TEM involves several well-studied sequential adhesive interactions with vascular endothelial cells (ECs); however, what initiates or terminates this process is not well-understood. Here, we describe what we believe to be a new mechanism where vessel-associated macrophages through localized interactions primed EC responses to form ICAM-1 "hot spots" to support PMN TEM. Using real-time intravital microscopy of LPS-inflamed intestines in CX3CR1-EGFP macrophage-reporter mice, complemented by whole-mount tissue imaging and flow cytometry, we found that macrophage vessel association is critical for the initiation of PMN-EC adhesive interactions, PMN TEM, and subsequent accumulation in the intestinal mucosa. Anti-colony stimulating factor 1 receptor Ab-mediated macrophage depletion in the lamina propria and at the vessel wall resulted in elimination of ICAM-1 hot spots impeding PMN-EC interactions and TEM. Mechanistically, the use of human clinical specimens, TNF-α-KO macrophage chimeras, TNF-α/TNF receptor (TNF-α/TNFR) neutralization, and multicellular macrophage-EC-PMN cocultures revealed that macrophage-derived TNF-α and EC TNFR2 axis mediated this regulatory mechanism and was required for PMN TEM. As such, our findings identified clinically relevant mechanisms by which macrophages regulate PMN trafficking in inflamed mucosa.

Keywords: Cell Biology; Cell migration/adhesion; Inflammation; Macrophages; Neutrophils.


Conflict of interest statement

Conflict of interest: The authors have declared that no conflict of interest exists.

Figures

Figure 1
Figure 1. Macrophages promote PMN adhesion and TEM in inflamed intestinal mucosa.
Inflammation of the intestinal mucosa was induced by i.p. administration of LPS (100 μg, 24 hours). (A) Representative whole-mount confocal microscopy images using CX3CR-EGFP reporter mice showing interstitial macrophage recruitment and association with blood vessels during LPS-induced inflammation. Scale bar: 20 μm. (B) Quantification of CX3CR1+ macrophage (MΦ) numbers per field of view and (C) VAMs per vessel length. Blood vessels were visualized using PECAM-1 (CD31, blue) staining. (DJ) Intravital microscopy (IVM) of inflamed intestines was performed on CX3CR1-EGFP mice with and without macrophage depletion with a CSF-1R Ab (400 μg/mouse, every other day for 3 weeks). PMNs were labeled by a low dose of fluorescently labeled anti-Ly6G Ab (2 μg, i.v.). (D) Representative images of VAM depletion and PMN tissue infiltration by IVM. Scale bar: 20 µm. Arrows indicate extravasated PMNs. (E) Quantification of tissue PMNs by IVM and (F) by flow cytometry of digested intestinal lamina propria. A representative flow diagram is shown (right). (G) Representative time-lapse images (based on a real-time acquisition) show decreased adherent PMN and increased displacement (dotted white arrows) of rolling PMNs in macrophage-depleted animals. Solid white arrows denote adherent PMNs in area of VAM-EC contact. Scale bar: 20 μm. (H) Quantification of adherent and (I) rolling PMN (per 30 seconds) and (J) rolling velocities of individual PMNs with and without macrophage depletion. For whole-mount preparation, images are representative of n = 4–5 mice per condition. For IVM, n = 3–5 mice per condition. **P < 0.01, ***P < 0.001. Two-sided Student’s t test. Data represent mean ± SEM.
Figure 2
Figure 2. VAMs prime gut EC activation.
(AD) CD45LYVE1CD31+ ECs were FACS-sorted from LPS-stimulated intestinal lamina propria with and without macrophage depletion and subjected to mRNA sequencing. (A) Principal component analysis comparing macrophage-intact/-depleted (MΦ-intact/MΦ-depletion) conditions based on differentially expressed genes (DEGs). (B) Gene ontology (GO) pathway enrichment analysis of DEGs. The top 20 enriched terms are shown. (C) Expression heatmaps of chemokines and (D) cellular adhesion molecules (CAMs) relevant to PMNs indicate macrophage priming of EC responses. Color scales represent percentage change in gene expression. (EH) CSF-1R Ab–mediated macrophage depletion in control or LPS-stimulated CX3CR1-EGFP mice. To visualize and quantify EC ICAM-1 expression, a low dose of fluorescently labeled anti–ICAM-1 Ab (2 μg, i.v.) was used (red). (E) Representative whole-mount confocal microscopy images show VAM localization to high ICAM-1 regions with LPS stimulation and loss of local ICAM-1 enrichment with macrophage depletion. Scale bar: 20 µm. (F) Quantification of ICAM-1 expression normalized to PECAM-1 staining to account for tissue depth variation. (G) Quantification of the relative ICAM-1 expression per 25 μm vessel segments with and without macrophage contact. (H) Comparison of the relative ICAM-1 expression per 25 μm vessel segments with and without macrophage depletion. Dotted region highlights the loss of ICAM-1 hot spots. (I) Quantification and (J) representative flow diagram of mucosal EC ICAM-1 expression by flow cytometry. (K) Representative flow diagrams and (L) quantification of ICAM-1 expression in cultured mouse (bEnd.3) and human (HUVEC) ECs, respectively, treated with conditional media from murine BM-derived and human THP-1 monocytic cell line, differentiated with IFN-γ/LPS so that they resemble tissue inflammatory macrophages. For whole-mount preparations, images are representative of n = 3–5 mice, with each data point representing a field of view. For flow cytometry, n = 3–4 independent experiments. Spnt, supernatant. *P < 0.05, **P < 0.01, ***P < 0.001. Two-sided Student’s t test and 1-way ANOVA with Tukey’s multiple comparison test. Data are presented as mean ± SEM.
Figure 3
Figure 3. Macrophages upregulate EC ICAM-1 via the release of TNF-α.
(A and B) Conditioned media from murine IFN-γ/LPS-differentiated BM-derived macrophages was subjected to targeted (40-target) cytokine array. (A) Heatmap and (B) detected concentration of the most highly expressed cytokines. (CE) Cultured murine (bEnd.3) and human (HUVEC) ECs were treated with BM-derived and human THP-1 monocytic cell line conditioned media, respectively, with and without cotreatment with anti–TNF-α inhibitory Abs. (C) Representative flow diagram and (D and E) quantification of EC ICAM-1 expression. Cytokine array data are representative of 3 independent experiments. For flow cytometry, n = 4–8 independent experiments. Spnt, supernatant. *P < 0.05, **P < 0.01, ***P < 0.001. One-way ANOVA with Tukey’s multiple comparison test. Data are presented as mean ± SEM.
Figure 4
Figure 4. Macrophages regulate PMN adhesion and TEM via TNF-α–dependent EC ICAM-1 induction.
(AD) Murine/human PMN adhesion and TEM across murine bEnd.3 or human HUVECs were examined using a Transwell setup. Murine BM-PMNs and human blood PMNs were fluorescently stained using Cell Tracker Orange, stimulated with fMLF (500 nM and 200 nM, respectively, 10 min), and were induced to adhere/migrate across ECs by introducing BM-derived or human THP-1 cell–conditioned media with and without Ab TNF-α neutralization against the bottom chamber. (A) Representative images reveal decreased PMN adhesion (PMNs on filters) and TEM (depicting PMNs that have migrated to the bottom chamber) with TNF-α inhibition. Scale bars: 20 μm (adhesion); 100 μm (TEM). The zoom-in region shown in the dotted box is a ×10 magnification of the original image. (B) Schematic depicting the experimental setup. (C) Quantification of murine and (D) human PMN adhesion and TEM. (EG) A triple coculture of PMN, EC, and macrophages was used, where LPS/IFN-γ–stimulated CX3CR1-EGFP (green) macrophages washed of remanence of stimulation media were added to the basal side of cultured confluent EC monolayers (inverted orientation) followed by Cell Tracker Orange–labeled PMN addition to the apical side (top chamber). (E) Representative Z-stack projection (~40 μm) image shows localized PMN (red) attachment to ECs (blue) in regions of macrophage (green) contact (highlighted by white dotted circles). Zoom-in image depicts close PMN-macrophage contact. Sale bar: 20 μm. (F) Representative Z-stack projection images of ICAM-1–stained EC monolayers (following PMN attachment) show preferential PMN binding to high EC ICAM-1 expression regions. Zoom-in image depicts PMN binding to EC ICAM-1. Scale bar: 20 μm. (G) Quantification for PMN adhesion frequency to regions of macrophage contacts and regions enriched for ICAM-1 expression. n = 4 independent experiments in duplicates per condition. ***P < 0.001. One-way ANOVA with Tukey’s multiple comparison test. Data are presented as mean ± SEM.
Figure 5
Figure 5. Inflamed intestinal ECs express TNFR2 to interact with VAM-derived TNF-α.
(A and B) Combined in situ and whole-mount staining and confocal microscopy was performed on CX3CR-EGFP reporter mice to examine expression of TNF-α and its receptors TNFR1 and TNFR2. (A) Representative images show TNF-α expression (red) by interstitial macrophages (elevated specifically in VAMs). TNFR2 but not TNFR1 is expressed by gut ECs. Scale bar: 25 μm. (B) Quantification of mean fluorescence intensity (MFI) in interstitial macrophages remote from vessels and in VAMs. (C and D) Flow cytometry–based analyses were performed on LPS-stimulated, digested intestinal mucosa. (C) Quantification of TNF-α expression in CD45+CX3CR1+ gut macrophages and (D) TNFR1/TNFR2 in CD45LYVE1CD31+ ECs. For whole-mount preparations, images are representative of n = 4 independent experiments. Each data point represents a field of view. For flow cytometry, n = 3 independent experiments. **P < 0.01, ***P < 0.001. Two-sided Student’s t test. Data are presented as mean ± SEM.
Figure 6
Figure 6. Macrophage TNF-α and EC TNFR2 axis regulates PMN TEM.
(AD) TNF-α–KO or control WT macrophage chimeras were generated to test whether macrophage-derived TNF-α promotes PMN TEM. (A) Representative whole-mount confocal microscopy images show near-complete loss of host CX3CR1 macrophages and repopulation by donor (nonfluorescent, F4/80+) macrophages 8 weeks following grafting. Scale bar: 25 μm. (B) Quantification of total (F4/80+) repopulating donor macrophages, (C) VAMs per vessel length, and (D) reduction in host CX3CR1 macrophages 8 weeks following grafting. (E) Representative whole-mount confocal microscopy images and (F) quantification, showing reduced ICAM-1 expression (in situ fluorescence labeling, red) relative to PECAM-1 (CD31, blue) in TNF-α–KO macrophage chimeras. Scale bar: 20 µm. (G) Quantification of ICAM-1 hot spots per vessel length in TNF-α–KO and WT macrophage chimeras. (H) Representative time lapse intravital microscopy (IVM) images show decreased rolling (yellow arrows) and increased PMN adhesion (green arrows) in WT chimeras, whereas PMN adhesion was substantially reduced in TNF-α–KO macrophage chimeras. Scale bar: 20 μm. (I) Quantification of PMN adhesion from IVM, (J) PMN rolling (per 30 seconds recordings), (K) rolling velocity, and (L) extravasated tissue PMNs (white arrows in H). (MO) WT mice were pretreated with IgG control or neutralizing Abs against TNF-α (400 μg, i.p.), TNFR2, or ICAM-1 (400 μg, i.v.). (M) Quantification of ICAM-1 hot spots per vessel length using in situ fluorescence labeling. (N) Representative whole-mount confocal microscopy images and (O) quantification, showing a reduced number of extravasated PMNs with TNF-α/TNFR2/ICAM-1 neutralization (PMNs stained for Ly6G, red). Scale bar: 25 μm. For whole-mount preparations, images are representative of n = 6 independent experiments. For IVM, n = 3–5 mice per condition. *P < 0.05, **P < 0.01, ***P < 0.001. Two-sided Student’s t test and 1-way ANOVA with Tukey’s multiple comparison test. Data are presented as mean ± SEM.
Figure 7
Figure 7. Evidence of VAM recruitment and VAM-EC-PMN interactions in clinical IBD specimens.
(AD) Single-cell RNA-Seq was performed on biopsies from patients with active UC. (A) Uniform manifold approximation and projection (UMAP) analyses of integrated data from 4 patients with IBD. (B) Dot plot showing scaled expression of selected signature genes for PMN, macrophage, and EC clusters. Gene expression in each cluster was scaled across all clusters. Dot size represents the percentage of cells in each cluster, and color indicates expression (number of reads). (C) Outgoing communication pattern analyses by CellChat, specifically focused on network centrality analysis of inferred TNF-α signaling with macrophages defined as senders. Interaction strengths are shown/scaled between annotated seurat clusters. (D) GO analysis of DEGs for the CCL3/4hi macrophage cluster. The top 12 GO enrichment terms are shown. Analyses were performed with a Fisher’s exact test, with P < 0.01. Terms shown in red highlight more relevant terms consistent with observations made in a murine model. (EJ) Multiplex immunofluorescence staining was performed on healthy biopsied tissue and biopsied tissue from patients with active UC (n = 4 patient/conditions). (E) Quantification from multiplex imaging of PMN tissue infiltration and (F) VAM numbers. (G) Representative multiplex immunofluorescence images. White dotted circles highlight VAMs. Scale bar: 50 μm. Zoom-in panels (on the right) depict healthy and inflamed vessels with respective recruitment of VAMs. PMNs leaving the vessels specifically at a region of VAM contact and PMN-macrophage interactions in the interstitial are shown. (H and I) Quantification of VAM and interstitial macrophage interactions with PMNs and (J) the frequency of PMN-EC interactions specifically at regions of EC-VAM contact or ECs remote from VAMs (ECs alone). For all image analyses, 5–8 images per patient were analyzed. Each data point represents a field of view. (K) Representation schematic summarizing the mechanistic VAM regulation of EC function and PMN TEM. ***P < 0.001. Two-sided Student’s t test. Data are presented as mean ± SEM.

References

    1. Guan WJ, et al. Clinical characteristics of Coronavirus disease 2019 in China. N Engl J Med. 2020;382(18):1708–1720. doi: 10.1056/NEJMoa2002032. - DOI - PMC - PubMed
    1. Kovach MA, Standiford TJ. The function of neutrophils in sepsis. Curr Opin Infect Dis. 2012;25(3):321–327. doi: 10.1097/QCO.0b013e3283528c9b. - DOI - PubMed
    1. Butin-Israeli V, et al. Neutrophil-induced genomic instability impedes resolution of inflammation and wound healing. J Clin Invest. 2019;129(2):712–726. doi: 10.1172/JCI122085. - DOI - PMC - PubMed
    1. Ley K, et al. Getting to the site of inflammation: the leukocyte adhesion cascade updated. Nat Rev Immunol. 2007;7(9):678–689. doi: 10.1038/nri2156. - DOI - PubMed
    1. Sumagin R, et al. LFA-1 and Mac-1 define characteristically different intralumenal crawling and emigration patterns for monocytes and neutrophils in situ. J Immunol. 2010;185(11):7057–7066. doi: 10.4049/jimmunol.1001638. - DOI - PMC - PubMed

Publication types

MeSH terms

Substances