

Population pharmacokinetic model of ivermectin in mass drug administration against lymphatic filariasis
- PMID: 37262040
- PMCID: PMC10234547
- DOI: 10.1371/journal.pntd.0011319
Population pharmacokinetic model of ivermectin in mass drug administration against lymphatic filariasis
Abstract
Background: Ivermectin (IVM) is a broad-spectrum anthelmintic drug used to treat diseases caused by filarial worms, such as onchocerciasis and lymphatic filariasis (LF). IVM is part of a triple-drug therapy used by the Mass Drug Administration (MDA) as a preventive strategy to eradicate LF in sub-Saharan Africa. The drug shows high variability in drug exposure in previous pharmacokinetic studies. This study aims to build a population pharmacokinetic (PopPK) model to identify and quantify the possible sources of the variability of IVM exposure after a single-oral dose in LF-infected subjects and healthy individuals.
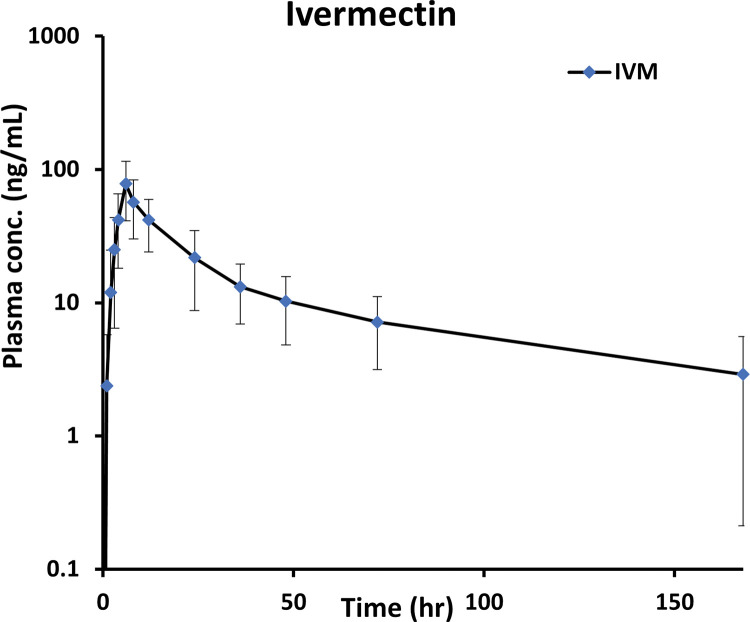
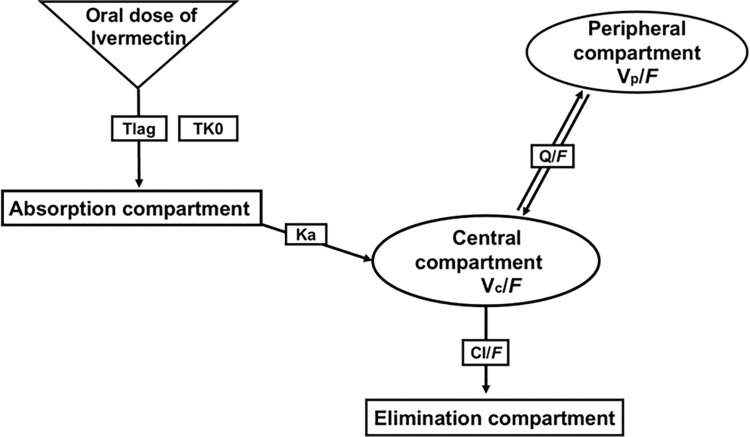
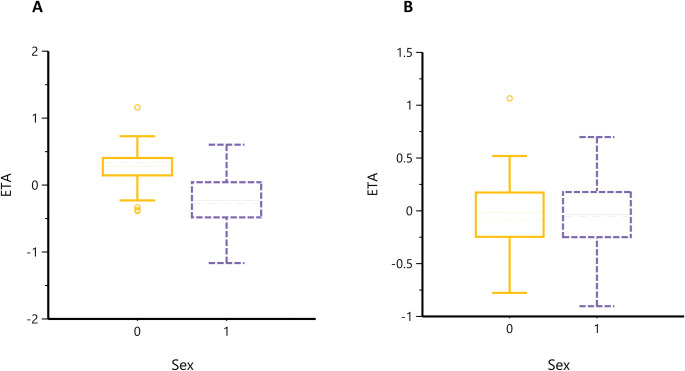
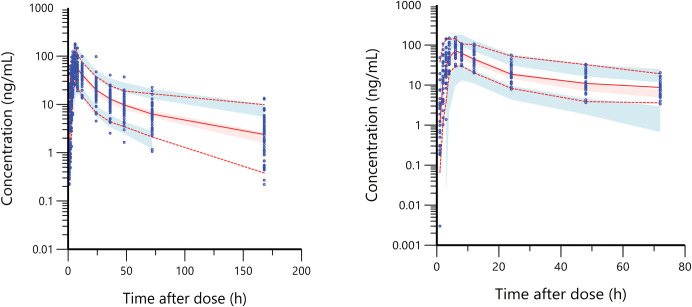
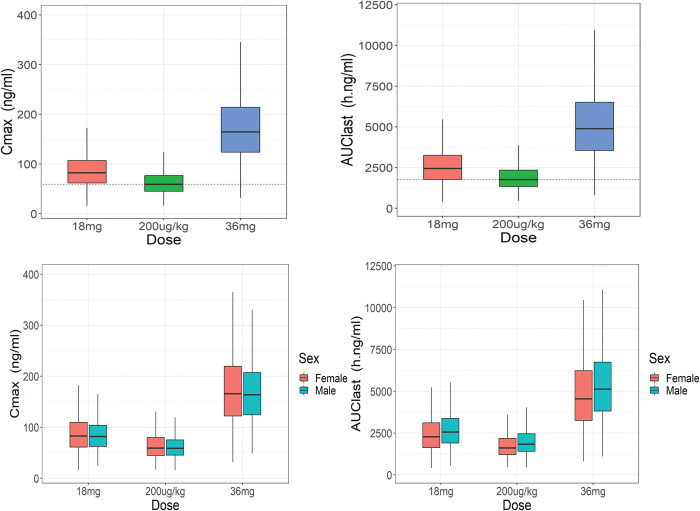
Methodology / principal findings: In this analysis, 724 samples were collected from treatment-naïve Wuchereria bancrofti-infected (n = 32) and uninfected (n = 24) adults living in Côte d'Ivoire who had received one dose of IVM as a part of triple-drug therapy. PopPK analysis was conducted using Phoenix NLME 8.3 software. The Monte Carlo simulation based on the final model was performed to simulate drug exposure among different dosing groups (200 μg/kg, 18 mg, and 36 mg). A two-compartment model with zero-order dose input into the absorption compartment with a lag time function followed by first-order absorption and linear elimination best described the IVM's pharmacokinetic (PK) parameters. The final model identifies that the PK parameters of IVM are not affected by LF infection. Sex was a significant covariate on the peripheral volume of distribution (Vp/F, 53% lower in men than in women). IVM drug exposure shows linear pharmacokinetic behavior among the simulated dosing groups with similar drug exposure based on sex.
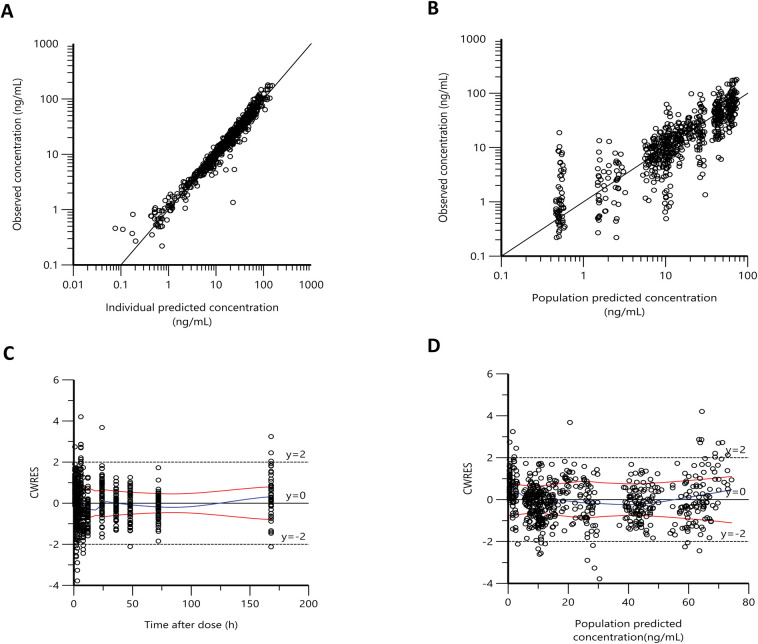
Conclusion/significance: We have developed a PopPk model to describe and identify possible sources of the variability of IVM exposure. To our knowledge, this is the first PopPK study of IVM in patients with LF.
Trial registration: NCT02845713; NCT03664063.
Copyright: © 2023 Alshehri et al. This is an open access article distributed under the terms of the Creative Commons Attribution License, which permits unrestricted use, distribution, and reproduction in any medium, provided the original author and source are credited.
Conflict of interest statement
The authors declare that there are no conflicts of interest.
Figures
Similar articles
-
Pharmacokinetics, safety, and efficacy of a single co-administered dose of diethylcarbamazine, albendazole and ivermectin in adults with and without Wuchereria bancrofti infection in Côte d'Ivoire.PLoS Negl Trop Dis. 2019 May 20;13(5):e0007325. doi: 10.1371/journal.pntd.0007325. eCollection 2019 May. PLoS Negl Trop Dis. 2019. PMID: 31107869 Free PMC article. Clinical Trial.
-
Identifying co-endemic areas for major filarial infections in sub-Saharan Africa: seeking synergies and preventing severe adverse events during mass drug administration campaigns.Parasit Vectors. 2018 Jan 31;11(1):70. doi: 10.1186/s13071-018-2655-5. Parasit Vectors. 2018. PMID: 29382363 Free PMC article.
-
The effect of six rounds of single dose mass treatment with diethylcarbamazine or ivermectin on Wuchereria bancrofti infection and its implications for lymphatic filariasis elimination.Trop Med Int Health. 2002 Sep;7(9):767-74. doi: 10.1046/j.1365-3156.2002.00935.x. Trop Med Int Health. 2002. PMID: 12225508 Clinical Trial.
-
Filariasis in Africa--treatment challenges and prospects.Clin Microbiol Infect. 2011 Jul;17(7):977-85. doi: 10.1111/j.1469-0691.2011.03586.x. Clin Microbiol Infect. 2011. PMID: 21722251 Review.
-
An analysis of the safety of the single dose, two drug regimens used in programmes to eliminate lymphatic filariasis.Parasitology. 2000;121 Suppl:S147-60. doi: 10.1017/s0031182000007423. Parasitology. 2000. PMID: 11386686 Review.
Cited by
-
Efficacy of ivermectin and albendazole combination in suppressing transmission of lymphatic filariasis following mass administration in Tanzania: a prospective cohort study.Infect Dis Poverty. 2024 Jun 12;13(1):44. doi: 10.1186/s40249-024-01214-3. Infect Dis Poverty. 2024. PMID: 38867265 Free PMC article.
References
-
- Summary of global update on preventive chemotherapy implementation in 2016: crossing the billion. Wkly Epidemiol Rec. 2017;92(40):589–93. - PubMed
Publication types
MeSH terms
Substances
Associated data
LinkOut - more resources
Full Text Sources
Medical
