

Disproportionate impacts of COVID-19 in a large US city
- PMID: 37262052
- PMCID: PMC10234557
- DOI: 10.1371/journal.pcbi.1011149
Disproportionate impacts of COVID-19 in a large US city
Abstract
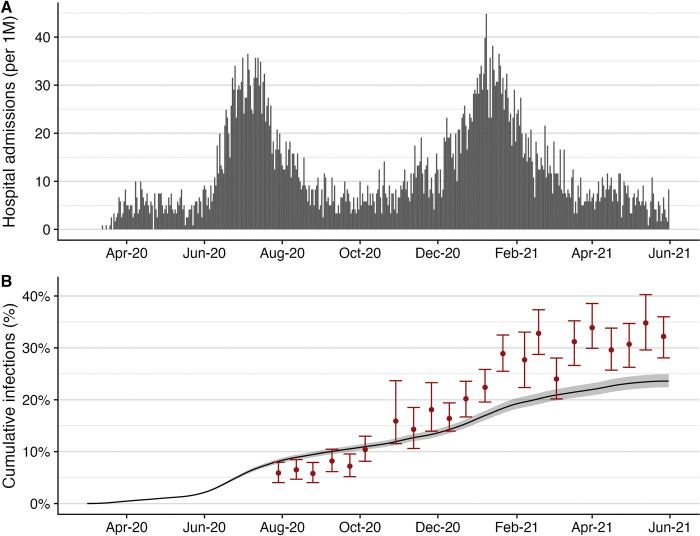
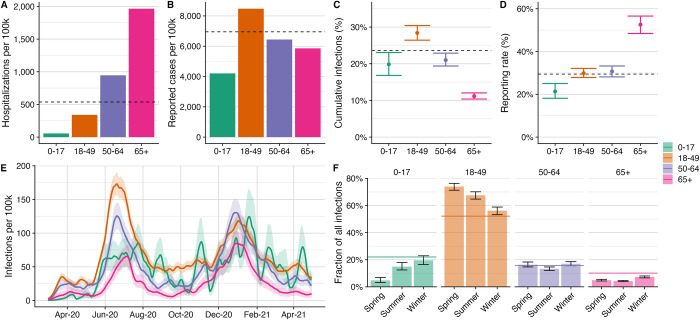
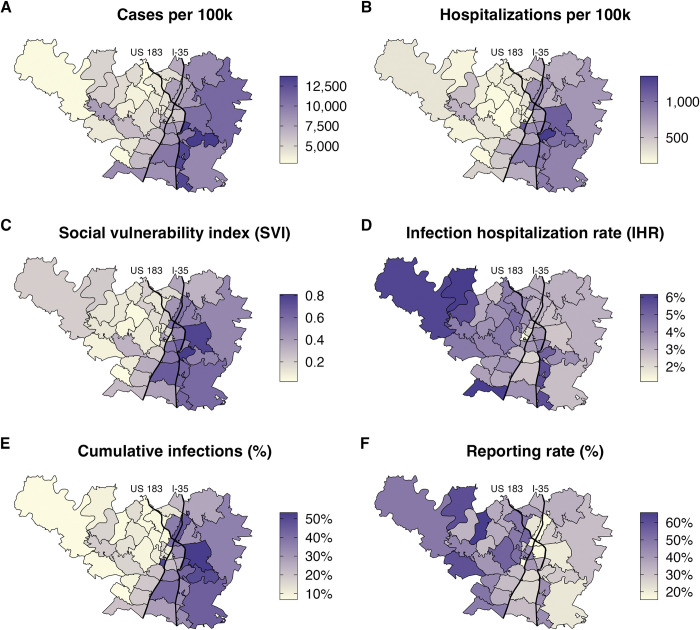
COVID-19 has disproportionately impacted individuals depending on where they live and work, and based on their race, ethnicity, and socioeconomic status. Studies have documented catastrophic disparities at critical points throughout the pandemic, but have not yet systematically tracked their severity through time. Using anonymized hospitalization data from March 11, 2020 to June 1, 2021 and fine-grain infection hospitalization rates, we estimate the time-varying burden of COVID-19 by age group and ZIP code in Austin, Texas. During this 15-month period, we estimate an overall 23.7% (95% CrI: 22.5-24.8%) infection rate and 29.4% (95% CrI: 28.0-31.0%) case reporting rate. Individuals over 65 were less likely to be infected than younger age groups (11.2% [95% CrI: 10.3-12.0%] vs 25.1% [95% CrI: 23.7-26.4%]), but more likely to be hospitalized (1,965 per 100,000 vs 376 per 100,000) and have their infections reported (53% [95% CrI: 49-57%] vs 28% [95% CrI: 27-30%]). We used a mixed effect poisson regression model to estimate disparities in infection and reporting rates as a function of social vulnerability. We compared ZIP codes ranking in the 75th percentile of vulnerability to those in the 25th percentile, and found that the more vulnerable communities had 2.5 (95% CrI: 2.0-3.0) times the infection rate and only 70% (95% CrI: 60%-82%) the reporting rate compared to the less vulnerable communities. Inequality persisted but declined significantly over the 15-month study period. Our results suggest that further public health efforts are needed to mitigate local COVID-19 disparities and that the CDC's social vulnerability index may serve as a reliable predictor of risk on a local scale when surveillance data are limited.
Copyright: This is an open access article, free of all copyright, and may be freely reproduced, distributed, transmitted, modified, built upon, or otherwise used by anyone for any lawful purpose. The work is made available under the Creative Commons CC0 public domain dedication.
Conflict of interest statement
The authors have declared that no competing interests exist.
Figures

Similar articles
-
The Epidemiology of COVID-19 by Race/Ethnicity in Oklahoma City-County, Oklahoma (12 March 2020-31 May 2021).Int J Environ Res Public Health. 2022 Jul 14;19(14):8571. doi: 10.3390/ijerph19148571. Int J Environ Res Public Health. 2022. PMID: 35886431 Free PMC article.
-
Racial and ethnic disparities in SARS-CoV-2 pandemic: analysis of a COVID-19 observational registry for a diverse US metropolitan population.BMJ Open. 2020 Aug 11;10(8):e039849. doi: 10.1136/bmjopen-2020-039849. BMJ Open. 2020. PMID: 32784264 Free PMC article.
-
Assessment of Racial/Ethnic Disparities in Hospitalization and Mortality in Patients With COVID-19 in New York City.JAMA Netw Open. 2020 Dec 1;3(12):e2026881. doi: 10.1001/jamanetworkopen.2020.26881. JAMA Netw Open. 2020. PMID: 33275153 Free PMC article.
-
Social Vulnerability and Rurality Associated With Higher Severe Acute Respiratory Syndrome Coronavirus 2 (SARS-CoV-2) Infection-Induced Seroprevalence: A Nationwide Blood Donor Study-United States, July 2020-June 2021.Clin Infect Dis. 2022 Aug 24;75(1):e133-e143. doi: 10.1093/cid/ciac105. Clin Infect Dis. 2022. PMID: 35137014 Free PMC article.
-
Social determinants of health and coronavirus disease 2019 in pregnancy.Am J Obstet Gynecol MFM. 2021 Jul;3(4):100349. doi: 10.1016/j.ajogmf.2021.100349. Epub 2021 Mar 21. Am J Obstet Gynecol MFM. 2021. PMID: 33757936 Free PMC article.
Cited by
-
The Effect of Social Vulnerability on Initial Stage and Treatment for Non-Small Cell Lung Cancer.Lung Cancer. 2024 Feb;188:107452. doi: 10.1016/j.lungcan.2023.107452. Epub 2023 Dec 23. Lung Cancer. 2024. PMID: 38176296 Free PMC article.
-
Latent class analysis identifies risk groups to model the expected benefits of SARS-CoV-2 interventions among university students.Sci Rep. 2025 Apr 2;15(1):11199. doi: 10.1038/s41598-025-95164-x. Sci Rep. 2025. PMID: 40169833 Free PMC article.
-
Generalized contact matrices allow integrating socioeconomic variables into epidemic models.Sci Adv. 2024 Oct 11;10(41):eadk4606. doi: 10.1126/sciadv.adk4606. Epub 2024 Oct 11. Sci Adv. 2024. PMID: 39392883 Free PMC article.
References
-
- 14.9 million excess deaths associated with the COVID-19 pandemic in 2020 and 2021. [cited 17 Jun 2022]. Available: https://www.who.int/news/item/05-05-2022-14.9-million-excess-deaths-were...
Publication types
MeSH terms
Grants and funding
LinkOut - more resources
Full Text Sources
Medical
