. 2023 Aug 4;13(8):1904-1921.
doi: 10.1158/2159-8290.CD-22-0976.

Effectors Enabling Adaptation to Mitochondrial Complex I Loss in Hürthle Cell Carcinoma

Affiliations

Effectors Enabling Adaptation to Mitochondrial Complex I Loss in Hürthle Cell Carcinoma

Raj K Gopal et al. Cancer Discov. .

Abstract

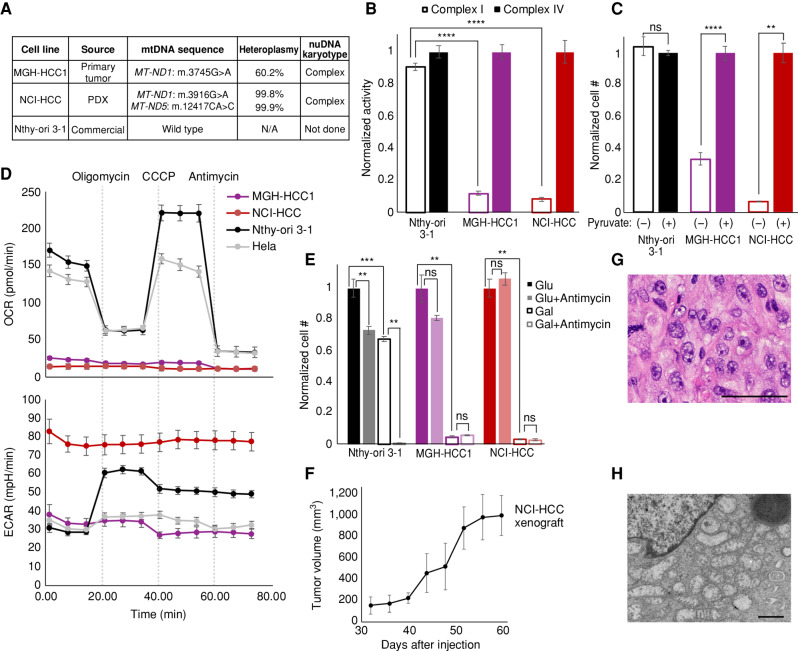
Oncocytic (Hürthle cell) carcinoma of the thyroid (HCC) is genetically characterized by complex I mitochondrial DNA mutations and widespread chromosomal losses. Here, we utilize RNA sequencing and metabolomics to identify candidate molecular effectors activated by these genetic drivers. We find glutathione biosynthesis, amino acid metabolism, mitochondrial unfolded protein response, and lipid peroxide scavenging to be increased in HCC. A CRISPR-Cas9 knockout screen in a new HCC model reveals which pathways are key for fitness, and highlights loss of GPX4, a defense against lipid peroxides and ferroptosis, as a strong liability. Rescuing complex I redox activity with the yeast NADH dehydrogenase (NDI1) in HCC cells diminishes ferroptosis sensitivity, while inhibiting complex I in normal thyroid cells augments ferroptosis induction. Our work demonstrates unmitigated lipid peroxide stress to be an HCC vulnerability that is mechanistically coupled to the genetic loss of mitochondrial complex I activity.

Significance: HCC harbors abundant mitochondria, mitochondrial DNA mutations, and chromosomal losses. Using a CRISPR-Cas9 screen inspired by transcriptomic and metabolomic profiling, we identify molecular effectors essential for cell fitness. We uncover lipid peroxide stress as a vulnerability coupled to mitochondrial complex I loss in HCC. See related article by Frank et al., p. 1884. This article is highlighted in the In This Issue feature, p. 1749.


Figures

Figure 1. An HCC cohort with complex I mtDNA mutations and chromosomal losses. A, Clinical cohort of HCC and normal thyroid samples with profiling methods used. CGH, comparative genomic hybridization; primary, primary tumor. B, Mutations in mtDNA organized by complex with allelic fraction >0.2 with CGH-SNP array copy-number profile. See also Supplementary Fig. S1.
Figure 1.
An HCC cohort with complex I mtDNA mutations and chromosomal losses. A, Clinical cohort of HCC and normal thyroid samples with profiling methods used. CGH, comparative genomic hybridization; primary, primary tumor. B, Mutations in mtDNA organized by complex with allelic fraction >0.2 with CGH-SNP array copy-number profile. See also Supplementary Fig. S1.
Figure 2. Transcriptomic landscape of HCC. A, PCA of HCC and normal thyroid (n = 18 each) RNA-seq. Hashimoto's, Hashimoto thyroiditis; Min CNV, minimum copy-number variation. B, Schematic of HCC clinical features with violin plots of gene expression fold changes (HCC/normal) for related molecular pathways. mtRNA, mitochondrial RNA; TDS, thyroid differentiation score. Significance tested by the Kolmogorov–Smirnov test: **, P < 1.0E−03; ***, P < 1.0E−04; ****, P < 1.0E−05. C, Normalized gene expression for transcripts with adjusted P values. D, Gene set enrichment analysis (GSEA) of the KEGG and HALLMARK pathways ranked by enrichment score with shaded FWER values. (H), HALLMARK gene set; metab, metabolism. E, IHC for proteins from selected pathways in HCC and normal thyroid; scale bars, 200 μm. F, Normalized gene expression for transcripts from selected pathways with adjusted P values. “Synthetic sick genes” refers to knockouts that were synthetic sick with OXPHOS dysfunction (35). Horizontal lines show the mean, and boxes show the standard deviation. See also Supplementary Fig. S2.
Figure 2.
Transcriptomic landscape of HCC. A, PCA of HCC and normal thyroid (n = 18 each) RNA-seq. Hashimoto's, Hashimoto thyroiditis; Min CNV, minimum copy-number variation. B, Schematic of HCC clinical features with violin plots of gene expression fold changes (HCC/normal) for related molecular pathways. mtRNA, mitochondrial RNA; TDS, thyroid differentiation score. Significance tested by the Kolmogorov–Smirnov test: **, P < 1.0E−03; ***, P < 1.0E−04; ****, P < 1.0E−05. C, Normalized gene expression for transcripts with adjusted P values. D, Gene set enrichment analysis (GSEA) of the KEGG and HALLMARK pathways ranked by enrichment score with shaded FWER values. (H), HALLMARK gene set; metab, metabolism. E, IHC for proteins from selected pathways in HCC and normal thyroid; scale bars, 200 μm. F, Normalized gene expression for transcripts from selected pathways with adjusted P values. “Synthetic sick genes” refers to knockouts that were synthetic sick with OXPHOS dysfunction (35). Horizontal lines show the mean, and boxes show the standard deviation. See also Supplementary Fig. S2.
Figure 3. Metabolic signatures of HCC. A, PCA of metabolomics from four mass spectrometry methods in HCC (n = 20) and normal thyroid (n = 14). Hashimoto's, Hashimoto thyroiditis; Min CNV, minimum copy-number variation. B, Volcano plot showing fold change (HCC/normal; x-axis) and adjusted P value (y-axis), with metabolites annotated by name and color. CMP, cytidine monophosphate; IMP, inosine monophosphate. C, Differential abundance of lipids organized by class and sorted by the number of carbons with double bonds (color) and adjusted P values (dot size). Cera, ceramide; DAG, diacylglycerol; LPC, lysoPC; PC, phosphatidylcholine; PE, phosphatidylethanolamine; pls, plasmalogen; SM, sphingomyelin. D, Normalized expression and abundance for enzymes and their metabolic products, respectively, with adjusted P values. Horizontal lines show the mean, and boxes show the standard deviation. See also Supplementary Fig. S3.
Figure 3.
Metabolic signatures of HCC. A, PCA of metabolomics from four mass spectrometry methods in HCC (n = 20) and normal thyroid (n = 14). Hashimoto's, Hashimoto thyroiditis; Min CNV, minimum copy-number variation. B, Volcano plot showing fold change (HCC/normal; x-axis) and adjusted P value (y-axis), with metabolites annotated by name and color. CMP, cytidine monophosphate; IMP, inosine monophosphate. C, Differential abundance of lipids organized by class and sorted by the number of carbons with double bonds (color) and adjusted P values (dot size). Cera, ceramide; DAG, diacylglycerol; LPC, lysoPC; PC, phosphatidylcholine; PE, phosphatidylethanolamine; pls, plasmalogen; SM, sphingomyelin. D, Normalized expression and abundance for enzymes and their metabolic products, respectively, with adjusted P values. Horizontal lines show the mean, and boxes show the standard deviation. See also Supplementary Fig. S3.
Figure 4. Genetics and biochemistry of authentic HCC models. A, Table of mtDNA mutation status and nuclear karyotype of HCC (MGH-HCC1 and NCI-HCC) and normal thyroid (Nthy-ori 3-1; immortalized via SV40 transfection) cell lines. N/A, not applicable. B, Normalized enzymatic activity of complex I and complex IV from cell lines. Mean ± SD; n = 3 from one experiment. C, Normalized cell number in media ± pyruvate. Mean ± SD; n = 2, representative of two experiments. D, OCR and extracellular acidification rate (ECAR) of cell lines from the Seahorse XFe96 Analyzer. Dotted vertical lines show drug injections. Mean ± SD; n = 8–10, representative of 3 experiments. E, Normalized cell number of cell lines in glucose (Glu) or galactose (Gal) ± antimycin. Mean ± SD; n = 3, representative of 3 experiments. F, Tumor volumes (mm3) of NCI-HCC xenografts over time. Mean ± SD; n = 3 from 1 experiment. G and H, H&E (G; scale bar, 100 μm) and EM (H; scale bar, 800 nm) from NCI-HCC xenograft. For B, C, and E, significance tested with an unpaired t test: *, P < 0.05; **, P < 0.01; ***, P < 0.001; ****, P < 0.0001; ns, P > 0.05. See also Supplementary Fig. S4.
Figure 4.
Genetics and biochemistry of authentic HCC models. A, Table of mtDNA mutation status and nuclear karyotype of HCC (MGH-HCC1 and NCI-HCC) and normal thyroid (Nthy-ori 3-1; immortalized via SV40 transfection) cell lines. N/A, not applicable. B, Normalized enzymatic activity of complex I and complex IV from cell lines. Mean ± SD; n = 3 from one experiment. C, Normalized cell number in media ± pyruvate. Mean ± SD; n = 2, representative of two experiments. D, OCR and extracellular acidification rate (ECAR) of cell lines from the Seahorse XFe96 Analyzer. Dotted vertical lines show drug injections. Mean ± SD; n = 8–10, representative of 3 experiments. E, Normalized cell number of cell lines in glucose (Glu) or galactose (Gal) ± antimycin. Mean ± SD; n = 3, representative of 3 experiments. F, Tumor volumes (mm3) of NCI-HCC xenografts over time. Mean ± SD; n = 3 from 1 experiment. G and H, H&E (G; scale bar, 100 μm) and EM (H; scale bar, 800 nm) from NCI-HCC xenograft. For B, C, and E, significance tested with an unpaired t test: *, P < 0.05; **, P < 0.01; ***, P < 0.001; ****, P < 0.0001; ns, P > 0.05. See also Supplementary Fig. S4.
Figure 5. CRISPR screen identifies vulnerability to GPX4 loss in HCC. A, Schema for customized CRISPR screen with sampling times and DNA sequencing. B, Gene fitness scatter plots showing Z-scores in NCI-HCC (y-axis) vs. Nthy-ori 3-1 (x-axis) cells from day 11 and 16 time points. C, GPX4 chronos scores from Cancer Dependency Map for all cancer cell lines ranked by sensitivity with mean (vertical line). CNS, central nervous system; PNS, peripheral nervous system. D, Ferroptosis heat map with schema of metabolic pathways represented in leading-edge genes with fold changes and adjusted P values in genes and metabolites, as well as CRISPR fitness score annotated according to the legend. See also Supplementary Fig. S5. CoQ, coenzyme Q; CoQH2, reduced coenzyme Q; PL, phospholipid.
Figure 5.
CRISPR screen identifies vulnerability to GPX4 loss in HCC. A, Schema for customized CRISPR screen with sampling times and DNA sequencing. B, Gene fitness scatter plots showing Z-scores in NCI-HCC (y-axis) vs. Nthy-ori 3-1 (x-axis) cells from day 11 and 16 time points. C,GPX4 chronos scores from Cancer Dependency Map for all cancer cell lines ranked by sensitivity with mean (vertical line). CNS, central nervous system; PNS, peripheral nervous system. D, Ferroptosis heat map with schema of metabolic pathways represented in leading-edge genes with fold changes and adjusted P values in genes and metabolites, as well as CRISPR fitness score annotated according to the legend. See also Supplementary Fig. S5. CoQ, coenzyme Q; CoQH2, reduced coenzyme Q; PL, phospholipid.
Figure 6. HCC cells are sensitive to ferroptosis. A, Diagram showing glutathione (GSH) production and GPX4 reaction with drug targets. B, Dose–response curves for RSL3 plotted as normalized cell number for all cell lines with brightfield microscopy. Break in the x-axis to allow visualization of 0 nmol/L RSL3. Scale bars, 250 μm; mean ± SD; n = 3, representative of 3 experiments; significance tested with extra sum-of-squares F test: ***, P < 0.0001. C, Normalized cell number for cell lines with RSL3 ± ferrostatin (1 μmol/L) with brightfield microscopy. Scale bars, 250 μm; mean ± SD; n = 3, representative of 2 experiments; significance from an unpaired t test: ***, P < 0.001; ns, P > 0.05. D, Tumor volume (mm3) measurements of NCI-HCC xenografts treated with vehicle (5% DMSO) or 100 mg/kg sulfasalazine via daily i.p. injection; mean ± SD; n = 8; significance from unpaired t test: *, P < 0.05. E, H&E of vehicle- and sulfasalazine-treated tumors with bar plots of fibrosis/sclerosis score. Scale bars, 100 μm. Significance tested with a two-tailed test of proportions: *, P < 0.05. See also Supplementary Fig. S6.
Figure 6.
HCC cells are sensitive to ferroptosis. A, Diagram showing glutathione (GSH) production and GPX4 reaction with drug targets. B, Dose–response curves for RSL3 plotted as normalized cell number for all cell lines with brightfield microscopy. Break in the x-axis to allow visualization of 0 nmol/L RSL3. Scale bars, 250 μm; mean ± SD; n = 3, representative of 3 experiments; significance tested with extra sum-of-squares F test: ***, P < 0.0001. C, Normalized cell number for cell lines with RSL3 ± ferrostatin (1 μmol/L) with brightfield microscopy. Scale bars, 250 μm; mean ± SD; n = 3, representative of 2 experiments; significance from an unpaired t test: ***, P < 0.001; ns, P > 0.05. D, Tumor volume (mm3) measurements of NCI-HCC xenografts treated with vehicle (5% DMSO) or 100 mg/kg sulfasalazine via daily i.p. injection; mean ± SD; n = 8; significance from unpaired t test: *, P < 0.05. E, H&E of vehicle- and sulfasalazine-treated tumors with bar plots of fibrosis/sclerosis score. Scale bars, 100 μm. Significance tested with a two-tailed test of proportions: *, P < 0.05. See also Supplementary Fig. S6.
Figure 7. Complex I regulates sensitivity to ferroptosis. A, Schematic of electron (e−) flow from NADH into OXPHOS complexes with site of action for NDI1 (yellow arrow) and piericidin. CoQ, coenzyme Q. B, Cell growth for NCI-HCC cells expressing mitoGFP or NDI1 ± pyruvate. Mean ± SD; n = 2, representative of 3 experiments. Significance tested with unpaired t test: ***, P < 0.001; ns, P > 0.05. mitoGFP, mitochondrial-localized GFP. C, Seahorse XFe96 Analyzer traces of OCR and ECAR in NCI-HCC cells expressing mitoGFP or NDI1 with drug injections (dotted vertical lines). Mean ± SD; n = 5 representative of 2 experiments. D, Dose–response curves for RSL3 plotted as normalized cell number for NCI-HCC cells expressing mitoGFP or NDI1, with brightfield microscopy images. Scale bars, 250 μm; mean ± SD; n = 2, representative of 3 experiments. Pier, piericidin. E, Dose–response curves with normalized cell number for RSL3 ± piericidin in Nthy-ori 3-1 cells expressing mitoGFP or NDI1, with brightfield microscopy images. Scale bars, 250 μm. Mean ± SD; n = 2, representative of 3 experiments. For D and E, break in the x-axis is to allow visualization of 0 nmol/L RSL3, and significance tested with extra sum-of-squares F test: ***, P < 0.0001; ns, P > 0.05. See also Supplementary Fig. S7.
Figure 7.
Complex I regulates sensitivity to ferroptosis. A, Schematic of electron (e) flow from NADH into OXPHOS complexes with site of action for NDI1 (yellow arrow) and piericidin. CoQ, coenzyme Q. B, Cell growth for NCI-HCC cells expressing mitoGFP or NDI1 ± pyruvate. Mean ± SD; n = 2, representative of 3 experiments. Significance tested with unpaired t test: ***, P < 0.001; ns, P > 0.05. mitoGFP, mitochondrial-localized GFP. C, Seahorse XFe96 Analyzer traces of OCR and ECAR in NCI-HCC cells expressing mitoGFP or NDI1 with drug injections (dotted vertical lines). Mean ± SD; n = 5 representative of 2 experiments. D, Dose–response curves for RSL3 plotted as normalized cell number for NCI-HCC cells expressing mitoGFP or NDI1, with brightfield microscopy images. Scale bars, 250 μm; mean ± SD; n = 2, representative of 3 experiments. Pier, piericidin. E, Dose–response curves with normalized cell number for RSL3 ± piericidin in Nthy-ori 3-1 cells expressing mitoGFP or NDI1, with brightfield microscopy images. Scale bars, 250 μm. Mean ± SD; n = 2, representative of 3 experiments. For D and E, break in the x-axis is to allow visualization of 0 nmol/L RSL3, and significance tested with extra sum-of-squares F test: ***, P < 0.0001; ns, P > 0.05. See also Supplementary Fig. S7.

Comment in

  • 2159-8274. doi: 10.1158/2159-8290.CD-22-0982
  • 2159-8274. doi: 10.1158/2159-8290.CD-13-8-ITI

References

    1. Besic N, Vidergar-Kralj B, Frkovic-Grazio S, Movrin-Stanovnik T, Auersperg M. The role of radioactive iodine in the treatment of Hurthle cell carcinoma of the thyroid. Thyroid 2003;13:577–84. - PubMed
    1. Maximo V, Sobrinho-Simoes M. Hurthle cell tumours of the thyroid: a review with emphasis on mitochondrial abnormalities with clinical relevance. Virchows Arch 2000;437:107–15. - PubMed
    1. Lowe VJ, Mullan BP, Hay ID, McIver B, Kasperbauer JL. 18F-FDG PET of patients with Hurthle cell carcinoma. J Nucl Med 2003;44:1402–6. - PubMed
    1. Gasparre G, Porcelli AM, Bonora E, Pennisi LF, Toller M, Iommarini L, et al. . Disruptive mitochondrial DNA mutations in complex I subunits are markers of oncocytic phenotype in thyroid tumors. Proc Natl Acad Sci U S A 2007;104:9001–6. - PMC - PubMed
    1. Corver WE, Ruano D, Weijers K, den Hartog WC, van Nieuwenhuizen MP, de Miranda N, et al. . Genome haploidisation with chromosome 7 retention in oncocytic follicular thyroid carcinoma. PLoS One 2012;7:e38287. - PMC - PubMed

Publication types