. 2023 Jul 11;56(7):1451-1467.e12.
doi: 10.1016/j.immuni.2023.05.004. Epub 2023 May 31.

Quantitative control of Ets1 dosage by a multi-enhancer hub promotes Th1 cell differentiation and protects from allergic inflammation

Affiliations

Quantitative control of Ets1 dosage by a multi-enhancer hub promotes Th1 cell differentiation and protects from allergic inflammation

Aditi Chandra et al. Immunity. .

Abstract

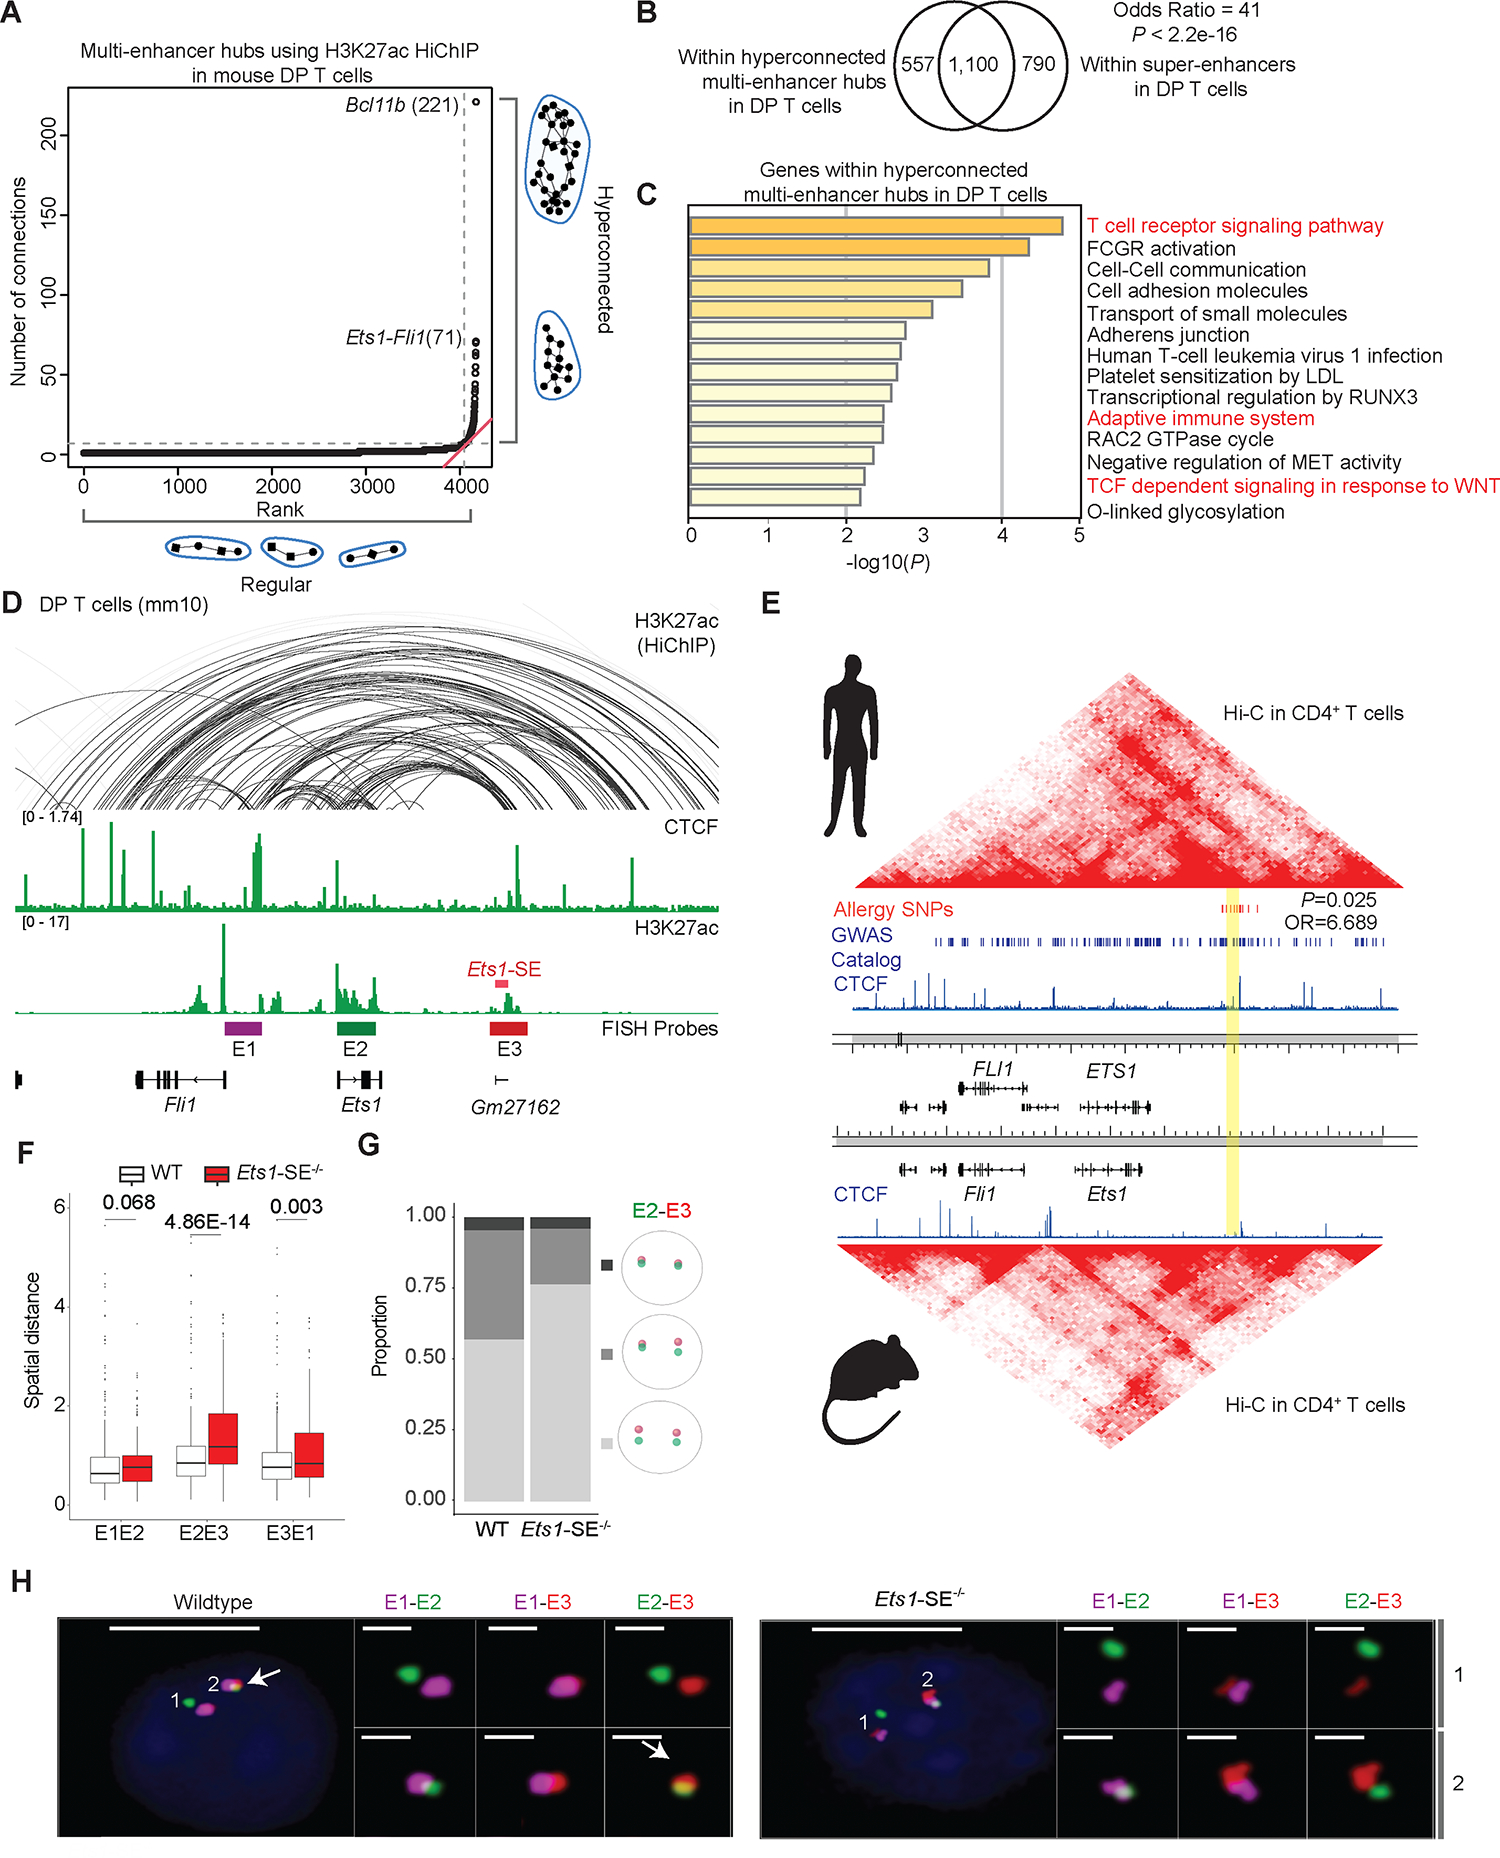
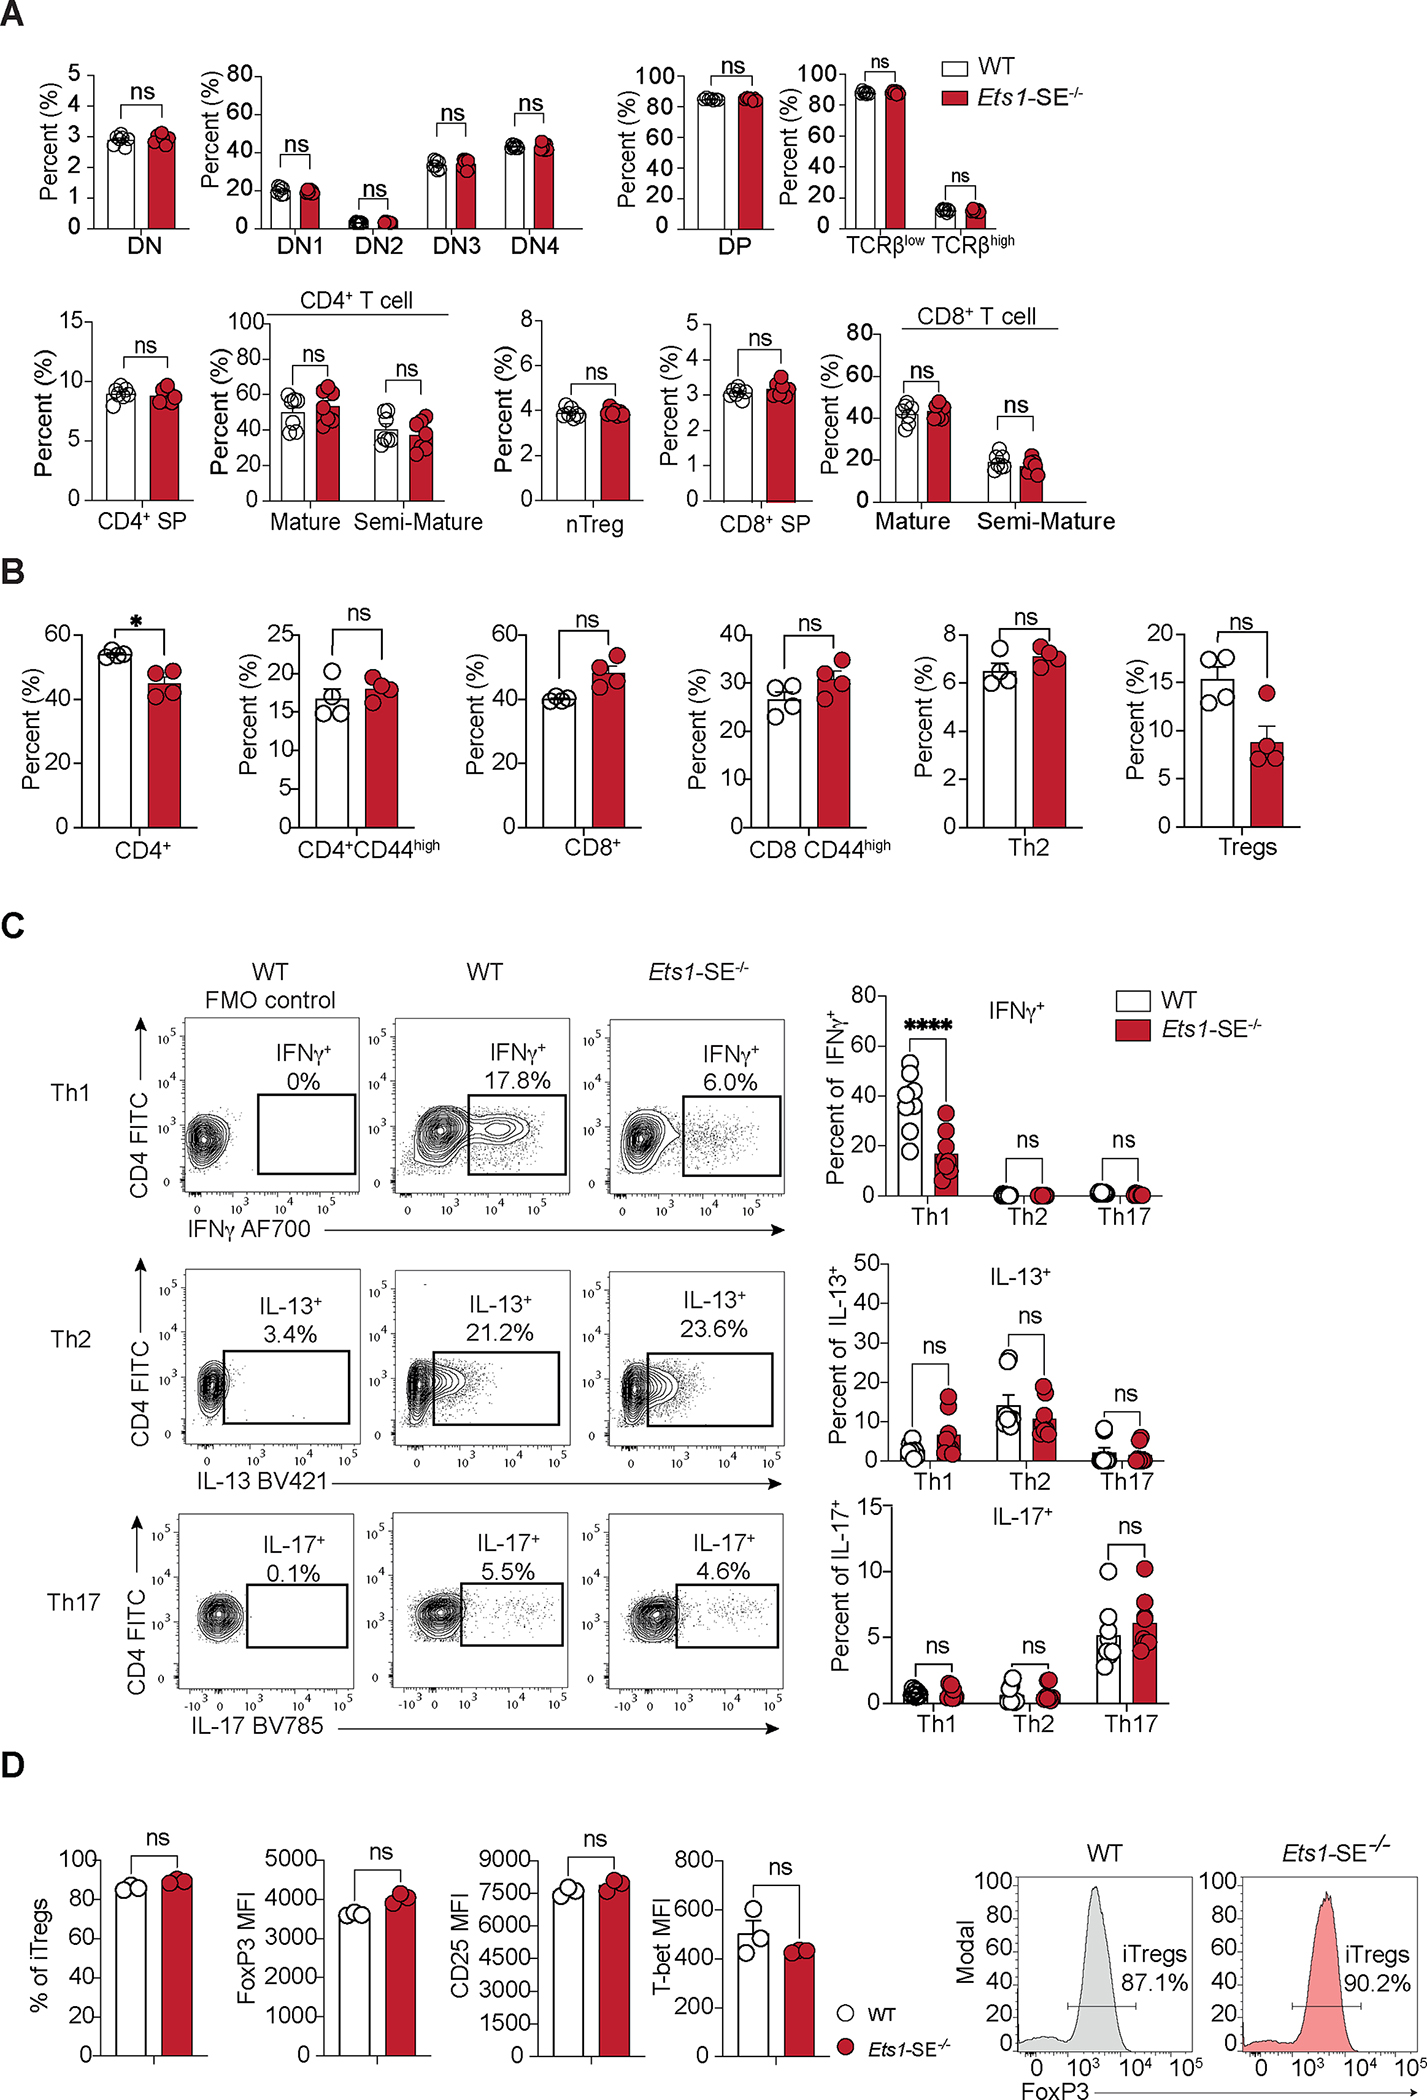
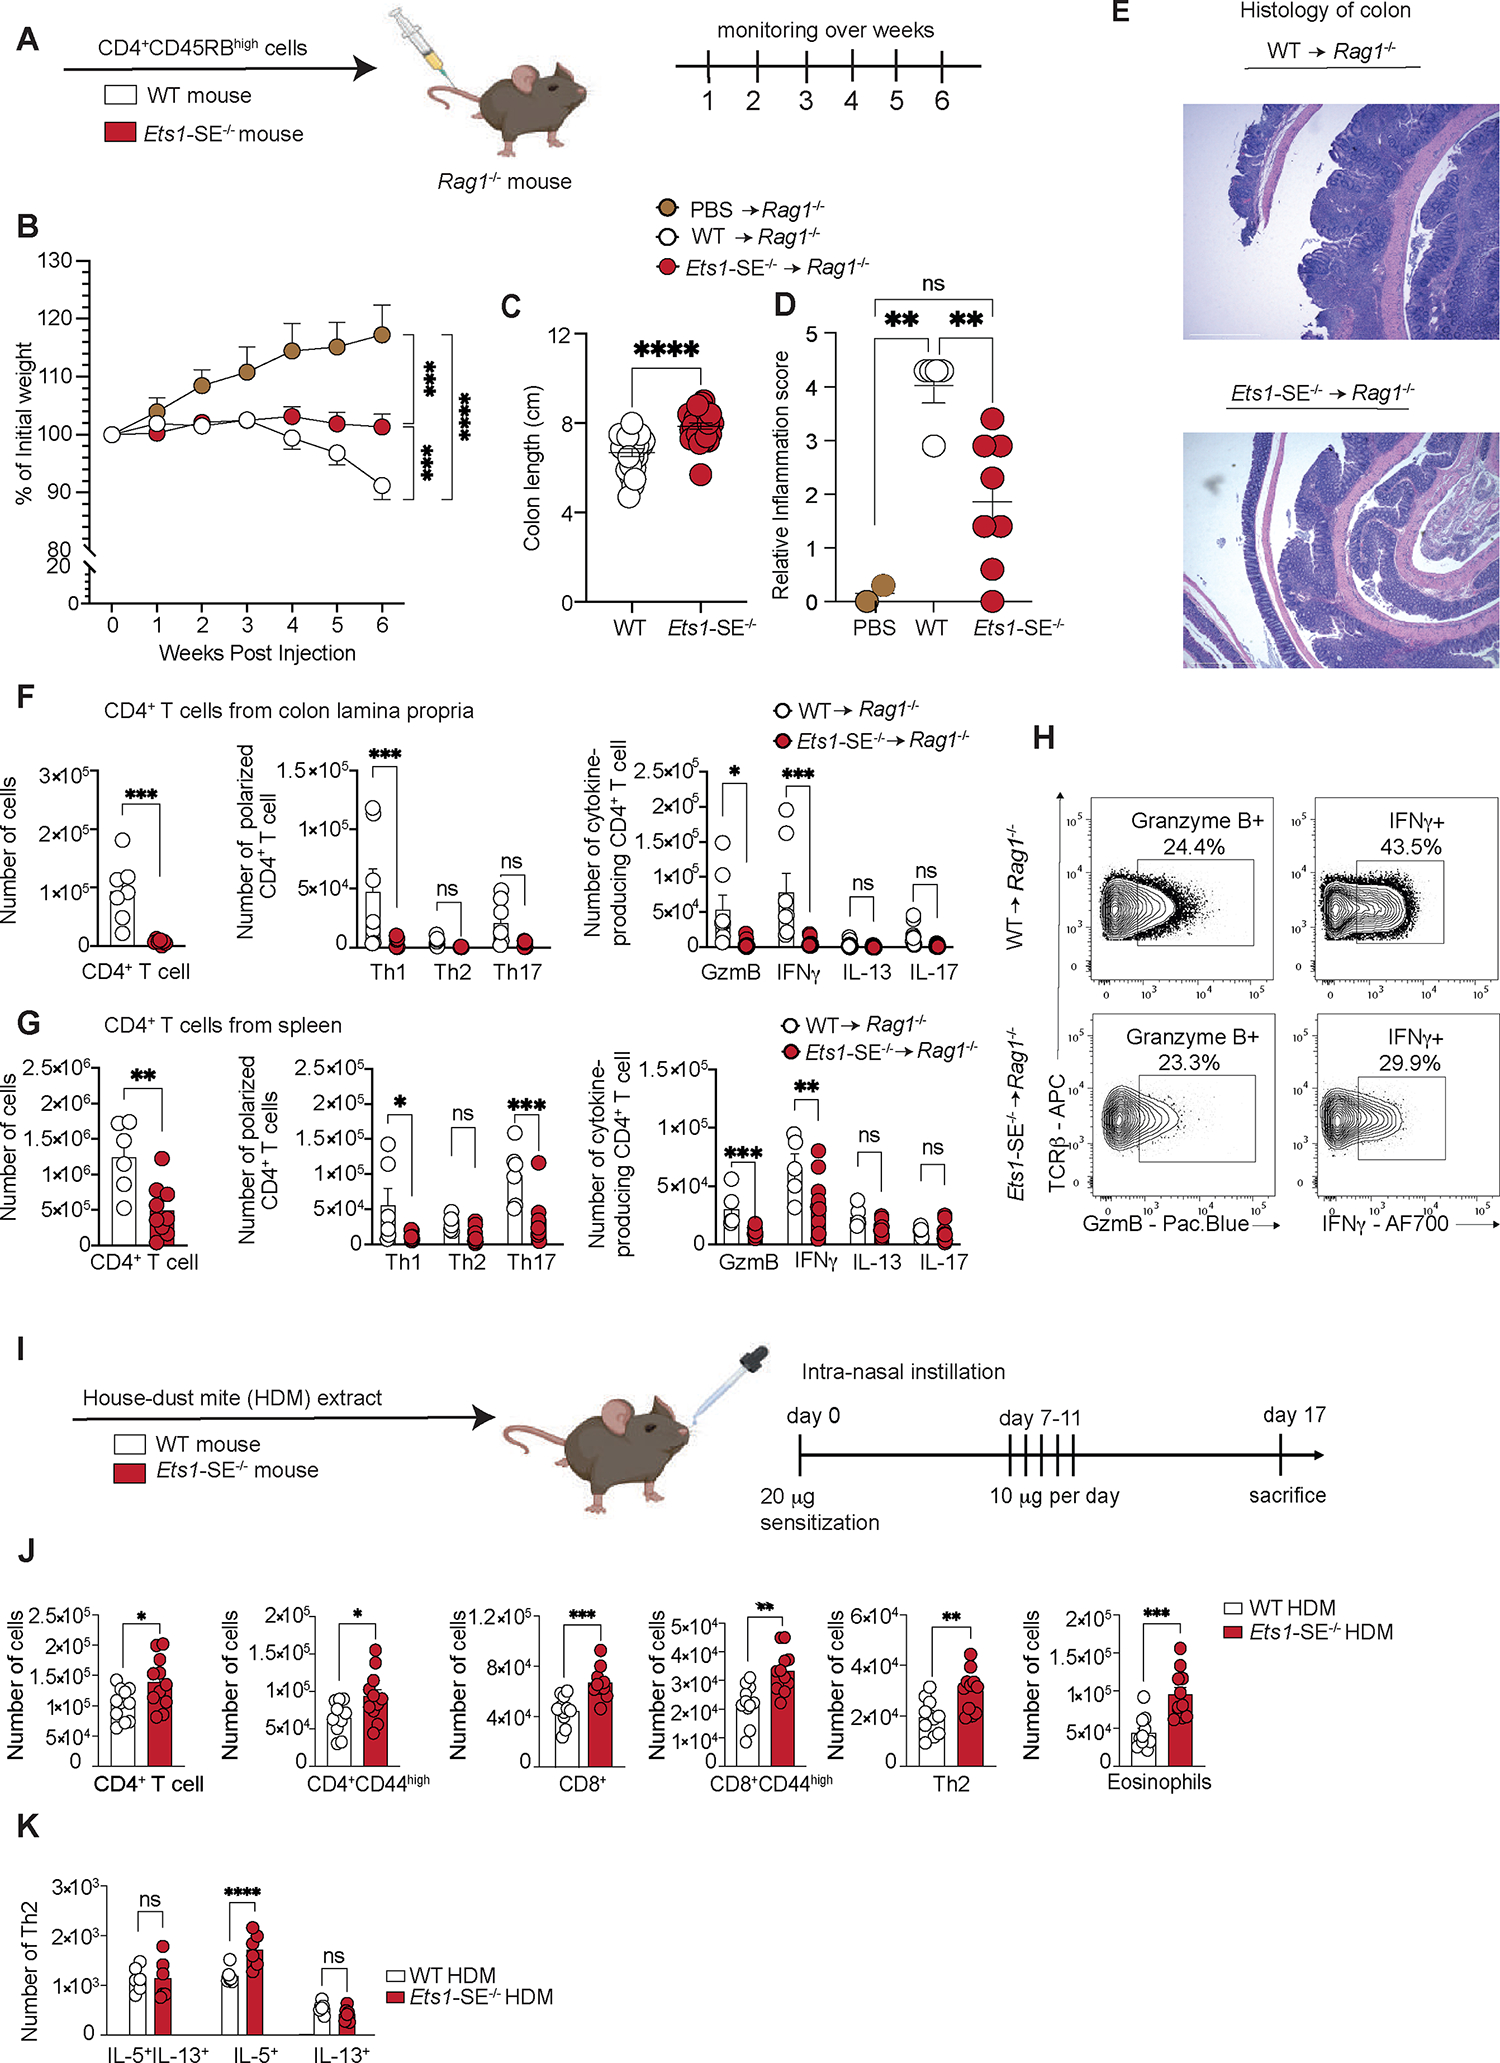
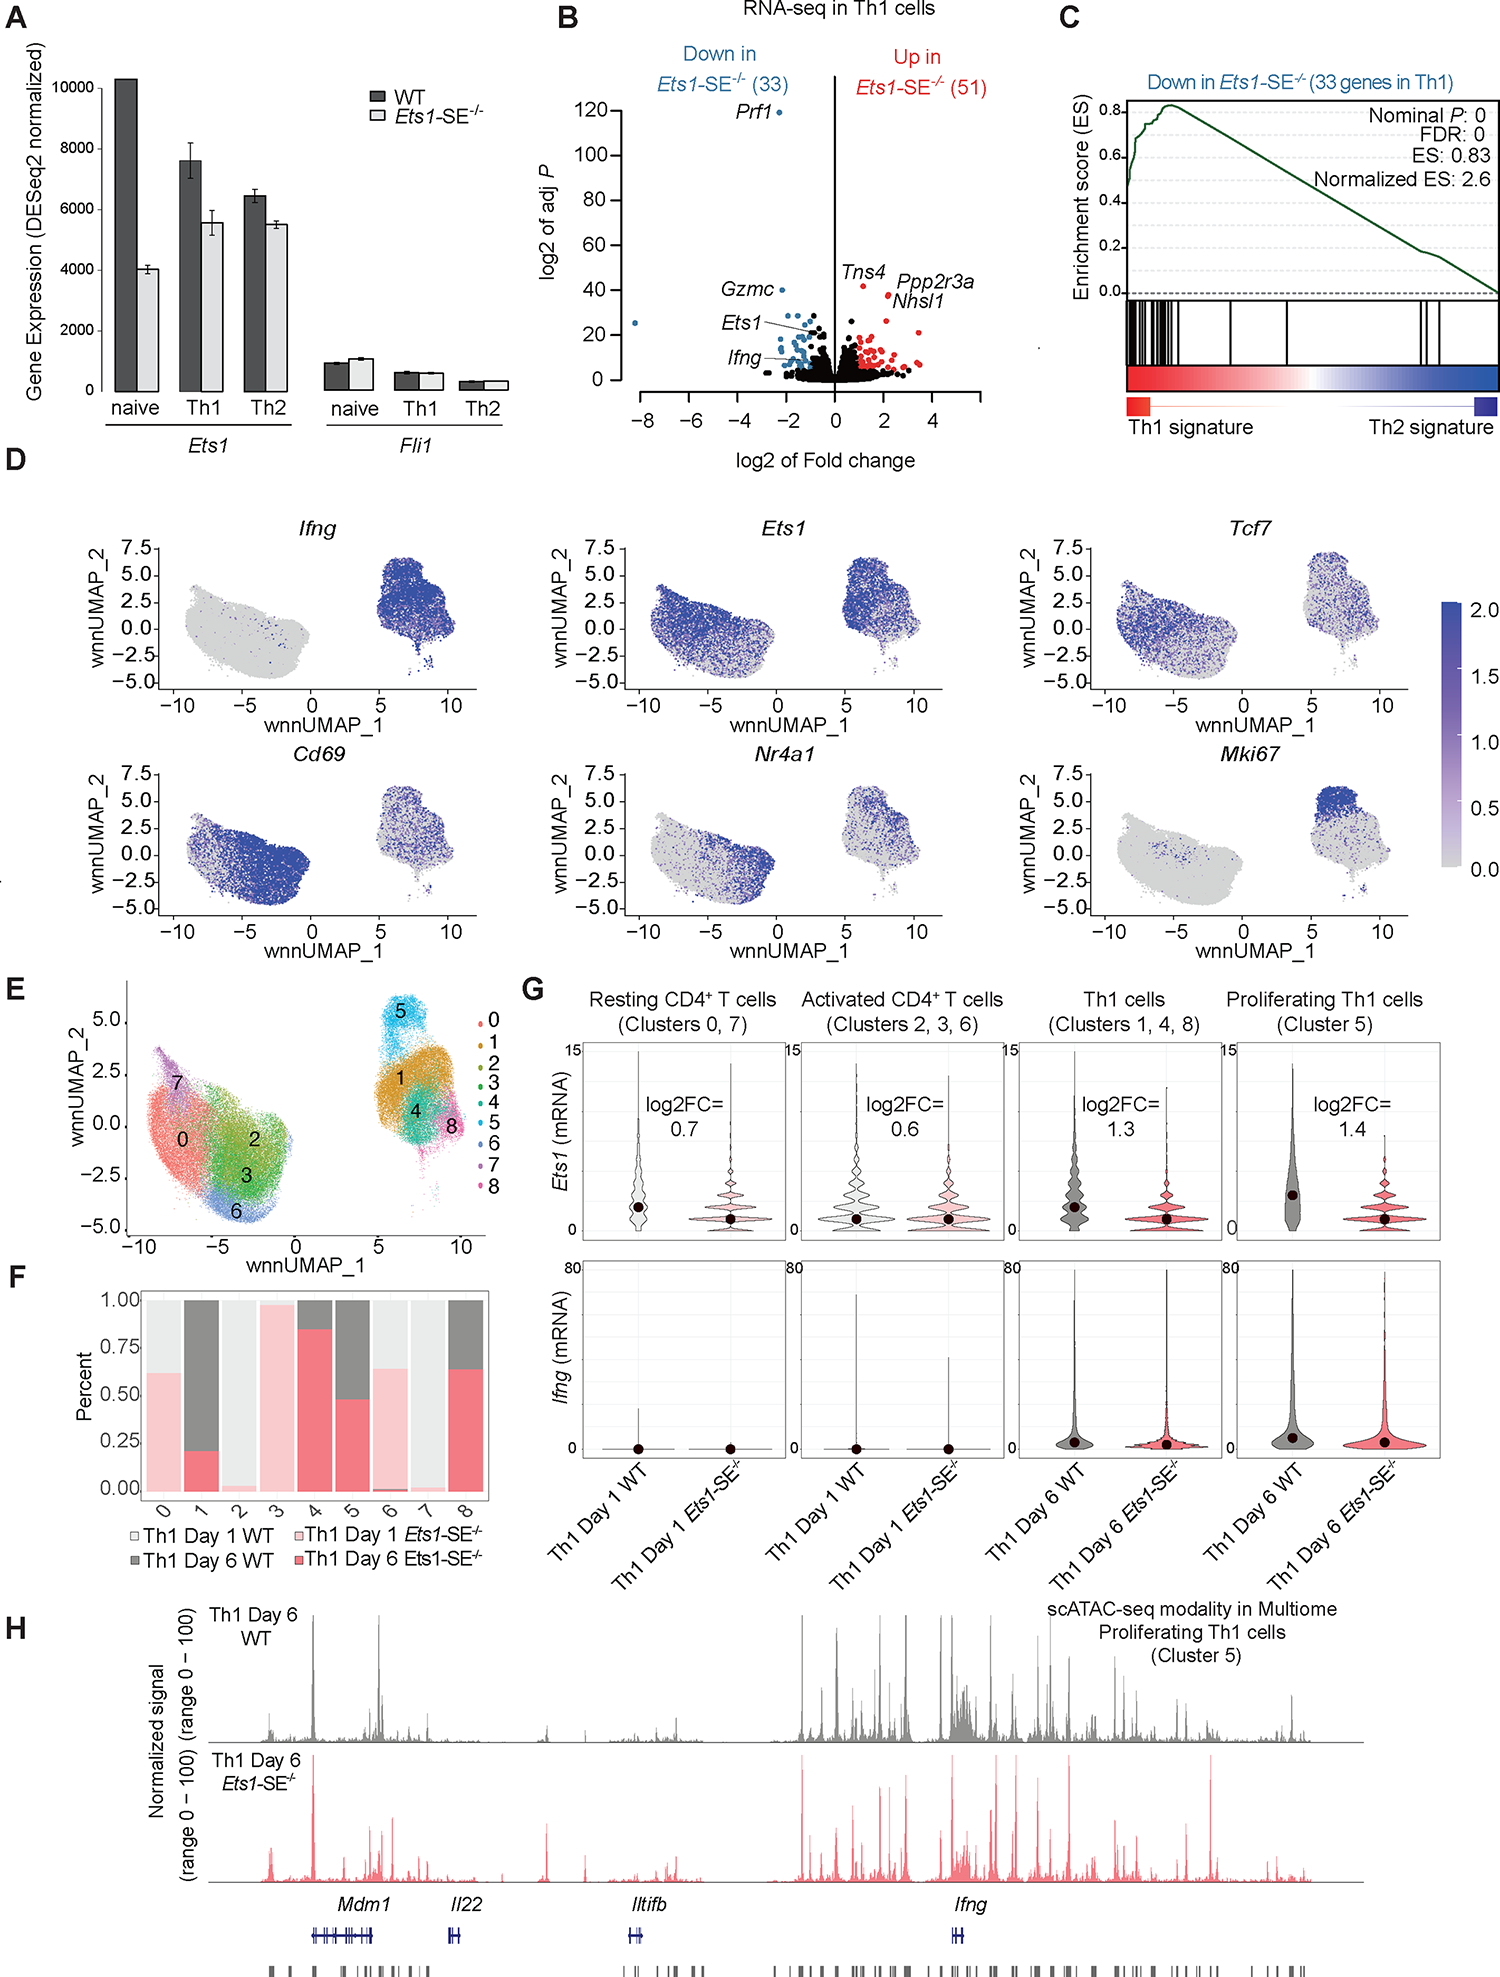
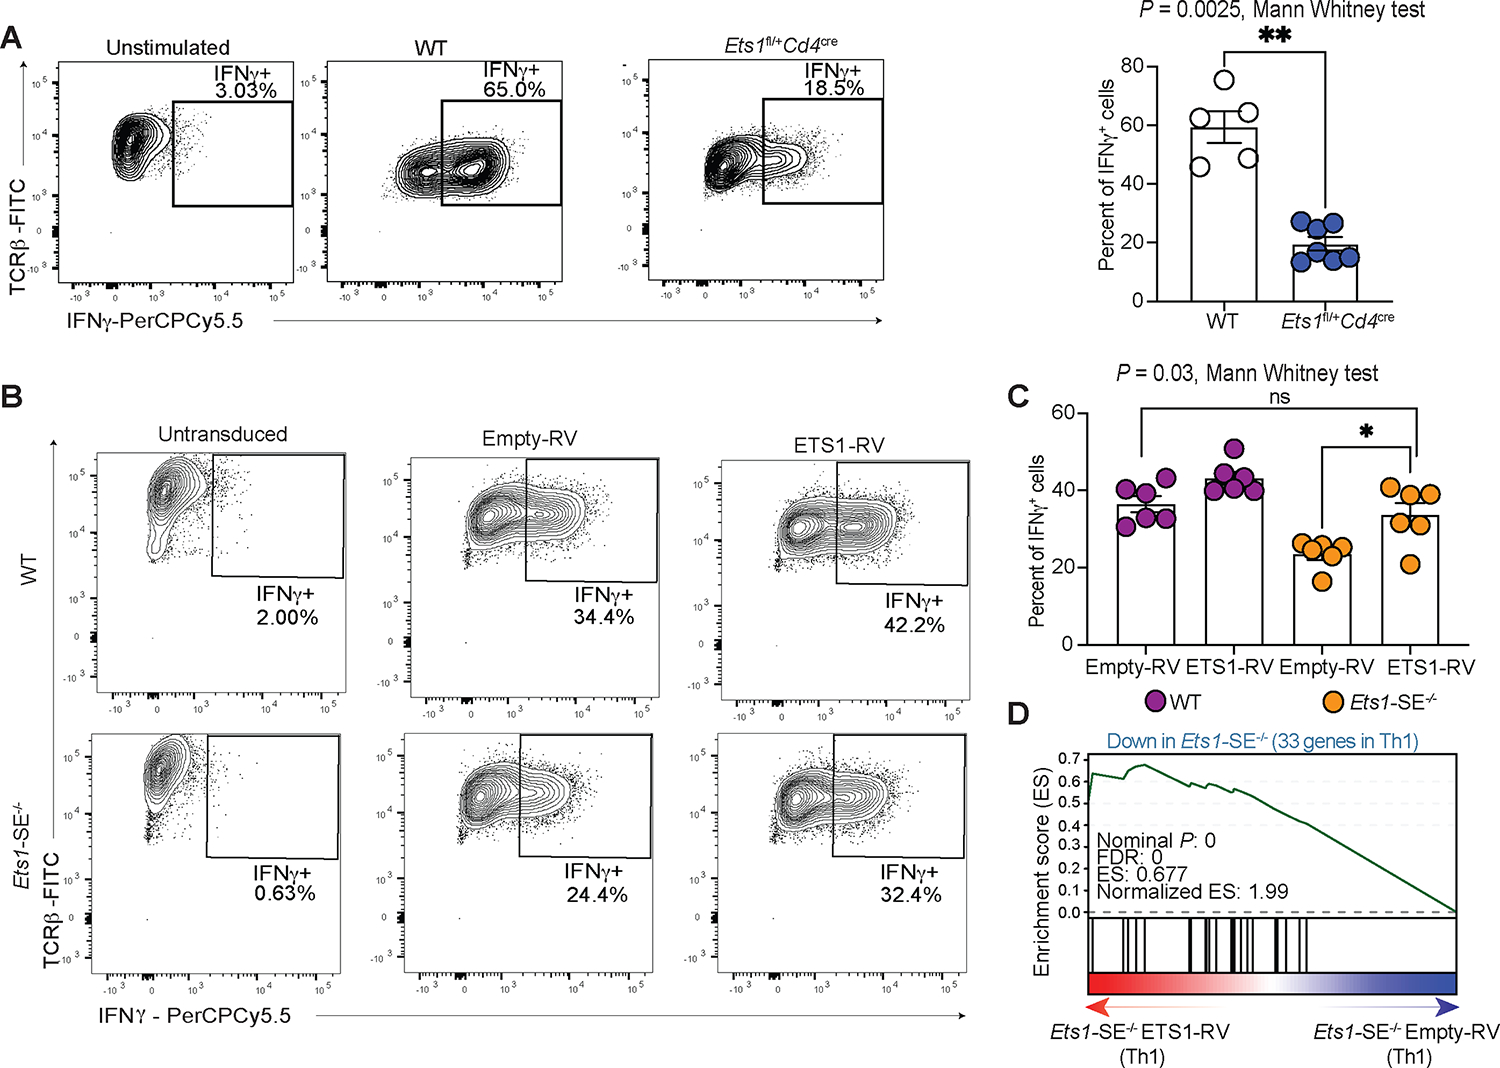
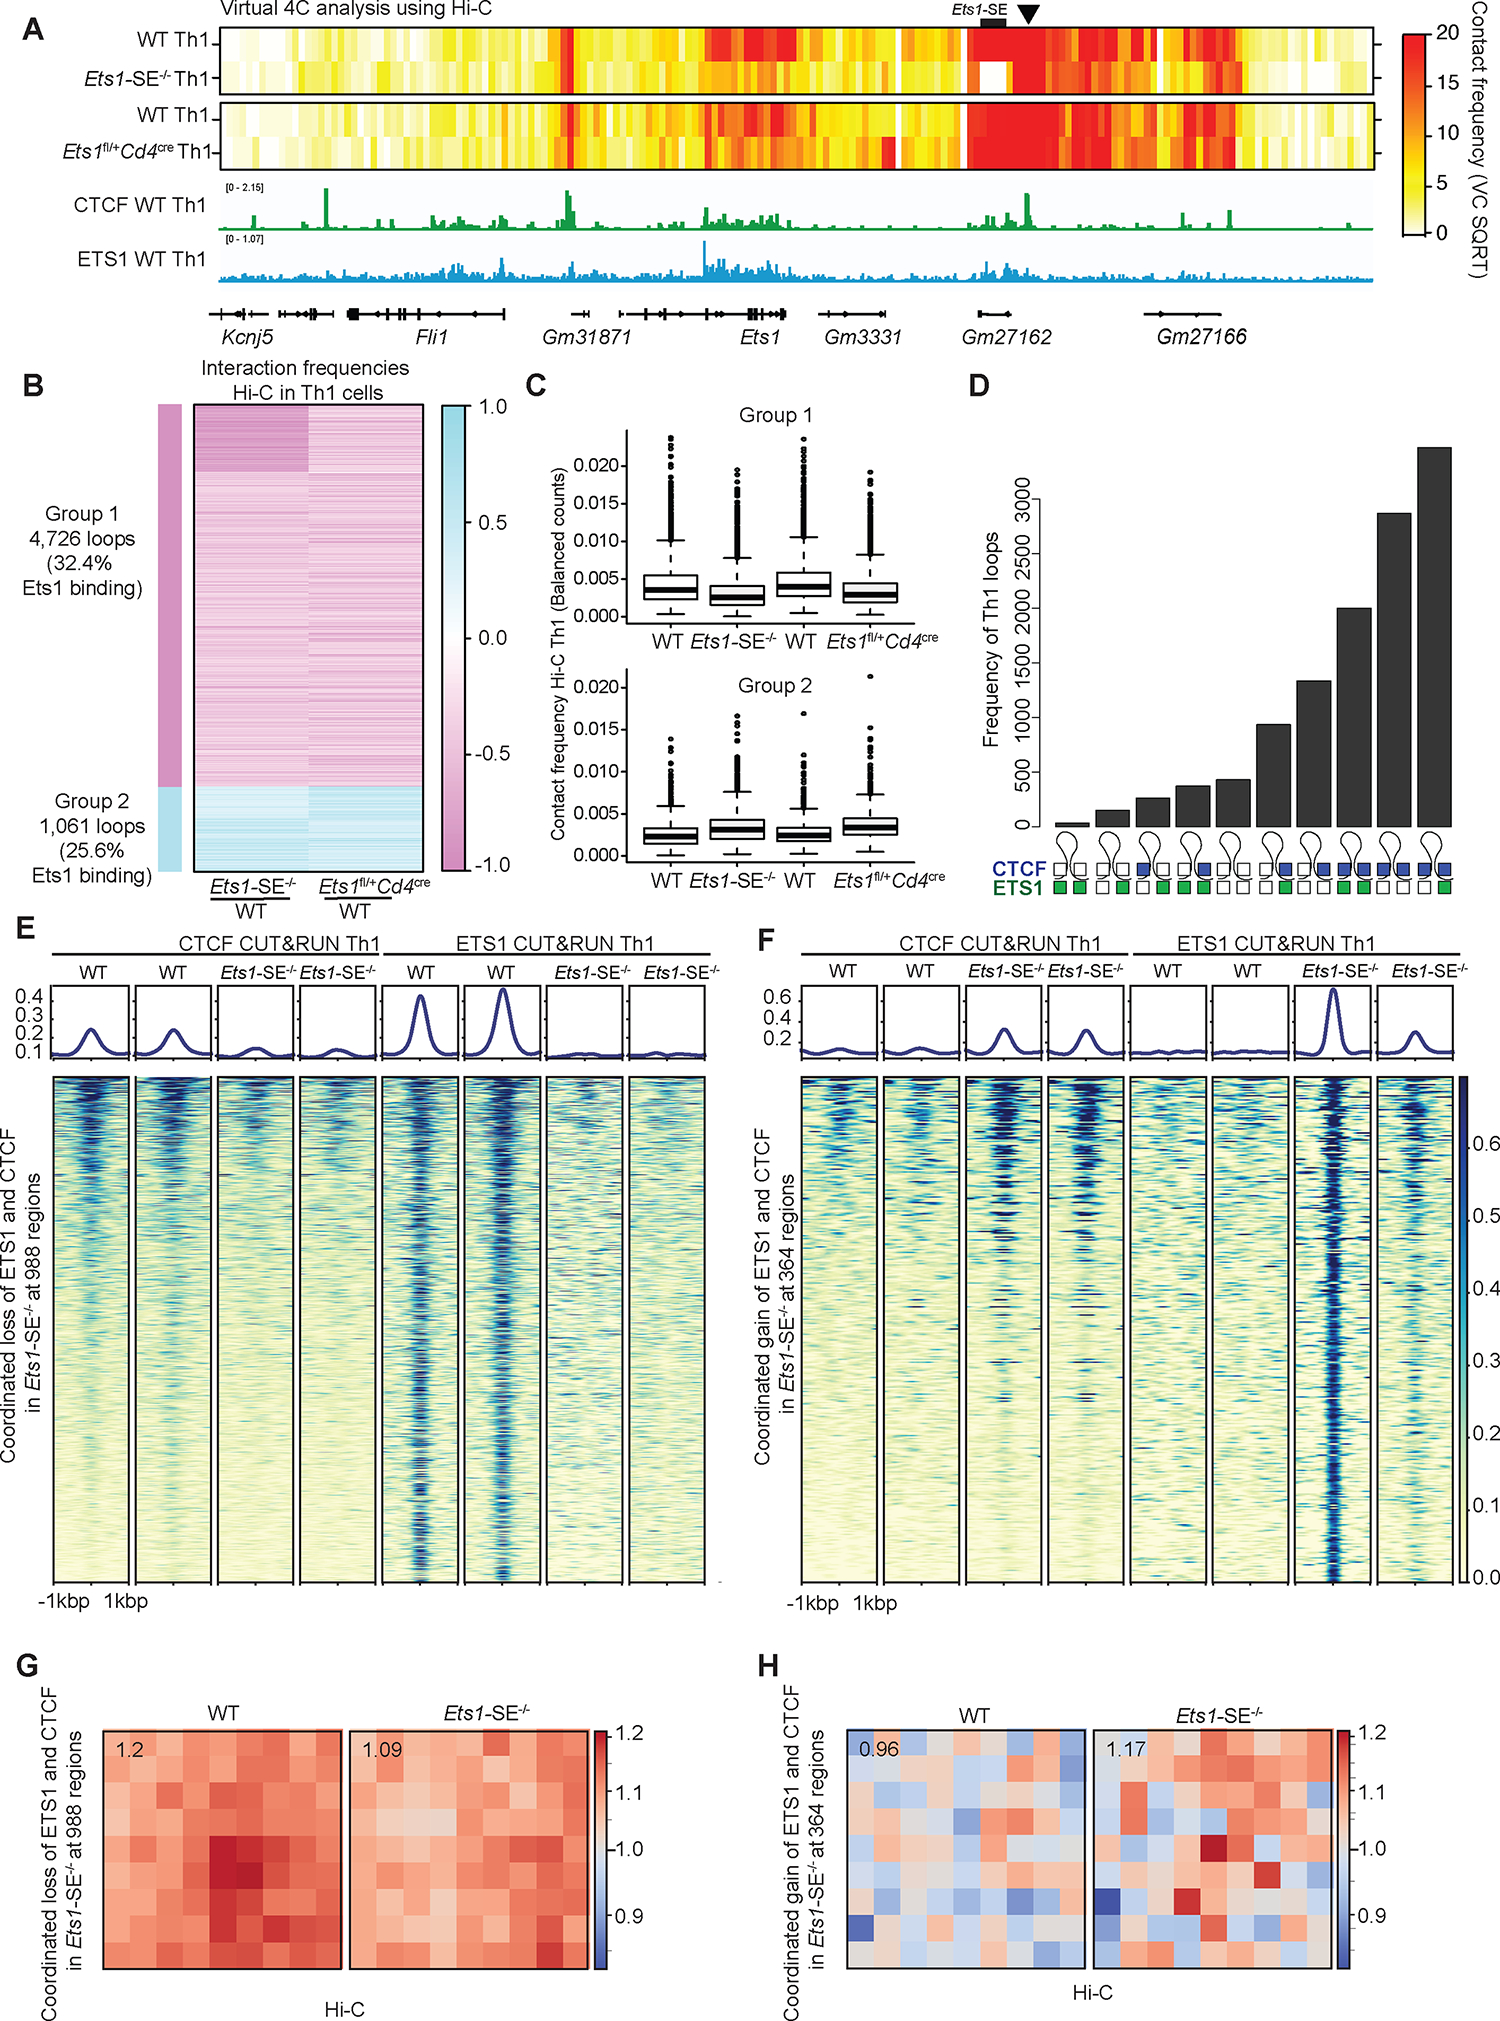
Multi-enhancer hubs are spatial clusters of enhancers present across numerous developmental programs. Here, we studied the functional relevance of these three-dimensional structures in T cell biology. Mathematical modeling identified a highly connected multi-enhancer hub at the Ets1 locus, comprising a noncoding regulatory element that was a hotspot for sequence variation associated with allergic disease in humans. Deletion of this regulatory element in mice revealed that the multi-enhancer connectivity was dispensable for T cell development but required for CD4+ T helper 1 (Th1) differentiation. These mice were protected from Th1-mediated colitis but exhibited overt allergic responses. Mechanistically, the multi-enhancer hub controlled the dosage of Ets1 that was required for CTCF recruitment and assembly of Th1-specific genome topology. Our findings establish a paradigm wherein multi-enhancer hubs control cellular competence to respond to an inductive cue through quantitative control of gene dosage and provide insight into how sequence variation within noncoding elements at the Ets1 locus predisposes individuals to allergic responses.

Keywords: 3D genome organization; CD4 T helper differentiation; ETS1; allergic inflammation; allergy; asthma; colitis; dosage control; multi-enhancer hubs; transcription factor.


Conflict of interest statement

Declaration of interests The authors declare no competing interests.

Figures

Figure 1:
Figure 1:. Exceptional enhancer connectivity at the Ets1-Fli1 locus
A, Plot depicts ranking versus number of connections in multi-enhancer hubs also referred to as 3D cliques, detected in double-positive (DP) T cells using H3K27ac HiChIP measurements generated in our previous study. Hyperconnected multi-enhancer hubs are defined as the ones above the elbow of the total connectivity ranking. Top two hyperconnected multi-enhancer hubs Bcl11b and Ets1-Fli1 are labeled. Number of interactions in each hub is provided in parenthesis. B, Venn-diagram depicts the overlaps of genomic regions within hyperconnected multi-enhancer hubs detected using H3K27ac HiChIP when compared to super-enhancers defined by H3K27ac ChIP-seq in DP T cells. Super-enhancers were defined based on H3K27ac ChIP-seq in DP T cells as described before. Odds ratio and Fisher’s exact test were used for statistical analysis. C, Bar-plot demonstrates the significance of gene-ontology terms enriched in genes encompassing multi-enhancer hubs. Metascape was used for gene-ontology analysis. Terms relating to immune response pathways are marked in red. D, The genome browser view demonstrates H3K27ac and CTCF ChIP-seq, as well as H3K27ac HiChIP 3D interactions at the Ets1-Fli1 locus in DP T cells, and the exact genomic location of E1-E3 probes used for “Oligopaint” DNA-FISH. The 25kbp super-enhancer which is the focus of this study is called Ets1-SE and is marked in red. FISH probes depicted in the browser view include E1 (enhancer upstream of Ets1 and proximal to Fli1 promoter, magenta), E2 (Ets1 promoter and gene-body, green) and E3 (Ets1-SE and a 25kbp enhancer downstream of Ets1-SE, red), representing the three independent 50kbp genomic regions for which Oligopaint probes were designed. E, Heatmaps demonstrate contact-frequency maps measured by Hi-C in CD4+ T cells in humans and mice. ChIP-seq tracks demonstrate CTCF binding in human CD4+ T cells and mouse DP T cells. SNPs associated with asthma and allergic diseases highlighted in red were curated from the GWAS catalog and meta-analysis studies for allergy, asthma, and atopic dermatitis,. Blue bars demonstrate statistically significant GWAS SNPs associated with diverse traits. The orthologous human coordinate of Gm27162 is highlighted in yellow (chr11:128,303,536–128,330,986). P-value and odds ratio were estimated by Fisher’s exact test. F, Box plots depict the pairwise spatial distance formed between E1, E2 and E3 probes (Mann-Whitney U test). Oligopaint 3D FISH, in 428 and 460 thymocytes were imaged using widefield microscopy from one wildtype and one Ets1-SE−/− mouse, respectively. Spots for each probe in Oligopaint 3D FISH data were analyzed in a semi-manual manner (Methods). G, Divided bar-plots demonstrating the proportion of mono vs. biallelic spatial contacts for E2 and E3 probes, in wildtype and Ets1-SE−/− cells. Only cells in which both alleles of both probes were detected, were used (112 wildtype cells and 53 Ets1-SE−/− cells). The distance cutoff used for E2 and E3 spatial contact was 0.7 μm. Pale gray represents no allele showing spatial contact, gray represents mono-allelic and dark gray represents bi-allelic contacts. H, Representative images of the Oligopaint FISH probes hybridization in one wildtype and one Ets1-SE−/− thymocytes, with magnification of pairwise contacts for each allele. DAPI: blue, E1: magenta, E2: green, E3: red. Scale-bar in whole cell: 5μm and scale-bar in magnification of allele: 1μm. White arrow represents the spatial overlap between E2 and E3.
Figure 2:
Figure 2:. Ets1-SE is dispensable for thymic T cell generation but is required for CD4+ Th1 differentiation
A, Plots demonstrate percentage of cells defined by flow cytometry analysis in the thymus from age matched wildtype and Ets1-SE−/− female mice. Data are representative of three independent experiments. Each dot represents an individual mouse (wildtype; n=7 - Ets1-SE−/−; n=7). Error bars = SEM; and P: ns = not significant, (DN, DP, nTregs, CD4+/CD8+ SP: Mann-Whitney U test; DN1-DN4, TCRβlow/high, Semi-Mature/Mature CD4+/CD8+: Two-way ANOVA with multiple comparisons and Bonferroni correction). B, Plots demonstrate percentages of cells defined by flow cytometry analysis in the lung Frequencies at steady state of lungs parenchyma CD4+ T cells (TCRβ+, CD4+), activated CD4+ T cells (TCRβ+, CD4+, CD44+), CD8+ T cells (TCRβ+, CD8+), activated CD8+ T cells (TCRβ+, CD8+, CD44+), CD4+ Th2 cells (TCRβ+, CD4+, GATA-3+) from age-matched wildtype and Ets1-SE−/− male mice. Data are representative of two independent experiments. Each dot represents an individual mouse (wildtype; n=4 - Ets1-SE−/−; n=4). Error bars = SEM; and P: ns = not significant, * =P≤0.05 (Mann-Whitney U test). C, (left) Representative flow cytometry contour plot of naive CD4+ T cells from wildtype or Ets1-SE−/− mice cultured under Th1, Th2 or Th17 polarizing conditions for 6 days. Unstained wildtype cells are shown for each polarizing condition as a negative control (wildtype FMO Control). (right) Frequencies of Th1 (IFNγ+), Th2 (IL-13+) or Th17 (IL-17+) cytokines producing CD4+ T cells cultured under Th1, Th2 or Th17 polarizing conditions for 6 days. All populations were pre-gated on SSC-A/FSC-A, Singlets and Viability (Live), TCRβ+ and CD4+ cells. Two independent experiments were pooled and were repeated five times. Each dot represents an individual mouse (wildtype; n=8 - Ets1-SE−/−; n=8). Error bars = SEM; and P: ns = not significant, * = P ≤0.05, ** = P ≤0.01, *** = P ≤0.0005, **** = P ≤0.0001 (Two-way ANOVA with multiple comparisons and Bonferroni correction). D, (left) Frequencies of induced Tregs (iTregs, FoxP3+ CD4+ cells) and mean fluorescence intensity (MFI) of FoxP3, CD25 and T-bet from naïve CD4+ T cells cultured under iTreg polarizing conditions for 3 days. (right) Representative histogram of the proportion of FoxP3+ CD4+ T cells 3 days after culturing in iTregs polarizing conditions. Data are representatives of two independent experiments. Each dot represents an individual mouse (wildtype; n=3 - Ets1-SE−/−; n=3). Error bars = SEM; and P: ns = not significant, * = P ≤0.05, ** = P ≤0.01, *** = P ≤0.0005, **** = P ≤0.0001 (Mann and Whitney).
Figure 3:
Figure 3:. Ets1-SE deletion limits Th1-mediated inflammation in vivo
A, Schematic representation of the CD45RBHigh-induced colitis model. 1×10⁶ FACS sorted TCRβ+, CD4+, CD45RBHigh naïve CD4+ T cells from wildtype or Ets1-SE−/− were transferred into Rag1−/− recipients to induce colitis. B, Weight loss tracking of Rag1−/− mice as compared to PBS-injected animals (controls) during 6 weeks post transfer. Three independent experiments were pooled and repeated four times. Dots represent the mean of individual mouse (PBS -> Rag1−/−; n= 5; wildtype -> Rag1−/−; n=25 and Ets1-SE−/− -> Rag1−/−; n=27). Error bars = SEM; and P: ns = not significant, * = P≤0.05, ** = P≤0.01, *** = P≤0.0005, **** = P≤0.0001 (Two-way ANOVA; Mixed-effect REML model with Fisher’s LSD Test). C, Quantification of colon length (cm) of Rag1−/− mice that received either 1×10⁶ FACS sorted TCRβ+, CD4+, CD45RBHigh naïve wildtype or Ets1-SE−/− CD4+ T cells at week 6 post transfer. Three independent experiments were pooled and repeated four times. Dots represent the mean of individual mouse (wildtype -> Rag1−/−; n=25 and Ets1-SE−/− -> Rag1−/−; n=27). Error bars = SEM; and P: ns = not significant, * = P ≤0.05, ** = P ≤0.01, *** = P ≤0.0005, **** = P ≤0.0001 (Mann-Whitney U Test). D, E Quantification of the histological score of paraffin-embedded colon rolls from Rag1−/− mice that received 1×10⁶ FACS sorted TCRβ+, CD4+, CD45RBHigh naïve CD4+ T cells from either wildtype or Ets1-SE−/− mice at week 6 post transfer and as compared to PBS-injected mice (control). Histological sections were obtained from two independent experiments and were scored in a blinded manner. Each dot represents an individual mouse (PBS -> Rag1−/−; n= 2, wildtype -> Rag1−/−; n=5 and Ets1-SE−/− -> Rag1−/−; n=8). Error bars = SEM; and P: ns = not significant, * = P≤0.05, ** = P ≤0.01, *** = P ≤0.0005, **** = P ≤0.0001 (One-way ANOVA with multiple comparisons and Bonferroni correction). E, Histological section of colon rolls stained with H&E of Rag1−/− mice that received either 1×10⁶ FACS sorted TCR+, CD4+, CD45RBHigh naïve wildtype or Ets1-SE−/− CD4+ T cells 6 weeks post transfer. Scale = 100μm; Magnification = 100X. F, (left) Quantification of infiltrating colon lamina propria (cLP) colitogenic CD4+ T cells of Rag1−/− mice that received either wildtype or Ets1-SE−/− CD4+ T cells. (middle) Quantification of Th1 (T-bet+), Th2 (GATA-3+), Th17 (RORγ-t+) CD4+ T cells among infiltrating cLP CD4+ T cells of Rag1−/− mice that received either wildtype or Ets1-SE−/− CD4+ T cells. (right) Quantification of Th1 (IFNγ+), Th2 (IL-13+), Th17 (IL-17+) and Granzyme B (GzmB+) producing CD4+ T cells among infiltrating cLP CD4+ T cells of Rag1−/− mice that received either wildtype or Ets1-SE−/− CD4+ T cells. Two independent experiments were pooled. Dots represent an individual mouse (Ets1-SE+/+ -> Rag1−/−; n=7 and Ets1-SE−/− -> Rag1−/−; n=7). Error bars = SEM; and P: ns = not significant, * = P ≤0.05, ** = P ≤0.01, *** = P ≤0.0005, **** = P≤0.0001 (CD4+ T cells: Mann-Whitney U Test; Th1/Th2/Th17/Treg and cytokines production: Two-way ANOVA with multiple comparisons and Bonferroni correction). G, (left) Quantification CD4+ T cells in the spleen of Rag1−/− mice that received wildtype or Ets1-SE−/− CD4+ T cells. (middle) Quantification in the spleen of Th1 (T-bet+), Th2 (GATA-3+), Th17 (RORγ-t+) CD4+ T cells of Rag1−/− mice that received either wildtype or Ets1-SE−/− CD4+ T cells. (right) Quantification of ex vivo stimulated splenic Th1 (IFNγ+), Th2 (IL-13+), Th17 (IL-17+) and Granzyme B (Gzm B+) producing CD4+ T cells of Rag1−/− mice that received either wildtype or Ets1-SE−/− CD4+ T cells. Data represent one experiment which was repeated three times. Dots represent an individual mouse (wildtype -> Rag1−/−; n=7 and Ets1-SE−/− -> Rag1−/−; n=7). Error bars = SEM; and p-values: ns = not significant, * = P≤0.05, ** = P ≤0.01, *** = P ≤0.0005, **** = P ≤0.0001 (CD4+ T cells: Mann-Whitney U Test; Th1/Th2/Th17/Treg and cytokines production: Two-way ANOVA with multiple comparisons and Bonferroni correction). H, Representative flow cytometry contour plot of Granzyme B- and IFNγ-producing ex vivo stimulated cLP CD4+ T cells of Rag1−/− mice that received either wildtype or Ets1-SE−/− CD4+ T cells. I, Schematic representation of the house dust mite (HDM) extract challenge. Arrows represent days by which intranasal HDM was administered. Mice were euthanized 16 days after the initial sensitization and immune cell infiltration was checked. Two independent experiments were used to measure immune cell infiltration in the lung parenchyma. J, Quantification of lung parenchyma infiltrating CD4+ T cells (TCRβ+, CD4+), activated CD4+ T cells (TCRβ+, CD4+, CD44+), CD8+ T cells (TCRβ+, CD8+), activated CD4+ T cells (TCRβ+, CD8+, CD44+), CD4+ Th2 cells (TCRβ+, CD4+, GATA-3+) and eosinophils (MHC-II, Siglec-F+) from wildtype or Ets1-SE−/− mice 16 days after HDM challenge. Two independent experiments were pooled. Each Dot represents an individual mouse (wildtype n=11 and Ets1-SE−/− n=11). Error bars = SEM; and ns = not significant, * = P ≤0.05, ** = P ≤0.01, *** = P ≤0.0005, **** = P ≤0.0001 (Mann-Whitney). K, Quantification of Th2 cells numbers from wildtype or Ets1-SE−/− mice producing IL-5, IL-13 or IL-5/IL-13 four hours after PMA and Ionomycin stimulation. Data are representative of one independent experiment and repeated twice. Each dot represents an individual mouse (wildtype n=6 and Ets1-SE−/− n=6). Error bars = SEM; and P: ns = not significant, * = P ≤0.05, ** = P ≤0.01, *** = P ≤0.0005, **** = P ≤0.0001 (Two-way ANOVA with multiple comparison and Bonferroni correction).
Figure 4.
Figure 4.. Reorganization of the multi-enhancer hub in the absence of the Ets1-SE element
A, Barplot demonstrates normalized mRNA levels of Ets1 and Fli1 using bulk RNA-seq experiments in wildtype and Ets1-SE−/− naïve CD4+ and in vitro polarized Th1 and Th2 cells performed in three replicates. B, Volcano plot demonstrates differential expression analysis of bulk RNA-seq experiments in wildtype and Ets1-SE−/− in vitro Th1 polarized cells studied at day 6. Three replicates were used to perform DESeq2 analysis and |log2FC|>1, adjusted P <0.05 were used to determine differentially expressed genes. C, Pre-ranked Gene Set Enrichment Analysis (GSEA) depicts the enrichment of gene-set for downregulated genes in Ets1-SE−/− compared with wildtype Th1 cells. The pre-ranked genes were defined based on DESeq2 analysis of wildtype Th1 and Th2 cells. D,E, Weighted nearest neighbor UMAP (wnnUMAP) projection, which uses both gene expression and chromatin accessibility measurements for dimensionality reduction and clustering of single cell multiomics analysis on wildtype and Ets1-SE−/− day 1 and day 6 Th1 cells using technical replicates, showing mRNA level of Ifng, Ets1, Tcf7, Cd69, Nr4a1, and Mki67 in each cell. e, cluster numbers across wnnUMAP. F, Barplots showing the composition of each of the 9 clusters including proportion and contribution from each of the four conditions: wildtype and Ets1-SE−/− Th1 after day 1 and day 6 of in vitro cluster. Biological replicates were performed and cells were pooled. G, Violin plots showing the expression levels of Ets1 and Ifng across individual wildtype and Ets1-SE−/− cells within clusters annotated as resting CD4+ T cells (clusters 0,7), activated CD4+ T cells (clusters 2, 3, 6), Th1 cells (clusters 1, 4, 8) and proliferating Th1 cells (cluster 5). H, Representative pseudo-bulk ATAC-seq tracks from scATAC-seq modality in multiome of proliferating Th1 cells (cluster 5), showing comparable chromatin accessibility between wildtype and Ets1-SE−/− Th1 cells.
Figure 5:
Figure 5:. ETS1 dosage controls Th1 differentiation
A, Flow cytometry results demonstrating frequency of IFNγ expressing cells under unstimulated (left) and in vitro Th1 polarization for 6 days in wildtype (middle) and Ets1 heterozygous mice (Ets1fl/+Cd4cre) (right). The right panel shows bar plot of average results from two independent experiments. Each dot represents an individual mouse. Statistical significance was evaluated using non-parametric Mann-Whitney test. ** P = 0.0025. B, Flow cytometry results demonstrating frequency of IFNγ expressing cells when naïve CD4+ T cells were retrovirally transduced with empty vector (Empty-RV) or ETS1 expressing vector (ETS1-RV) and were polarized under in vitro Th1-differentiating conditions for 6 days. The panel shows representative contour plots, C, panel shows bar plot of average results from two independent experiments. Each dot represents an individual mouse. Significance was tested using non-parametric Mann-Whitney test. * P = 0.03. D, Pre-ranked Gene Set Enrichment Analysis (GSEA) depicts the enrichment of the downregulated genes in Ets1-SE−/− compared with wildtype Th1 cells as gene-set. The pre-ranked genes based on DESeq2 analysis of Ets1-SE−/− cells transduced with empty-vector and ETS1-expressing vector. Three technical replicates were used for DESeq2 analysis.
Figure 6:
Figure 6:. Ets1 level controls the 3D genome topology of Th1 cells in a CTCF-dependent manner
A, Heatmap of contact frequencies from virtual 4C analysis of Hi-C data generated from wildtype, Ets1-SE−/− and Ets1fl/+Cd4cre Th1 cells, using the immediate downstream locus of Ets1-SE as the 4C-anchor (chr9:32,940,001–32,945,000) (marked with black arrow). The genome browser view of the corresponding locus is shown along with CTCF and ETS1 binding tracks generated from CUT&RUN on wildtype Th1 cells. B, Heatmap showing log2 fold change in interaction frequencies from Hi-C in Ets1-SE−/− and Ets1fl/+Cd4cre Th1 cells, compared to their respective matched wildtype controls. Group 1 which includes 4,726 loops demonstrates weaker interactions in in Ets1-SE−/− and Ets1fl/+Cd4cre Th1 cells, compared to their respective matched wildtype controls. Group 2 which includes 1,061 loops demonstrates stronger interactions in in Ets1-SE−/− and Ets1fl/+Cd4cre Th1 cells, compared to their respective matched wildtype controls. The percentage of loops with ETS1 binding based on CUT&RUN in wildtype Th1 cells is also provided. Each row represents an individual interaction or a loop. C, Boxplot showing average interaction frequencies from Hi-C in Ets1-SE−/− and Ets1fl/+Cd4cre Th1 cells, and their respective matched wildtype controls, using group 1 and group 2 loops. D, UpSet plot demonstrates the number of Th1-associated loops with different binding patterns of CTCF and ETS1 across two loop anchors. A filled square represents bound, and an open square represents no binding. Blue and green squares represent CTCF and ETS1 binding, respectively. Bedtools intersect was used to define overlapping peaks with loop anchors detected in Th1 cells. E,F, Heatmap demonstrates CTCF and ETS1 occupancy levels at genome regions where both proteins are lost (f) and gained (g) in Ets1-SE−/− compared with wildtype Th1 cells. DESeq2 was used to define co-bound regions by ETS1 and CTCF measured by CUT&RUN with differential occupancy between wildtype and Ets1-SE−/− Th1 cells using P<0.05 & |logFC|>0.5. G,H, Loop pileups of long-range interactions anchored at genomic regions described in (e) and (f) with lost (g) and gained (h) occupancy generated by coolpuppy. Hi-C data in wildtype and Ets1-SE−/− Th1 cells were used. The number in the top left corner represents the average intensity in 3×3 box at the center.

References

    1. Phanstiel DH et al. Static and Dynamic DNA Loops form AP-1-Bound Activation Hubs during Macrophage Development. Mol Cell 67, 1037–1048 e6 (2017). - PMC - PubMed
    1. Lim B & Levine MS Enhancer-promoter communication: hubs or loops? Curr Opin Genet Dev 67, 5–9 (2021). - PMC - PubMed
    1. Jiang T et al. Identification of multi-loci hubs from 4C-seq demonstrates the functional importance of simultaneous interactions. Nucleic Acids Res 44, 8714–8725 (2016). - PMC - PubMed
    1. Tsai A, Alves MR & Crocker J Multi-enhancer transcriptional hubs confer phenotypic robustness. Elife 8(2019). - PMC - PubMed
    1. Allahyar A et al. Enhancer hubs and loop collisions identified from single-allele topologies. Nat Genet 50, 1151–1160 (2018). - PubMed

Publication types