. 2023 Jun 13;10(6):ENEURO.0450-22.2023.
doi: 10.1523/ENEURO.0450-22.2023. Print 2023 Jun.

Target-Distractor Competition Modulates Saccade Trajectories in Space and Object Space

Affiliations

Target-Distractor Competition Modulates Saccade Trajectories in Space and Object Space

Caroline Giuricich et al. eNeuro. .

Abstract

Saccade planning and execution can be affected by a multitude of factors present in a target selection task. Recent studies have shown that the similarity between a target and nearby distractors affects the curvature of saccade trajectories, because of target-distractor competition. To further understand the nature of this competition, we varied the distance between and the similarity of complex target and distractor objects in a delayed match-to-sample task to examine their effects on human saccade trajectories and better understand the underlying neural circuitry. For trials with short saccadic reaction times (SRTs) when target-distractor competition is still active, the distractor is attractive and saccade trajectories are deviated toward the distractor. We found a robust effect of distance consistent with saccade vector averaging, whereas the effect of similarity suggested the existence of an object-based suppressive surround. At longer SRTs, there was sufficient time for competition between the objects to complete and the distractor to be repulsive, which resulted in saccade trajectory deviations away from the distractor exhibiting the effects of a spatial suppressive surround. In terms of similarity, as the target-distractor similarity decreased, the initial saccade angle shifted toward the target, reflecting stronger distractor inhibition. There were no interactions between distance and similarity at any point in the time course of target-distractor competition. Together, saccade trajectories reflect target-distractor competition that is affected independently by both spatial and object space suppressive surrounds. The differences in saccade trajectories at short and long SRTs distinguish between active and completed decision-making processes.

Keywords: attention; competiton; object representation; saccade trajectory; suppressive surrounds; target selection.


Conflict of interest statement

The authors declare no competing financial interests.

Figures

None
Graphical abstract
Figure 1.
Figure 1.
A, B, Stimulus sets. The stimuli were numbered from 1 to 6 (left to right). The difference between stimulus numbers gives rise to the number of line differences (objective similarity levels).
Figure 2.
Figure 2.
Task paradigm and display layout. A, Task paradigm. Participants fixated on the central cross and pressed a button to move to the target preview. Once ready, they pressed the button again to start the search. Participants stabilized fixation for 200 ms, then the display came on. The target and distractor remained visible until the participant fixated on an object or until 750 ms had passed. B, Sixteen possible object locations, 22.5° apart, at an eccentricity of 8 dva. The target was randomly placed at one location, and the distractor was placed relative to the target on the clockwise or counterclockwise side. C, AD locations relative to the target. With the target (T) at the top location as an example, the distractor could be placed from 1 to 5 positions clockwise, or from 1 to 5 positions counterclockwise.
Figure 3.
Figure 3.
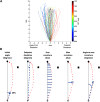
Individual saccade traces and saccade metric measurements. A, Eighty random individual saccades from the angular distance 3 condition collapsed across objective similarity colored by SRT, as shown by the colorbar. The darkest blue was assigned to trials with SRTs closest to 500 ms, and the darkest red was assigned to trials with SRTs closest to 100 ms. The black circle represents the target position at 8 dva. B, Red dots represent eye position coordinates from a saccade trajectory recorded at 2 ms intervals. The black circle and square represent the target and distractor, respectively, and the black cross represents central fixation. Solid blue lines represent the metric itself, whereas dashed blue lines represent the depiction of the calculation. The trajectory is rotated for the curvature metrics so that the final point of the saccade lies on the vertical line connecting the fixation cross to the target position.
Figure 4.
Figure 4.
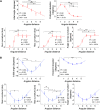
Metrics over time and transition period ranges. A, Metrics plotted over STOA. Points were calculated by averaging data over a 10 ms window. Colored dots above the x-axis represent significant deviations from zero, as calculated through t tests performed on each point. Gray arrows pointing up represent deviations toward the distractor, and gray arrows pointing down represent deviations away from the distractor. Shaded colored regions represent the transition period for each metric that was removed from analysis because of those points not being significantly deviated from zero. B, Transition period ranges by metric over SRT, ordered by midpoint from earliest to latest. The transition period is represented by the box and the midpoint is shown with a black vertical line. Each solid-colored line represents the short SRT period where that metric significantly deviated toward the distractor. Each dashed-colored line represents the long SRT period where that metric significantly deviated away from the distractor.
Figure 5.
Figure 5.
Saccade latency distribution and accuracy. Shaded colored regions cover the transition period for each metric that was removed from analysis. A, Saccade latency distribution plotted in red over STOA as a proportion of total trials. Saccade latency distribution plotted in gray for lone-target (no distractor) trials. B, Accuracy plotted over STOA as a percentage of total trials.
Figure 6.
Figure 6.
Average saccade plots for short and long SRTs split by AD and OS. Shaded regions represent the SEM for each average point along the trajectories. The black cross represents the fixation point. The black circle represents the target position at 8 dva. A, Average saccades for each AD for short SRTs. B, Average saccades for each OS for short SRTs. C, Average saccades for each AD for long SRTs. D, Average saccades for each OS for long SRTs.
Figure 7.
Figure 7.
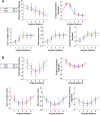
Saccade metric averages over AD with curve fits for short and long SRTs. Metric values were averaged across all objective similarity levels. Curve fits were chosen according to goodness-of-fit metrics (R2, AIC, p). Plots include the respective R2, p-values, and AIC. Error bars are SEM. Brackets indicate significant differences (*p < 0.05, **p < 0.01, ***p < 0.001) from Scheffé’s test post hoc analysis. A, Metrics over AD for short SRTs. Curve fits from left to right: top, linear, sigmoid; bottom, sigmoid, sigmoid, Gaussian. B, Metrics over AD for long SRTs. Curve fits were all Gaussian except for end point deviation, which was fit with a quadratic.
Figure 8.
Figure 8.
Saccade metric averages over OS with curve fits for short and long SRTs. Metric values were averaged across all angular distances. Curve fits were chosen according to goodness-of-fit metrics (R2, AIC, p). Plots include the respective R2, p-values, and AIC. Error bars are SEM. A, Metrics over OS for short SRTs. Curve fits were all quadratic except linear for the initial angle. B, Metrics over OS for long SRTs. Curve fits were all quadratic.
Figure 9.
Figure 9.
Metrics over AD with separate lines for OSs 1–4, plotted for short and long SRTs. Each plot was fit with the respective best fit per metric from the average metric plots. A, Metrics over AD with split OS lines for short SRTs. B, Metrics over AD with split OS lines for long SRTs.
Figure 10.
Figure 10.
Metrics over OS with separate lines for ADs 1–5, plotted for short and long SRTs. Each plot was fit with the respective best fit per metric from the average metric plots. A, Metrics over OS with split AD lines for short SRTs. B, Metrics over OS with split AD lines for long SRTs.
Figure 11.
Figure 11.
Initial angle and end point deviation at short SRTs versus vector average and direct to target (winner-take-all). A, Average initial angle and end point deviation compared with the vector average between the target and distractor, and the direct-to-target trajectory over angular distance in degrees. A saccade made directly to the distractor would fall on the y-axis. B, Distractor weight based on initial angle and end point deviation values over angular distance in degrees. Both sets of data were fitted with an exponential curve.

References

    1. Baylis GC, Rolls ET (1987) Responses of neurons in the inferior temporal cortex in short term and serial recognition memory tasks. Exp Brain Res 65:614–622. 10.1007/BF00235984 - DOI - PubMed
    1. Bisley JW, Goldberg ME (2003) Neuronal activity in the lateral intraparietal area and spatial attention. Science 299:81–86. 10.1126/science.1077395 - DOI - PubMed
    1. Boehler CN, Tsotsos JK, Schoenfeld MA, Heinze HJ, Hopf JM (2009) The center-surround profile of the focus of attention arises from recurrent processing in visual cortex. Cereb Cortex 19:982–991. 10.1093/cercor/bhn139 - DOI - PubMed
    1. Boyd JR (2018) A discourse on winning and losing. Maxwell Air Force Base, AL: Air UP.
    1. Cohen MS, Freeman JT, Wolf S (1996) Metarecognition in time-stressed decision making: recognizing, critiquing, and correcting. Hum Factors 38:206–219. 10.1518/001872096779048020 - DOI

Publication types

LinkOut - more resources