. 2023 Jun 1;14(1):3172.
doi: 10.1038/s41467-023-38920-9.

Rio1 downregulates centromeric RNA levels to promote the timely assembly of structurally fit kinetochores

Affiliations

Rio1 downregulates centromeric RNA levels to promote the timely assembly of structurally fit kinetochores

Ksenia Smurova et al. Nat Commun. .

Abstract

Kinetochores assemble on centromeres via histone H3 variant CENP-A and low levels of centromere transcripts (cenRNAs). The latter are ensured by the downregulation of RNA polymerase II (RNAPII) activity, and cenRNA turnover by the nuclear exosome. Using S. cerevisiae, we now add protein kinase Rio1 to this scheme. Yeast cenRNAs are produced either as short (median lengths of 231 nt) or long (4458 nt) transcripts, in a 1:1 ratio. Rio1 limits their production by reducing RNAPII accessibility and promotes cenRNA degradation by the 5'-3'exoribonuclease Rat1. Rio1 similarly curtails the concentrations of noncoding pericenRNAs. These exist as short transcripts (225 nt) at levels that are minimally two orders of magnitude higher than the cenRNAs. In yeast depleted of Rio1, cen- and pericenRNAs accumulate, CEN nucleosomes and kinetochores misform, causing chromosome instability. The latter phenotypes are also observed with human cells lacking orthologue RioK1, suggesting that CEN regulation by Rio1/RioK1 is evolutionary conserved.


Conflict of interest statement

The authors declare no competing interests.

Figures
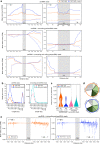
Fig. 1
Fig. 1. Characterisation of centromere and pericentromere transcripts.
a Upper, middle and bottom plots: the number of cenRNA reads; cen- and noncoding pericenRNA reads; cen-, noncoding pericen-, and coding pericenRNA reads (as mean read counts), respectively, deriving from all sixteen chromosomes and tallied from three independent experiments (n = 3), are plotted against the sequences from which they derived. The CEN core regions are indicated by a grey column. The full lines represent the read pairs deriving from the upper strand, the dashed lines those deriving from the lower strand. Orange lines: RIO1-AID cells treated with a mock for 1 h (n = 3), blue lines: RIO1-AID cells treated with 500 µM auxin for 1 h (n = 3). The left and right plots comprise 500 bp and 100 bp of the periCEN regions surrounding the CEN core sequences, respectively. b Left plot: length-based distribution of the cenRNA reads deriving from all chromosomes. Right plot: length-based distribution of all noncoding pericenRNA reads deriving from all chromosomes. The cen- and noncoding pericenRNA reads identified in RIO1-AID cells treated with a mock (tallied from three replicate experiments, n = 3) are indicated in orange and pink, respectively. The cen- and noncoding pericenRNA reads identified in RIO1-AID cells (tallied from three replicate experiments, n = 3) treated with auxin are shown in dark and light blue, respectively. c Violin plot of the length-based distribution of cenRNA reads (classified by short or long) and of noncoding pericenRNA reads in RIO1-AID cells treated with a mock or auxin (three replicate experiments, n = 3). d Distribution of cenRNA reads that contain the entire CEN core sequence (“CEN”) or that terminate in a specific CEN element (CDEI, CDEII, CDEIII) in RIO1-AID cells treated with a mock (encircled in orange) or auxin (encircled in blue) (three experimental replicates, n = 3). The filled and open slices indicate the percentage of reads deriving from the upper and lower strand, respectively. e Distribution of the start sites of cen- and noncoding pericenRNA reads in RIO1-AID cells treated with a mock (left plot) or auxin (right plot). Full and dashed lines: read start sites localising on the upper and lower strand, respectively (three experimental replicates, n = 3).
Fig. 2
Fig. 2. Cell cycle stage-dependent regulation of cen- and noncoding pericenRNA levels.
a Cen- and noncoding pericenRNA levels deriving from chromosomes 5 and 8 as measured (RT-qPCR) in RIO1 cells, and in RIO1-AID cells treated with a mock or 500 µM auxin. Their concentrations were normalised to those of ACT1 mRNA (RT-qPCR), and referenced to the corresponding transcript levels in the RIO1 strain (value = 1). The singular data (white circles) derived from five biological experiments (n = 5) and are shown combined as mean ± SEM (standard error of the mean). Confidence levels (P-values) were calculated with the unpaired, two-tailed Student’s t test. b Cen5 and noncoding pericen5 RNAs, cen8 and noncoding pericen8 RNAs measured by RT-qPCR through a synchronous cell cycle (α-factor arrest-and-release) in the RIO1-AID strain treated with a mock or 500 µM auxin (three replicates per condition, n = 3). Transcript levels were normalised to those of ACT1. P-values (measured using the unpaired, two-tailed Student’s t test) comparing the mock and auxin data are shown in Supplementary Fig. 3e. c Plot: immunofluorescence imaging (IF)-based analysis of 6Myc-Rio1 (anti-Myc) and Ndc80-GFP (anti-GFP) levels in spread nuclei isolated from yeast through the cell cycle (α-factor arrest-and-release). n indicates the number of cells (circles) analysed, deriving from three replicate experiments. The combined data are shown as mean ± SD (standard deviation). Blots: western blots of 6Myc-Rio1 (anti-Myc) and Pgk1 (anti-Pgk1, loading control) through the cell cycle (from the cell samples taken during the upper-plot experiment). Images: representative IF images of spreads analysed at the indicated time points. d Cen5 and cen8 RNA numbers measured in wild-type yeast (NDC10) and in an ndc10-1 mutant synchronously released into the cell cycle at 37 °C. Transcript levels were normalised to those of ACT1. P-values (unpaired, two-tailed Student’s t test) comparing the mock and auxin data are shown in Supplementary Fig. 3f. e Relative RNA polymerase II levels at CEN5 and CEN8 as determined by ChIP-qPCR analysis in asynchronous NDC10 and ndc10-1 cultures following a 3 h shift from 25 °C to 37 °C. The error bars represent SEM. P-values were calculated with the unpaired, two-tailed Student’s t test.
Fig. 3
Fig. 3. Rio1 downregulates RNAPII recruitment and activity at (peri)centromeres.
a CenRNA levels measured by RT-qPCR analysis in wild-type yeast (RIO1), in the RIO1-AID strain treated with 500 µM auxin or a mock, in a cbf1∆ mutant, and in a cbf1∆ RIO1-AID strain treated with 500 µM auxin or a mock. Transcript concentrations were normalised to those of ACT1 and then referenced to the corresponding cenRNA levels measured in the wild-type strain (value = 1). Singular data (white circles) deriving from five biological replicates (n = 5) are shown combined as mean ± SEM. P-values were calculated with the unpaired, two-tailed Student’s t test. b RNA polymerase II levels at CEN5-periCEN5 and CEN8-periCEN8 as determined by anti-RNAPII ChIP-qPCR analysis in early S-phase RIO1-AID cells (following α-factor arrest-and-release) in the presence of 500 µM auxin or a mock. The data were normalised to those measured in the mock-treated cells (four replicate experiments (n = 4), shown as mean ± SEM). P-values were calculated with the unpaired, two-tailed Student’s t test. c RNA polymerase II levels at CEN5-periCEN5 and CEN8-periCEN8, measured by anti-RNAPII ChIP-qPCR analysis in G1, S-phase, and metaphase RIO1-AID cells, following α-factor arrest-and-release in the presence of 500 µM auxin or a mock. The data were normalised to those measured in G1 (α-factor arrested cells). The results derived from five replicate experiments (n = 5) and are shown as mean ± SEM. P-values were calculated with the unpaired, two-tailed Student’s t test. d Cen5 and pericen5 RNA levels measured by RT-qPCR analysis in RIO1 and RIO1-AID cells treated with a mock, 3 µM thiolutin and/or 500 µM auxin. The cells were released from G1 and analysed in early S-phase (five experimental replicates per condition, n = 5). Transcript levels were normalised to those measured in the untreated wild-type strain at T = 0 min. The singular data (white circles) are shown combined as mean ± SEM. P-values were calculated with the unpaired, two-tailed Student’s t test.
Fig. 4
Fig. 4. Regulation of cen- and pericenRNA levels by Rio1, Rat1, and TRAMP/nuclear exosome activities.
Cen- and pericenRNA levels measured in the wild-type (RIO1), RIO1-AID, TRF4-AID, RIO1-AID TRF4-AID, RAT1-AID, RIO1-AID RAT1-AID, and RIO1-AID TRF4-AID RAT1-AID strains treated for 1 h with 500 µM auxin (five experimental replicates for each strain (n = 5)). The indicated cen- and pericenRNAs (upper and lower plots, respectively) were quantitated by RT-qPCR analysis, normalised to those of ACT1 mRNA (RT-qPCR), and then referenced to the values determined for the RIO1 strain (value = 1). The striped-line patterns indicate double and triple protein depletions, with each color representing one depleted protein. The singular data (white circles) are shown combined as mean ± SEM. P-values were calculated with the unpaired, two-tailed Student’s t test.
Fig. 5
Fig. 5. Rio1 promotes the timely formation of structurally fit kinetochores.
a Real-time quantitative analysis of Ndc80-3GFP fluorescence levels at kinetochores in a RIO1-AID strain released from G1 in the presence of 500 µM auxin or a mock, and tracked through S-phase. The number of cells analysed (n) at each time-point derived from three independent biological experiments. The cells were imaged across different microscopy fields through 20–30 Z-planes, which were then vertically projected at maximum intensity to measure the fluorescence signals. A.U. arbitrary units. The data are plotted as mean ± SD, P-values were calculated with the unpaired, two-tailed Student’s t test. b Fluorescence levels of GFP-labelled kinetochore proteins at spindle-bound kinetochores in RIO1-AID strains treated with 500 µM auxin or a mock. The number of cells analysed (n) per cell cycle stage (G1, S-phase (S), metaphase (M), and anaphase (A)) derived from three independent biological experiments. The cells were imaged across different microscopy fields through 20–30 Z-planes, which were then vertically projected at maximum fluorescence intensity for signal measurement. A.U. arbitrary units. The data are plotted as mean ± SD. P-values were calculated with the unpaired, two-tailed Student’s t test. c Whole-cell levels of epitope-tagged Cse4, Mif2, Cnn1, and Ndc80 measured by western blot in RIO1-AID cells treated with auxin or a mock. OsTir1 or Pgk1 acted as the loading controls and internal references for relative quantifications (blots are shown in Supplementary Fig. 7a). The measurements were normalised to those quantitated in the mock-treated cells (value = 1). The singular data (white circles) derived from three independent biological experiments (n = 3) and are combined as mean ± SEM. P-values were calculated with the unpaired, two-tailed Student’s t test.
Fig. 6
Fig. 6. Rio1 prevents the formation of ectopic, immature kinetochores.
a Representative images of Cse4-GFP-Cse4 localising ectopically (indicated by white arrowheads) in all cell cycle stages (identified by the position of mCherry-labelled spindle pole protein Spc110) of RIO1-AID cells treated with 500 µM auxin. b Percentage of RIO1-AID cells treated with 500 µM auxin or a mock that contained an unaligned, ectopic Cse4-GFP-Cse4 signal as identified in various cell cycle stages. The number of cells analysed (n) derived from three independent experiments. The data are shown as mean ± SD, and the P-values were calculated with the unpaired, two-tailed Student’s t test. c Ratio between the ectopic and spindle-aligned Cse4-GFP-Cse4 signals in various cell cycle stages. The number of cells analysed (n) derived from three independent experiments. The data are shown as mean ± SD. P-values were calculated with the unpaired, two-tailed Student’s t test. d Representative images of ectopic Cse4-GFP-Cse4 (indicated by white arrow heads) identified in RIO1-AID cells with marked spindle poles (Spc110-mCherry), genomic chromatin (Rap1-CFP), and nucleolus (Nop1-mCherry), treated for 1 h with 500 µM auxin. e Localisation of Cse4 at centromeres (CEN5, CEN8), at the ACT1 locus, and at various loci and promoters to which Cse4 was shown to bind when overexpressed, , as determined by ChIP-qPCR analysis. The singular data (white circles) were obtained from five independent biological experiments, and are shown combined as mean ± SD. P-values were calculated with the unpaired, two-tailed Student’s t test.
Fig. 7
Fig. 7. RNA turnover prevents anomalous kinetochore formation and chromosome loss.
a Representative images of Cse4-GFP-Cse4 in a cbf1Δ mutant and in TRF4-AID cells treated with 500 μM auxin or a mock. Spindle pole marker mCherry-Spc110 was used to designate the cell cycle stages. Ectopic Cse4-GFP-Cse4 signals are indicated with a white arrowhead. Right plot: Ratio between the fluorescence signal of ectopic Cse4-GFP-Cse4, and that of Cse4-GFP-Cse4 localising to pole-clustered (G1, S-phase, anaphase) or bi-oriented (metaphase) kinetochores in TRF4-AID cells treated with 500 µM auxin. The number of cells analysed (n) derived from three replicate experiments. The data are shown as mean ± SD, P-values were calculated with the unpaired, two-tailed Student’s t test. b Percentage of wild-type (CBF1), cbf1Δ, and TRF4-AID yeast cells treated with a mock or 500 µM auxin that exhibited an ectopic Cse4-GFP-Cse4 signal in G1, S-phase (S), metaphase (M), and anaphase (A). The number of cells analysed (n) derived from three replicate experiments. The data are presented as mean ± SD. P-values were calculated with the unpaired, two-tailed Student’s t test. c Cse4-3HA levels measured by western blot in CBF1, cbf1Δ, and TRF4-AID yeast cells treated with 500 µM auxin or a mock. Pgk1 acted as the loading control and reference for relative quantifications (the blots are shown in Supplementary Fig. 7b). The measurements derived from three replicate experiments (n = 3) and were normalised to those measured in the wild-type cells (value = 1). Singular data (white circles) are combined as mean ± SEM. P-values were calculated with the unpaired, two-tailed Student’s t test. d RIO1-AID cells treated with 100 µM auxin for 6 h exhibited an 8-fold increase in chromosome loss, compared to wild-type yeast (RIO1). Colonies with red-colored sectors (representative images are shown), indicative of chromosome reporter fragment loss, were counted, and normalised to those measured in the RIO1 strain (value = 1). The data derived from five biological experiments (n = 5). The singular data (white circles) are combined as mean ± SEM. P-values were calculated with the unpaired, two-tailed Student’s t test. The distributions of generational chromosome loss frequencies are plotted in pie format.
Fig. 8
Fig. 8. RioK1 ensures correct cenRNA levels, faithful kinetochore assembly, and chromosome stability in human cells.
a Left: representative immunofluorescence (IF) images of RioK1 at kinetochores (CREST) in prometaphase and metaphase cells. Right: RioK1 levels at kinetochores (versus CREST) through the cell cycle. The numbers of cells analysed (n) derived from three replicate experiments. The data are shown as mean ± SD. P-values were calculated with the unpaired, two-tailed Student’s t test. Supplementary Fig. 8a shows IF images of RioK1 through the cell cycle. b Over-time levels of mAID-RioK1 and GAPDH (loading control) in mAID-RIOK1 cells treated with 500 µM auxin. c Cell cycle analysis (FACS) of mAID-RIOK1 cells treated with 500 µM auxin or a mock at mitotic entry. Cells were probed after 3 h or 24 h of treatment (four (n = 4) and five (n = 5) replicates per condition, respectively, Supplementary Fig. 8c). The data are shown as mean ± SD, P-values were calculated with the unpaired, two-tailed Student’s t test. d, Cen11 RNA levels (RT-qPCR) in mAID-RIOK1 cells treated for 3 h with auxin or a mock (five replicative experiments, n = 5) were normalised to GAPDH mRNA levels, and then referenced to the cen11 RNA levels in the mock-treated cells. The data are shown as mean ± SEM. P-values were calculated with the unpaired, two-tailed Student’s t test. mAID-RioK1 and GAPDH levels before and after auxin treatment are shown. e CENP-A, Ndc80, and Aurora B levels at kinetochores formed de novo without RioK1 (Supplementary Fig. 8b). Protein levels were quantified by IF analysis and normalised to DNA (DAPI) levels. Protein:DAPI ratios are shown as SuperPlots. The number of cells analysed (n) derived from six (CENP-A), seven (Ndc80), or three (Aurora B) replicate experiments. P-values were calculated with the paired, two-tailed Student’s t test. f Cells (%) containing micronuclei formed during mitosis in RIOK1 and mAID-RIOK1 cells treated at mitotic entry with a mock or 500 µM auxin (3 h). The number of cells analysed (3387 and 3461; respectively) derived from six experiments (n = 6). The data are shown as mean ± SD. P-values were calculated with the unpaired, two-tailed Student’s t test. Right: representative images of DAPI-stained cells containing (orange) or lacking (blue) mAID-RioK1 activity. The white arrowheads indicate micronuclei.

References

    1. Barra V, Fachinetti D. The dark side of centromeres: types, causes and consequences of structural abnormalities implicating centromeric DNA. Nat. Commun. 2018;9:4340. doi: 10.1038/s41467-018-06545-y. - DOI - PMC - PubMed
    1. Smurova K, De Wulf P. Centromere and pericentromere transcription: roles and regulation… in sickness and in health. Front. Genet. 2018;9:674. doi: 10.3389/fgene.2018.00674. - DOI - PMC - PubMed
    1. Corless S, Höcker S, Erhardt S. Centromeric RNA and its function at and beyond centromeric chromatin. J. Mol. Biol. 2020;432:4257–4269. doi: 10.1016/j.jmb.2020.03.027. - DOI - PubMed
    1. Leclerc S, Kitagawa K. The role of human centromeric RNA in chromosome stability. Front. Mol. Biosci. 2021;8:642732. doi: 10.3389/fmolb.2021.642732. - DOI - PMC - PubMed
    1. Mellone BG, Fachinetti D. Diverse mechanisms of centromere specification. Curr. Biol. 2021;31:R1491–R1504. doi: 10.1016/j.cub.2021.09.083. - DOI - PMC - PubMed

Publication types

MeSH terms