. 2023 Jun 1;14(1):3039.
doi: 10.1038/s41467-023-38500-x.

Diversity of the Pacific Ocean coral reef microbiome

Affiliations

Diversity of the Pacific Ocean coral reef microbiome

Pierre E Galand et al. Nat Commun. .

Abstract

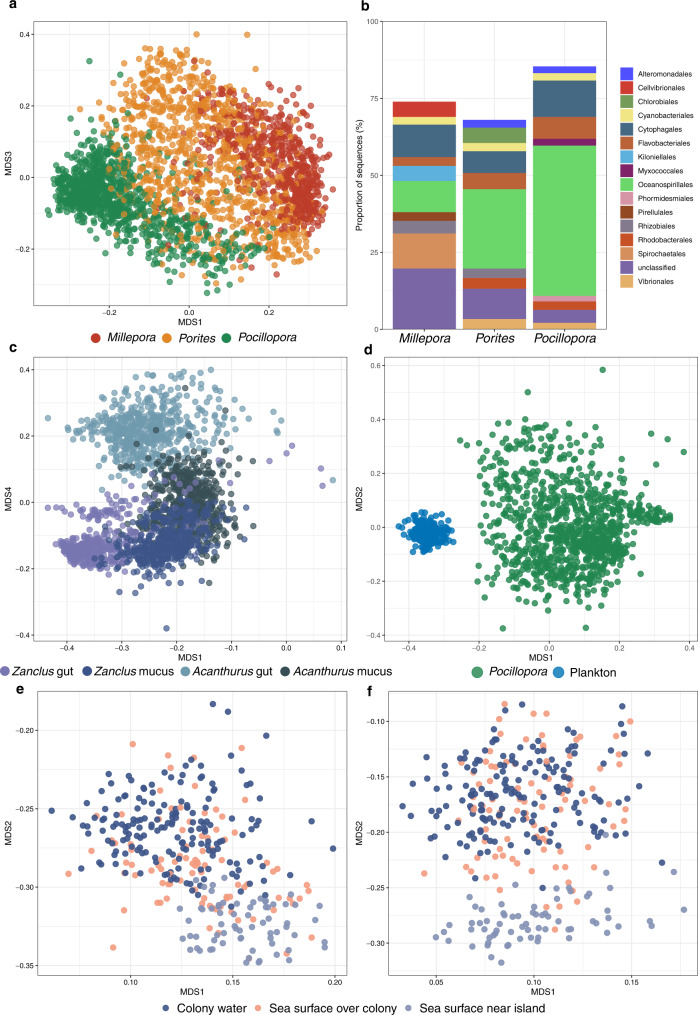
Coral reefs are among the most diverse ecosystems on Earth. They support high biodiversity of multicellular organisms that strongly rely on associated microorganisms for health and nutrition. However, the extent of the coral reef microbiome diversity and its distribution at the oceanic basin-scale remains to be explored. Here, we systematically sampled 3 coral morphotypes, 2 fish species, and planktonic communities in 99 reefs from 32 islands across the Pacific Ocean, to assess reef microbiome composition and biogeography. We show a very large richness of reef microorganisms compared to other environments, which extrapolated to all fishes and corals of the Pacific, approximates the current estimated total prokaryotic diversity for the entire Earth. Microbial communities vary among and within the 3 animal biomes (coral, fish, plankton), and geographically. For corals, the cross-ocean patterns of diversity are different from those known for other multicellular organisms. Within each coral morphotype, community composition is always determined by geographic distance first, both at the island and across ocean scale, and then by environment. Our unprecedented sampling effort of coral reef microbiomes, as part of the Tara Pacific expedition, provides new insight into the global microbial diversity, the factors driving their distribution, and the biocomplexity of reef ecosystems.


Conflict of interest statement

The authors declare no competing interests.

Figures

Fig. 1
Fig. 1. Diversity and community composition of the plankton, coral, and fish microbiomes across 32 islands of the Pacific Ocean.
a Map of the islands sampled. b Accumulation curves of microbial community richness. The dashed line represents the shift between the small planktonic size fraction ( < 3 µm) and the larger size fractions ( > 3 µm). c Shannon diversity index across all samples (n = 3,298). The box plot horizontal bars show the median value, the box indicates the first and third QRs, and the whiskers indicate 1.5*IQR. Source data are provided as a Source Data file. d Bray-Curtis based nMDS ordination (stress = 0.11) showing differences in microbial community composition between biomes with density plot on the right showing the distribution of MDS2 values in coral, small (0.2–3 µm) and large (3–20 µm) plankton size fractions, and fish gut and mucus. e Prevalence and relative abundance of ASVs in plankton, coral, and fish samples. Endozoicomonadaceae ASVs (putative symbionts) are coloured in black, Vibrionaceae (putative pathogens) in grey and all other annotations in white. I01: Islas de las Perlas, I02: Coiba, I03: Malpelo, I04: Rapa Nui, I05: Ducie Island, I06: Gambier, I07: Moorea, I08: Cook Islands, I09: Niue, I10: Upolu, I11: Wallis and Futuna, I12: Tuvalu, I13: Kiribati, I14: Chuuk Island, I15: Guam, I16: Ogasawara Islands, I17: Sesoko Island, I18: Fiji Islands, I19: Great Barrier Reef, I20: Chesterfield, I21: New Caledonia, I22: Solomon Islands, I23: Normanby Island, I24: New Britain Island, I25: Southwest Palau Islands, I26: Babeldaob, I27: Crescent Island, I28: Taiwan, I29: Oahu Island, I30: Gulf of California, I31: Clipperton Island, I32: Islas Secas.
Fig. 2
Fig. 2. Bray-Curtis based MDS ordinations showing differences in microbial community composition within each biomes.
a Between Millepora, Porites and Pocillopora and b their overall community composition for the 10 most abundant bacterial orders. c Between Zanclus cornutus and Acanthurus triostegus gut and mucus. d Between Pocillopora microbial communities and free-living planktonic communities (size 0.2–3 µm) sampled close to the Pocillopora colonies (colony water). e Between planktonic communities sampled from sea surface water near the islands, surface water over the colonies, and close to the colonies (colony water) for the 0.2–3 µm size fraction and f for the 3–20 µm size fraction.
Fig. 3
Fig. 3. Diversity of coral microbiomes across the Pacific Ocean.
Shannon diversity index for microbial communities of the corals a Millepora, b Porites and c Pocillopora averaged per island. Square colours represent the Shannon index strength; size indicates the standard deviation from the mean. Map colour overlay shows the diversity of the coral communities.
Fig. 4
Fig. 4. Factors explaining the composition of coral microbiomes across the Pacific Ocean.
Pairwise dissimilarity of microbial communities compared between islands, within islands and within sites at each island for the corals a Millepora, n = 382,542 comparisons, b Porites, n = 892,080 comparisons and c Pocillopora, n = 951,600 comparisons. The dissimilarity is based on Euclidean distance computed from centred log ratio (clr) transformed ASV data. The box plot horizontal bars show the median value, the box indicates the first and third QRs, and the whiskers indicate 1.5*IQR. d Mantel correlation between microbial community composition and geographic distances and environmental factors for the three coral morphotypes. Source data are provided as a Source Data file.
Fig. 5
Fig. 5. Composition of coral microbiomes across the Pacific Ocean.
Microbial community composition for the corals a Millepora, b Porites and c Pocillopora. The pie charts represent the proportion of the different community clusters identified by hierarchical clustering. Similar colours within a figure panel represent similar microbial communities. The upper panel (map) shows summary data for each island and the lower panel represents the detail for each site at each island. An average of 10 different colonies were sampled at each site for each coral morphotype. d Taxonomic composition at the order level of the community clusters. Cluster name colours correspond to the colours of the community clusters in the pie charts. Source data are provided as a Source Data file.

References

    1. Fisher R, et al. Species richness on coral reefs and the pursuit of convergent global estimates. Curr. Biol. 2015;25:500–505. doi: 10.1016/j.cub.2014.12.022. - DOI - PubMed
    1. Costanza R, et al. Twenty years of ecosystem services: how far have we come and how far do we still need to go? Ecosyst. Serv. 2017;28:1–16. doi: 10.1016/j.ecoser.2017.09.008. - DOI
    1. Hughes TP, et al. Coral reefs in the Anthropocene. Nature. 2017;546:82–90. doi: 10.1038/nature22901. - DOI - PubMed
    1. Eddy TD, et al. Global decline in capacity of coral reefs to provide ecosystem services. One Earth. 2021;4:1278–1285. doi: 10.1016/j.oneear.2021.08.016. - DOI
    1. Kleypas J, et al. Designing a blueprint for coral reef survival. Biol. Conserv. 2021;257:109107. doi: 10.1016/j.biocon.2021.109107. - DOI

Publication types