. 2023 Jun 1;13(1):8929.
doi: 10.1038/s41598-023-35025-7.

3D modelling and simulation of the impact of wearing a mask on the dispersion of particles carrying the SARS-CoV-2 virus in a railway transport coach

Affiliations

3D modelling and simulation of the impact of wearing a mask on the dispersion of particles carrying the SARS-CoV-2 virus in a railway transport coach

Patrick Armand et al. Sci Rep. .

Abstract

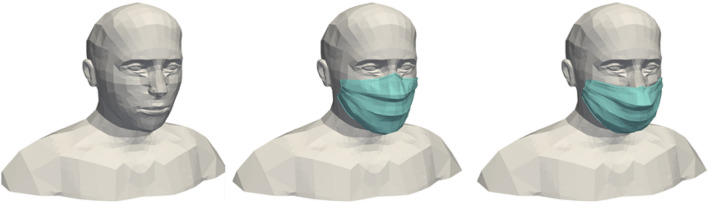
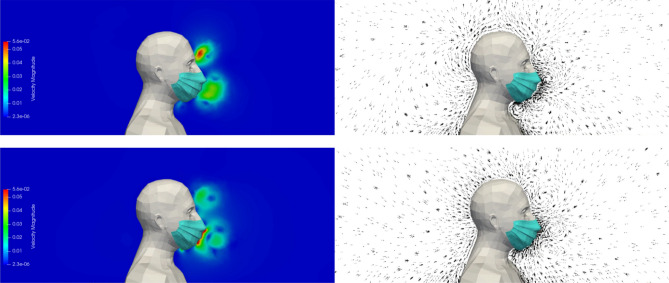
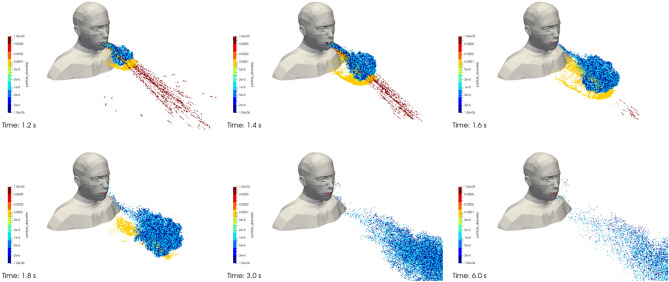
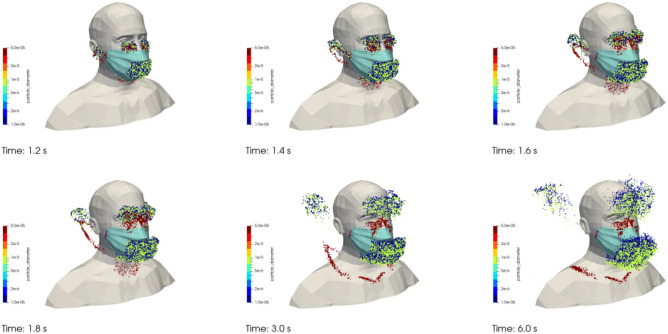
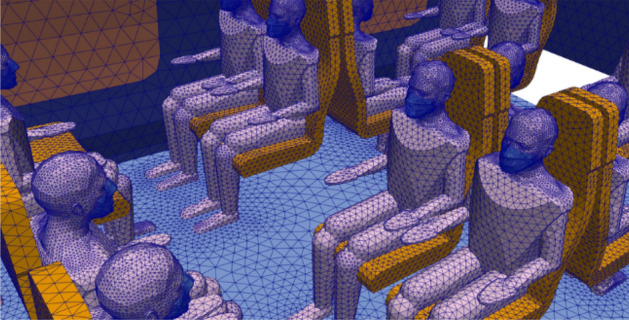
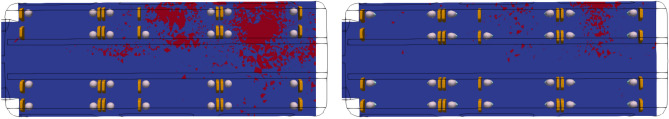
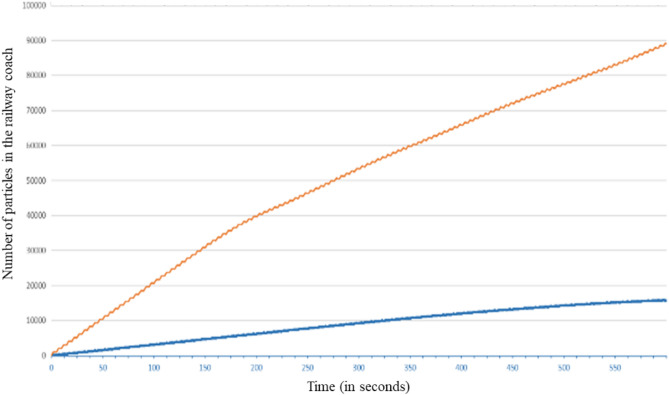
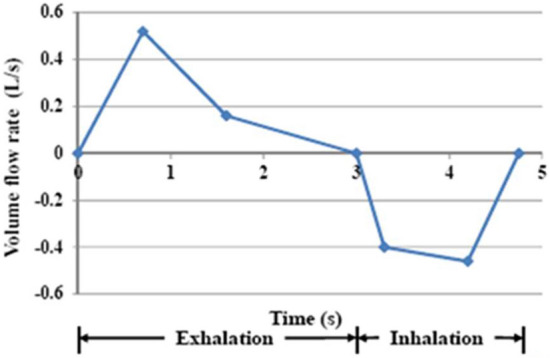
Even though the Covid-19 pandemic seems to be stagnating or decreasing across the world, a resurgence of the disease or the occurrence of other epidemics caused by the aerial dissemination of pathogenic biological agents cannot be ruled out. These agents, in particular the virions of the Covid-19 disease, are found in the particles originating from the sputum of infected symptomatic or asymptomatic people. In previous research, we made use of a three-dimensional Computational Fluid Dynamics (CFD) model to simulate particle transport and dispersion in ventilated semi-confined spaces. By way of illustration, we considered a commuter train coach in which an infected passenger emitted droplets (1 and 10 µm) and drops (100 and 1000 µm) while breathing and coughing. Using an Eulerian approach and a Lagrangian approach, we modelled the dispersion of the particles in the turbulent flow generated by the ventilation of the coach. The simulations returned similar results from both approaches and clearly demonstrated the very distinct aerodynamics of the aerosol of airborne droplets and, at the other end of the spectrum, of drops falling or behaving like projectiles depending on their initial velocity. That numerical study considered passengers without protective masks. In this new phase of research, we first used literature data to develop a model of a typical surgical mask for use on a digital manikin representing a human. Next, we resumed the twin experiment of the railway coach, but this time, the passengers (including the infected one) were provided with surgical masks. We compared the spatial and temporal distributions of the particles depending on whether the spreader passenger wore a mask at all, and whether the mask was perfectly fitted (without leaks) or worn loosely (with leaks). Beyond demonstrating the obvious value of wearing a mask in limiting the dissemination of particles, our model and our simulations allow a quantification of the ratio of particles suspended in the coach depending on whether the infected passenger wears a mask or not. Moreover, the calculations carried out constitute only one illustrative application among many others, not only in public transport, but in any other public or private ventilated space on the basis of the same physical models and digital twins of the places considered. CFD therefore makes it possible to estimate the criticality of the occupation of places by people with or without a mask and to recommend measures in order to limit aerial contamination by any kind of airborne pathogen, such as the virions of Covid-19.


Conflict of interest statement

The authors declare no competing interests.

Figures

Figure 1
Figure 1
3D geometries of the human manikins in three different configurations: wearing no mask (left), wearing a mask perfectly fitted on the face (centre) and wearing a mask loosely with the presence of leaks (right). Images created by the authors with Paraview 5.8.1 (www.paraview.org).
Figure 2
Figure 2
Location of the leak zones (in yellow) for the configuration with the mask incorrectly worn with leaks at the nose (left), cheeks (centre) and chin (right). Images created by the authors with Paraview 5.8.1 (www.paraview.org).
Figure 3
Figure 3
Surface meshes of the human manikins for the three different configurations: with no mask (left), with a perfectly worn mask (centre) and with an incorrectly worn, leaky mask (right). Images created by the authors with Paraview 5.8.1 (www.paraview.org).
Figure 4
Figure 4
Case #1—No mask—Velocity modulus (left column) and velocity vectors (right column) during the exhalation phase (top row) and the inhalation phase (bottom row). Images created by the authors with Paraview 5.8.1 (www.paraview.org).
Figure 5
Figure 5
Case #1—No mask—Velocity field and distribution of the droplets in the plane of symmetry of the manikin at different times (left to right, and top to bottom): t = 0.4 s; 1 s; 3 s; 6 s; 8 s; and 10.5 s. Images created by the authors with Paraview 5.8.1 (www.paraview.org).
Figure 6
Figure 6
Case #2—Perfectly fitting mask—Velocity modulus (left column) and velocity vectors (right column) during the exhalation phase (top row) and the inhalation phase (bottom row). Images created by the authors with Paraview 5.8.1 (www.paraview.org).
Figure 7
Figure 7
Case #2—Perfectly fitting mask—Velocity field and distribution of the droplets in the plane of symmetry of the manikin at different times (left to right, and top to bottom): t = 0.4 s; 1 s; 3 s; and 6 s. Images created by the authors with Paraview 5.8.1 (www.paraview.org).
Figure 8
Figure 8
Case #3—Poorly fitting mask—Velocity modulus (left column) and velocity vectors (right column) during the exhalation phase (top row) and the inhalation phase (bottom row). Images created by the authors with Paraview 5.8.1 (www.paraview.org).
Figure 9
Figure 9
Case #3—Poorly fitting mask—Velocity field and distribution of the droplets in the plane of symmetry of the manikin at different times (left to right, and top to bottom): t = 0.4 s; 1 s; 3 s; and 6 s. Images created by the authors with Paraview 5.8.1 (www.paraview.org).
Figure 10
Figure 10
Case #1—No mask—Drops and droplets projected during coughing at different times (left to right, and bottom to top): (t = t0 + 0.2 s; t0 + 0.4 s; t0 + 0.6 s; t0 + 0.8 s; t0 + 2 s; and t0 + 5 s). Dark blue, light blue, yellow and red dots respectively represent particles of 1 µm, 10 µm, 100 µm and 1,000 µm in diameter. Images created by the authors with Paraview 5.8.1 (www.paraview.org).
Figure 11
Figure 11
Case #3—Poorly fitting mask—Drops and droplets projected during coughing at different times (left to right, and bottom to top): (t = t0 + 0.2 s; t0 + 0.4 s; t0 + 0.6 s; t0 + 0.8 s; t0 + 2 s; and t0 + 5 s). Dark blue, green and red dots respectively represent particles of 1 µm, 10 µm and 50 µm in diameter. Images created by the authors with Paraview 5.8.1 (www.paraview.org).
Figure 12
Figure 12
Model of the train chosen in the CFD study (left) and its triangulated surface (right).
Figure 13
Figure 13
Geometry of the coach occupied by manikins and identification of the compartments.
Figure 14
Figure 14
Representation of the surface mesh of the coach walls and of some masked manikins.
Figure 15
Figure 15
Distribution of droplets with a diameter of 1 µm, emitted by the infected manikin during its breathing at different times (t = 17.4 s; 45.3 s; 90.5 s; 131.6 s; 221.6 s; 305.6 s; 405.5 s; and 600 s) (left to right, and bottom to top).
Figure 16
Figure 16
Evolution over time of the number of droplets remaining in the railway coach when the disseminator wears a mask.
Figure 17
Figure 17
Distribution of 1-µm droplets emitted by the infected manikin during its breathing without mask use (left column) and with mask use (right column) at different times (t = 12.2 s; 50.3 s; 93.9 s; 129.0 s; and 179.4 s) (left to right, and bottom to top).
Figure 18
Figure 18
Distribution of 1-µm droplets emitted by the infected manikin without mask use (left) and with mask use (right) at the end of the simulated breathing sequence (t = 594 s).
Figure 19
Figure 19
Cells (in red) containing at least one droplet, in a sectional plane at manikin face height, at the end of the simulated sequence with a disseminator wearing no mask (left) and wearing a mask (right).
Figure 20
Figure 20
Evolution over time of the number of particles in the railway coach when the disseminator wears a mask (in blue) or does not wear one (in orange).
Figure 21
Figure 21
Layout of the ventilation in the digital twin of the rail coach with incoming and outgoing airflows.
Figure 22
Figure 22
Location of the manikin wearing a mask (or not) and disseminating the infectious agent by breathing.
Figure 23
Figure 23
Representation of the air inlet through the mouth (without mask, left), and also through the mask (in purple) with a mask perfectly fitted on the face (centre) or with a leaky mask (right). Images created by the authors with Paraview 5.8.1 (www.paraview.org).
Figure 24
Figure 24
Evolution of the basic air flow rate (in L.s−1) during the human respiratory cycle.
Figure 25
Figure 25
Evolution of the air velocity (in m.s−1) through the mouth of the manikin in case #1.
Figure 26
Figure 26
Evolution of the air velocity (in m.s−1) through the mask worn by the manikin in case #2.
Figure 27
Figure 27
Evolution of the air velocity (in m.s−1) through the mask and leaks around the face of the manikin in case #3.

References

    1. Armand P, Tâche J. 3D modelling and simulation of the dispersion of droplets and drops carrying the SARS-CoV-2 virus in a railway transport coach. Nat. Sci. Rep. 2022;12:4025. - PMC - PubMed
    1. World Health Organization internet. https://www.who.int/fr/emergencies/diseases/novel-coronavirus-2019/quest... (2020).
    1. Bourouiba L. Turbulent gas clouds and respiratory pathogen emissions: Potential implications for reducing transmission of COVID-19. J. Am. Med. Assoc. 2020;323(18):1837–2183. - PubMed
    1. Masters PS. The molecular biology of coronaviruses. Adv. Virus Res. 2006;66:193–292. doi: 10.1016/S0065-3527(06)66005-3. - DOI - PMC - PubMed
    1. Wells WF. On airborne infection study II: Droplets and droplet nuclei. Am. J. Epidemiol. 1934;20(3):611–618. doi: 10.1093/oxfordjournals.aje.a118097. - DOI