. 2023 Jun 1;14(1):3175.
doi: 10.1038/s41467-023-38789-8.

Increased renal elimination of endogenous and synthetic pyrimidine nucleosides in concentrative nucleoside transporter 1 deficient mice

Affiliations

Increased renal elimination of endogenous and synthetic pyrimidine nucleosides in concentrative nucleoside transporter 1 deficient mice

Avinash K Persaud et al. Nat Commun. .

Erratum in

Abstract

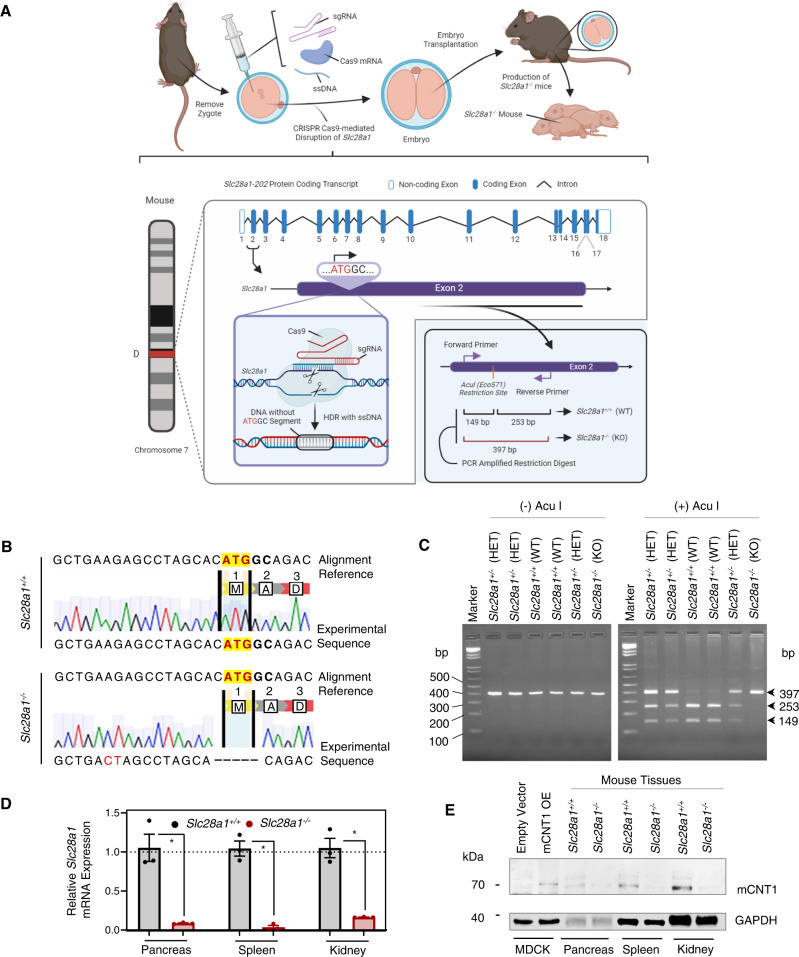
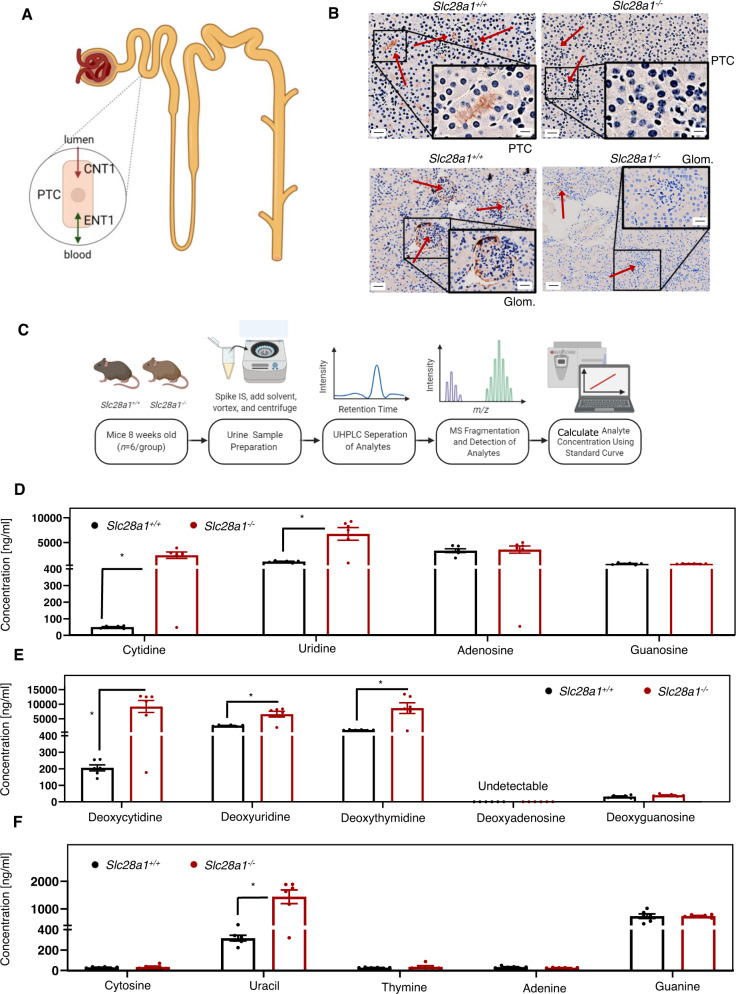
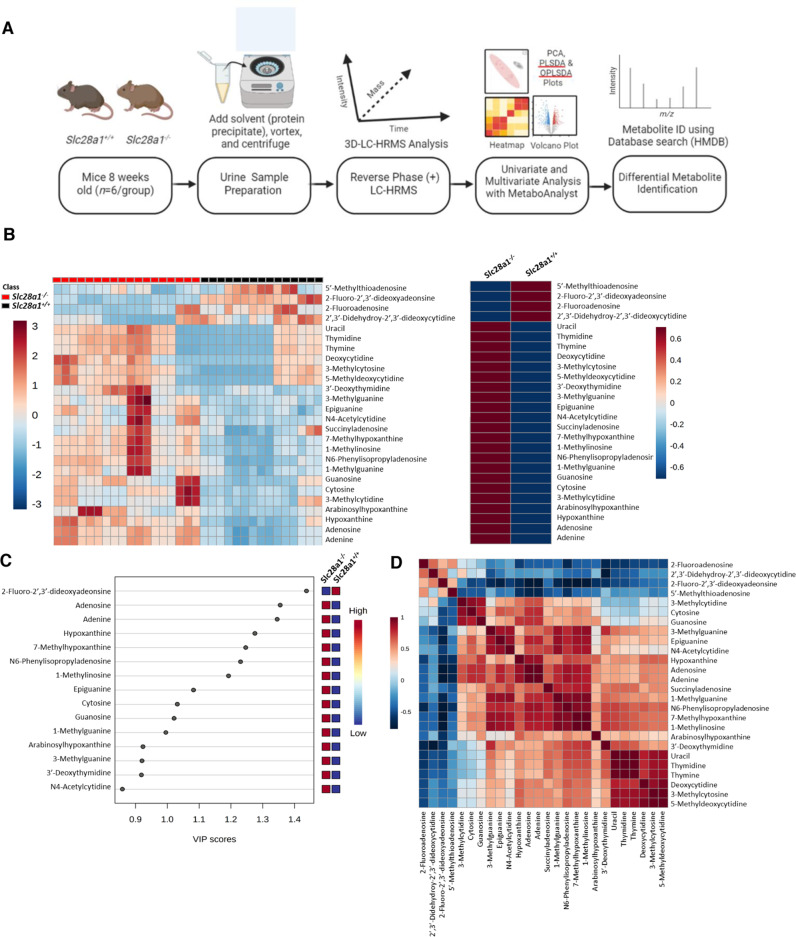
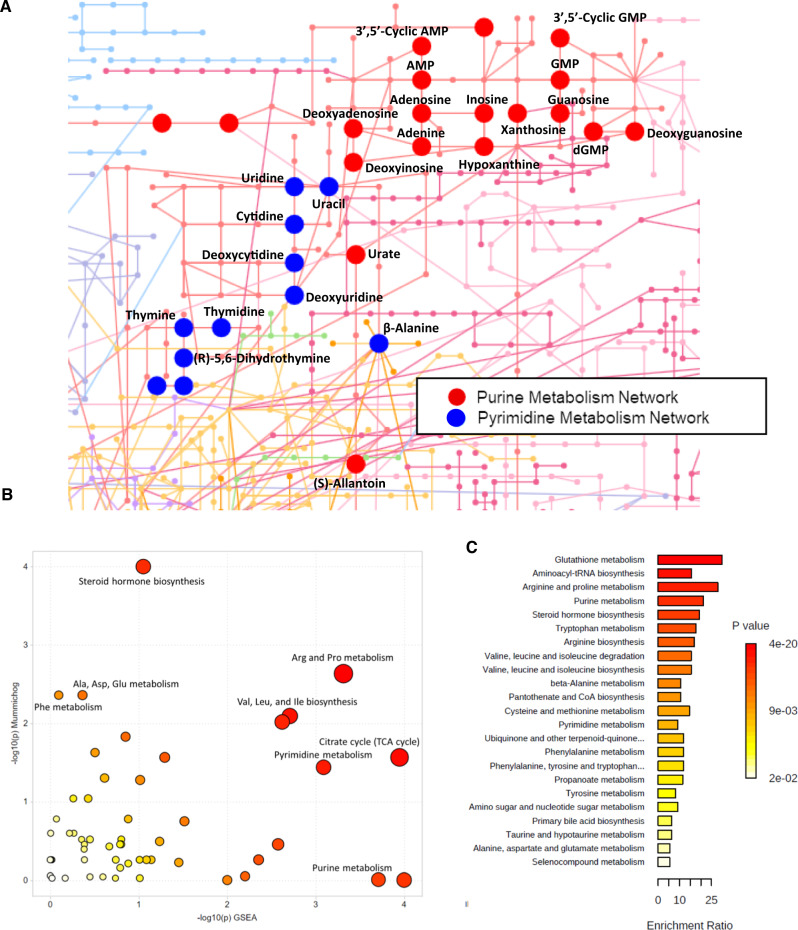
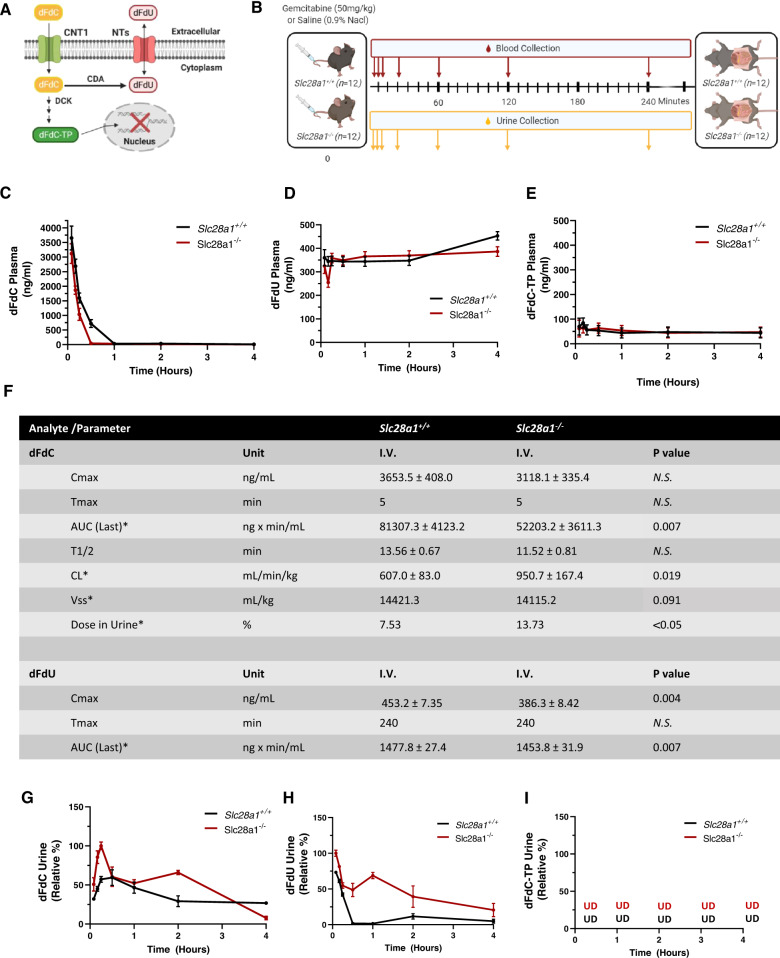
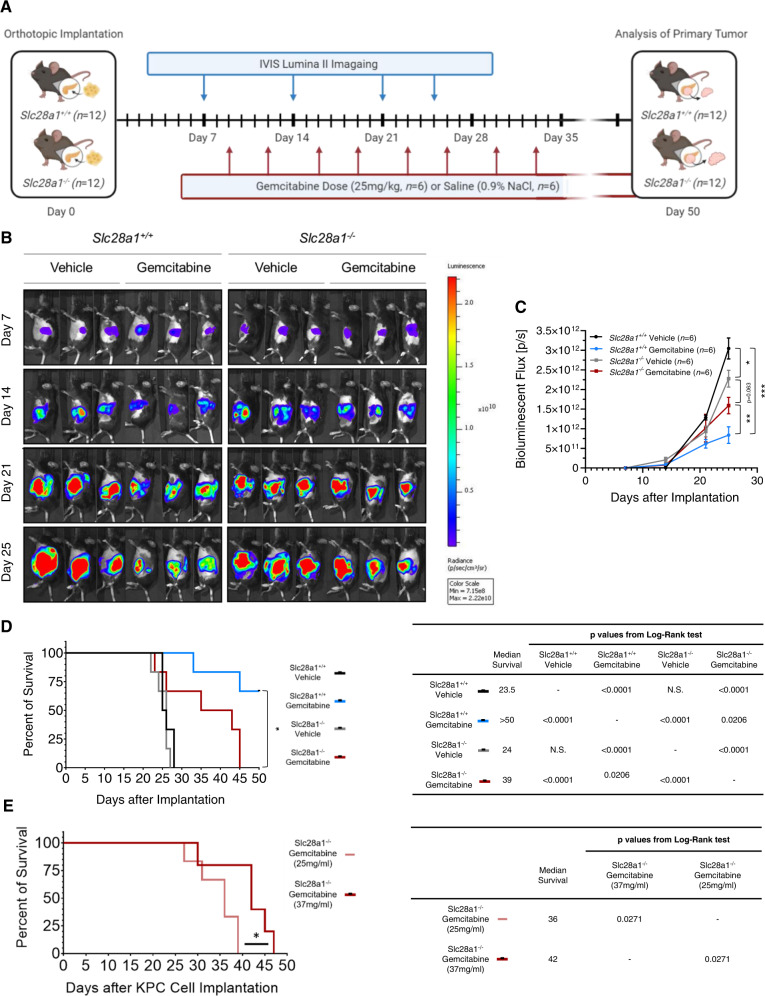
Concentrative nucleoside transporters (CNTs) are active nucleoside influx systems, but their in vivo roles are poorly defined. By generating CNT1 knockout (KO) mice, here we identify a role of CNT1 in the renal reabsorption of nucleosides. Deletion of CNT1 in mice increases the urinary excretion of endogenous pyrimidine nucleosides with compensatory alterations in purine nucleoside metabolism. In addition, CNT1 KO mice exhibits high urinary excretion of the nucleoside analog gemcitabine (dFdC), which results in poor tumor growth control in CNT1 KO mice harboring syngeneic pancreatic tumors. Interestingly, increasing the dFdC dose to attain an area under the concentration-time curve level equivalent to that achieved by wild-type (WT) mice rescues antitumor efficacy. The findings provide new insights into how CNT1 regulates reabsorption of endogenous and synthetic nucleosides in murine kidneys and suggest that the functional status of CNTs may account for the optimal action of pyrimidine nucleoside analog therapeutics in humans.


Conflict of interest statement

The authors declare no competing interests.

Figures

Fig. 1
Fig. 1. Generation and characterization of CNT1-deficient mice.
A Schematic workflow illustrating the Slc28a1 editing and genotyping strategy. B Representative DNA chromatogram illustrating the sequence alignment between the Slc28a1 reference and experimental sequence from Slc28a1+/+ and Slc28a1−/− mice with deleted nucleic acids indicated with a dash (-). Sequencing performed in two independent experiments. C Representative genotyping gel loaded with PCR-amplified Slc28a1 from Slc28a1+/+ and Slc28a1−/− with and without the Acul restriction digest. Genotyping performed in over ten independent experiments. D Relative Slc28a1 gene expression in Slc28a1−/− mouse organs normalized to GAPDH and Slc28a1+/+ control displayed as a fold change (2−ΔΔCt). Data represent mean ± SEM (n = 3 mice/group mean ± SEM, *p < 0.05 by two-tailed t-test). Gene expression performed in two independent experiments. E Representative immunoblots of mCNT1 in Slc28a1+/+ and Slc28a1−/− mouse organs at 8 weeks of age with GAPDH as a loading control. Empty vector and mCNT1 overexpression (OE) controls were generated in HEK293 cells (#CRL 1573, ATCC). Immunoblotting performed in two independent experiments.
Fig. 2
Fig. 2. CNT1 kidney immunohistochemistry and targeted metabolomics of Slc28a1−/− mice urine.
A Diagram illustrating transporter localization in the kidney. PTC, proximal tubular cell; arrows indicate transport directionality of CNT1 and ENT1. B Representative CNT1 DAB-stained kidney section (×10; Scale bar = 100 μm) comparing Slc28a1+/+ with Slc28a1−/− mice at 8 weeks. Insets shows higher magnification (×40; Scale bar = 20 μm) of boxed regions. CNT1 DAB staining is present at the apical surface of proximal tubule cells and glomerular cells (red arrows) in Slc28a1+/+ mice but not in the Slc28a1−/− mice. Kidney imaging performed three independent experiments. C Schematic workflow used to profile the nucleobases, nucleosides, and (deoxy)nucleosides in Slc28a1+/+ and Slc28a1−/− mice urine. D Concentration of nucleosides in Slc28a1−/− mice urine compared to Slc28a1+/+ littermate control mice. Data represent mean ± SEM (n = 6 mice/group, *p < 0.05 by two-tailed t-test). E Concentration of (deoxy)nucleosides in Slc28a1−/− mice urine compared to Slc28a1+/+ littermate control mice. Data represent mean ± SEM (n = 6 mice/group, *p < 0.05 by two-tailed t-test). F Concentration of nucleobases in Slc28a1−/− mice urine compared to Slc28a1+/+ littermate control mice. Data represent mean ± SEM (n = 6 mice/group, *p < 0.05 by two-tailed t-test). Profiling of nucleobases, nucleosides, and (deoxy)nucleosides was performed in two independent experiments.
Fig. 3
Fig. 3. Untargeted metabolomics analysis of Slc28a1−/− mice urine.
A Schematic workflow used to profile the urine metabolome of Slc28a1+/+ and Slc28a1−/− mice. B Heatmap illustrating hierarchical clustering of differential features (left) and the average abundances (right) for nucleoside derived metabolites detected across 5 Slc28a1+/+ and 6 Slc28a1−/− mice urine samples run in triplicate by mass spectrometry-based metabolomics. Data represent mean ng/ml ± SEM (n = 5–6 mice/group mean ± SEM, *p < 0.05 by two-tailed t-test). MS signal intensities for all heatmaps were clustered in two dimensions based on Euclidean distance (row, metabolites; column, samples). Colors indicate the metabolite abundances (red, high; blue, low). For identified metabolites, increased (red) or decreased (blue) fold change in Slc28a1−/− and corresponding p value (black) indicated. C VIP (Variable Importance in Projection) Scores for annotated nucleoside derived features in partial Least Squares-discriminant Analysis (PLS-DA). D Correlation heatmap illustrating the overall correlation between different features. Untargeted metabolomics was performed in one experiment with 5–6 mice per experimental group.
Fig. 4
Fig. 4. Untargeted metabolite pathway analysis of Slc28a1−/− mice urine.
A Network visualization of the purine and pyrimidine metabolite networks with altered purine metabolites highlighted red and altered pyrimidine metabolites highlighted in blue for urine metabolomics data using Fisher’s method of MS Peaks-to-Paths analysis, B the Mummichog and GSEA pathway Meta-analysis for MS Peaks to Paths combining the separate algorithms’ p values (*p < 0.05 by one-tailed hypergeometric test), and C Quantitative enrichment analysis using the concentration table of the final annotated list of features for the untargeted differential analysis for Slc28a1−/− vs Slc28a1−/− mice urine using the HMDB codes for each feature and the KEGG library (*p < 0.05 by two-tailed Welch’s t-test).
Fig. 5
Fig. 5. Plasma and urine pharmacokinetic profiling of dFdC and its metabolites.
A Schematic diagram illustrating the mechanisms of action and metabolism of dFdC. B Schematic workflow illustrating Slc28a1+/+ and Slc28a1−/− mouse treatment and serial blood and urine collection after dFdC administration. Plasma pharmacokinetic profiling of C dFdC, D dFdU, and E dFdC-TP in Slc28a1+/+ (black) and Slc28a1−/− (red) mice receiving a single intravenous dose of dFdC (50 mg/kg). F Concentration-time data were analyzed by noncompartmental analysis, and pharmacokinetic parameters were calculated with WinNonlin (F, Table). Table shows plasma and urine pharmacokinetic parameters of dFdC and dFdU in Slc28a1+/+ and Slc28a1−/− mouse plasma. Abbreviations: Cmax maximum plasma concentration, Tmax, time at which the maximum plasma concentration is achieved, AUC area under the plasma concentration-time curve, T1/2 the half-life of the terminal phase, CL systemic clearance, Vss volume of distribution at steady state, NS not significant. Urinary pharmacokinetic profiling of G dFdC, H dFdU, and I dFdC-TP in Slc28a1+/+ (black) and Slc28a1−/− (red) mice receiving a single intravenous dose of dFdC (50 mg/kg). Serial blood and urine sampling was performed at 5, 10, 15, 30, 60, 120, and 240 min, and analyte plasma and urine concentrations were determined by LC–MS/MS. Data represent the mean ± SEM (n = 6 mice/group). Plasma and urine pharmacokinetic profiling was performed in two independent experiments. *Footnote: (*p < 0.05 by two-tailed Welch’s t-test).
Fig. 6
Fig. 6. Gemcitabine antitumor efficacy in Slc28a1−/− mice orthotopically implanted with pancreatic ductal adenocarcinoma cells.
A Schematic workflow illustrating the Slc28a1+/+ and Slc28a1−/− mouse treatment and imaging regimens post implantation. B Bioluminescent imaging of the total tumor burden in 12 Slc28a1+/+ and 12 Slc28a1−/− mice 7, 14, 21, and 25 days post implantation with and without dFdC treatment (25 mg/kg, i.v.; 6 mice/group within each genotype; data shown for 3 representative mice/group). C Total bioluminescent flux [p/s] data collected over time from 6 Slc28a1+/+ and 6 Slc28a1−/−mice treated with and without dFdC (25 mg/kg, i.v.). Data represent the mean ± SEM (n = 6 mice/group, *p < 0.05 by two-tailed t-test). D Kaplan–Meier analysis of the 50-day survival after the orthotopic transplantation of pancreatic ductal adenocarcinoma cells into 6 Slc28a1+/+ and 6 Slc28a1−/− mice, which were then treated twice a week with dFdC (25 mg/kg, i.v.). Statistical comparisons were completed using the Mantel-Cox test (n = 6/group, ***p < 0.001, Mantel–Cox test). E Kaplan–Meier analysis of 50-day survival after transplanting orthotopically implanting pancreatic ductal adenocarcinoma cells in 6 Slc28a1−/− mice treated twice a week with 25 mg/kg, IV and 6 Slc28a1−/− mice treated twice a week with 37 mg/kg, IV. Statistical comparisons were calculated using the Mantel–Cox test (n = 6/group; ***p < 0.001; Mantel–Cox test).

References

    1. Lane A, Fan T. Regulation of mammalian nucleotide metabolism and biosynthesis. Nucleic Acids Res. 2015;43:2466–2485. doi: 10.1093/nar/gkv047. - DOI - PMC - PubMed
    1. Berg, J., T–ymoczko, J. & Stryer, L. Biochemistry (Palgrave Macmillan, 2012).
    1. Fasullo M, Endres L. Nucleotide salvage deficiencies, DNA damage and neurodegeneration. Int. J. Mol. Sci. 2015;16:9431–9449. doi: 10.3390/ijms16059431. - DOI - PMC - PubMed
    1. Ahmed N, Haggitt R, Welch A. Enzymes of salvage and de novo pathways of synthesis of pyrimidine nucleotides in human colorectal adenocarcinomas. Biochem. Pharmacol. 1982;31:2485–2488. doi: 10.1016/0006-2952(82)90058-2. - DOI - PubMed
    1. Moffatt B, Ashihara H. Purine and pyrimidine nucleotide synthesis and metabolism. Arabidopsis Book. 2002;1:e0018. doi: 10.1199/tab.0018. - DOI - PMC - PubMed

Publication types