. 2023 Jun 1;7(1):52.
doi: 10.1038/s41698-023-00403-x.

Deep computational image analysis of immune cell niches reveals treatment-specific outcome associations in lung cancer

Affiliations

Deep computational image analysis of immune cell niches reveals treatment-specific outcome associations in lung cancer

Cristian Barrera et al. NPJ Precis Oncol. .

Abstract

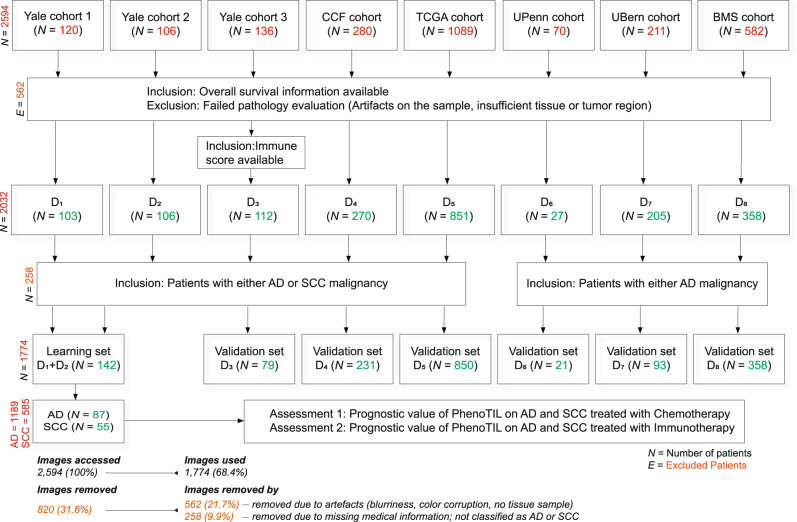
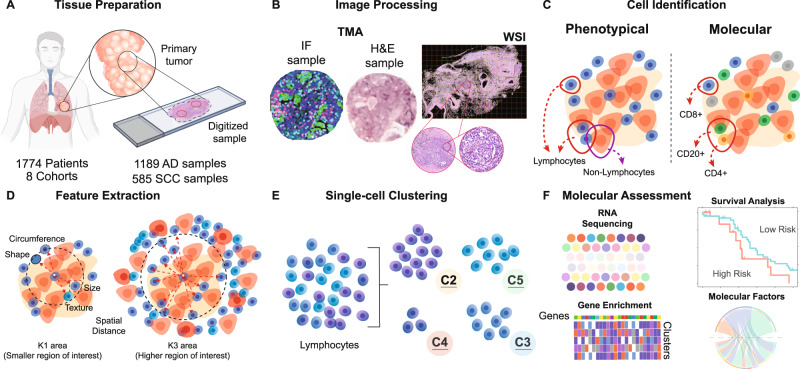
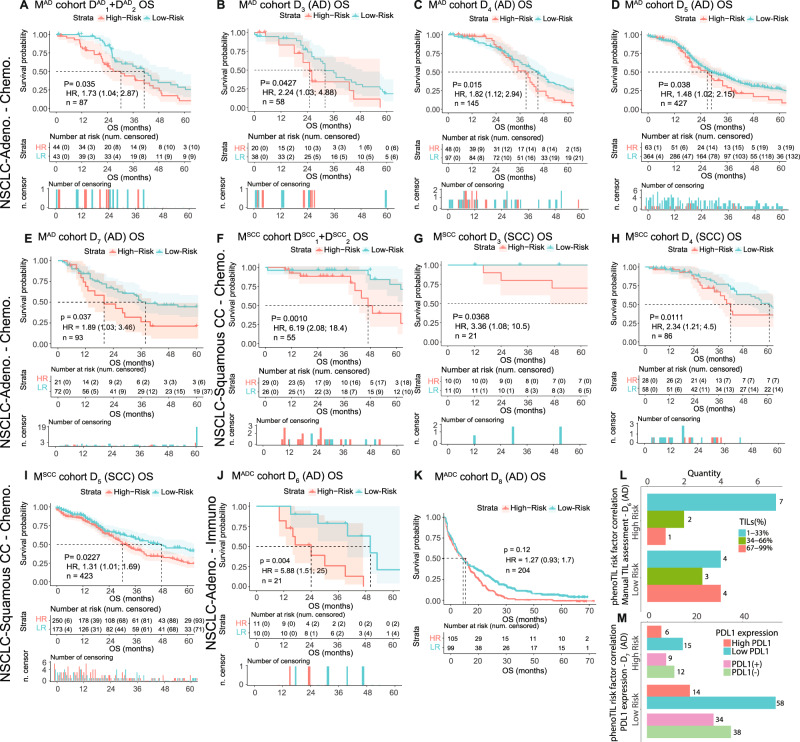
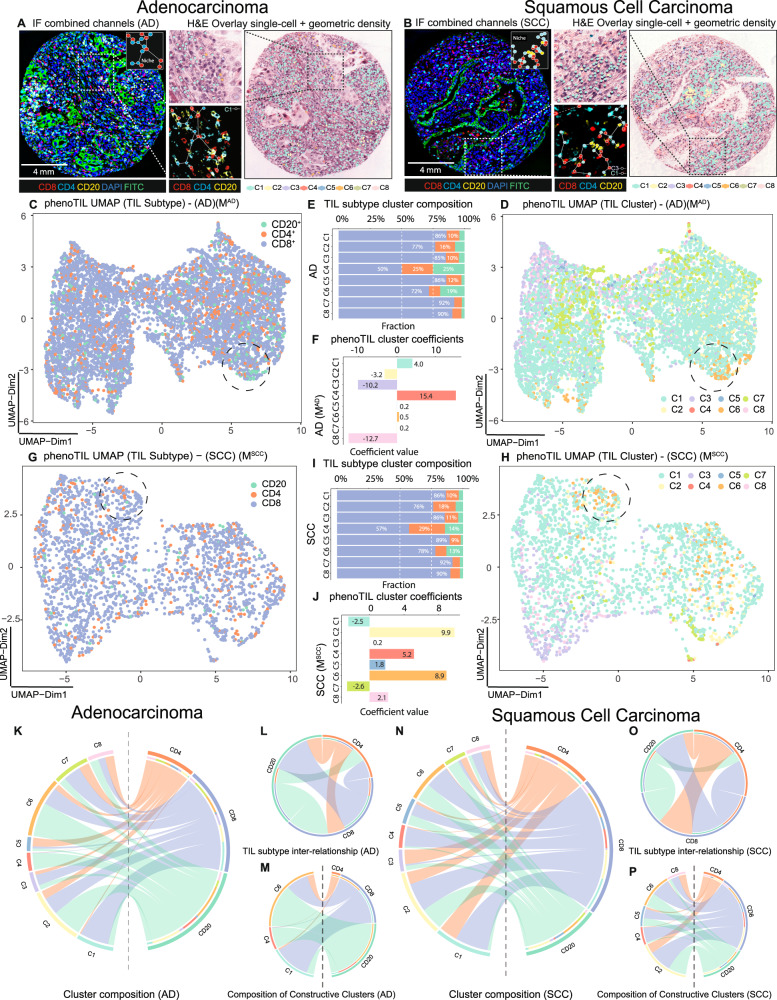
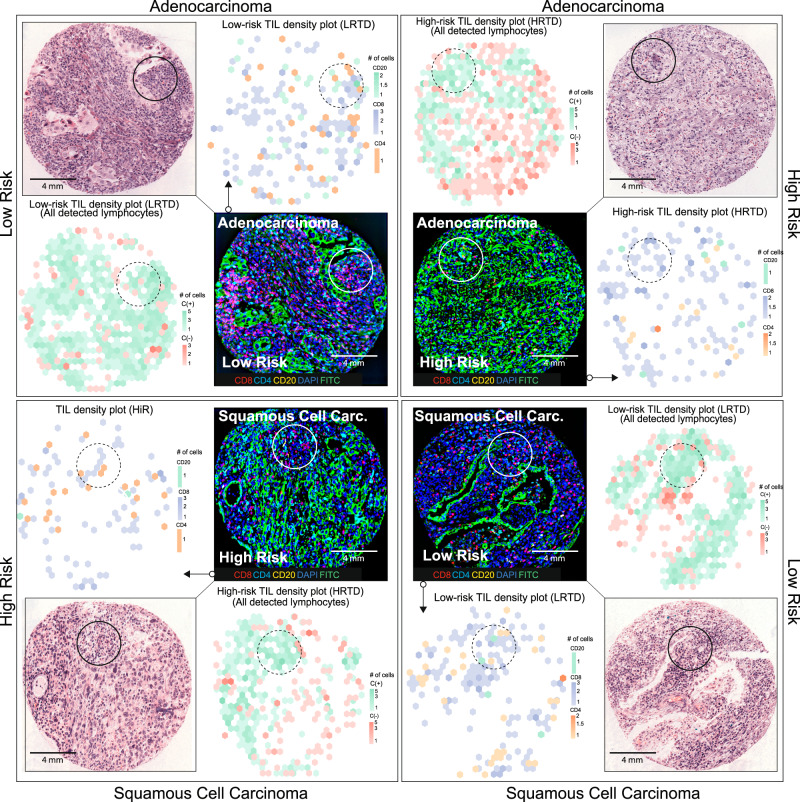
The tumor immune composition influences prognosis and treatment sensitivity in lung cancer. The presence of effective adaptive immune responses is associated with increased clinical benefit after immune checkpoint blockers. Conversely, immunotherapy resistance can occur as a consequence of local T-cell exhaustion/dysfunction and upregulation of immunosuppressive signals and regulatory cells. Consequently, merely measuring the amount of tumor-infiltrating lymphocytes (TILs) may not accurately reflect the complexity of tumor-immune interactions and T-cell functional states and may not be valuable as a treatment-specific biomarker. In this work, we investigate an immune-related biomarker (PhenoTIL) and its value in associating with treatment-specific outcomes in non-small cell lung cancer (NSCLC). PhenoTIL is a novel computational pathology approach that uses machine learning to capture spatial interplay and infer functional features of immune cell niches associated with tumor rejection and patient outcomes. PhenoTIL's advantage is the computational characterization of the tumor immune microenvironment extracted from H&E-stained preparations. Association with clinical outcome and major non-small cell lung cancer (NSCLC) histology variants was studied in baseline tumor specimens from 1,774 lung cancer patients treated with immunotherapy and/or chemotherapy, including the clinical trial Checkmate 057 (NCT01673867).


Conflict of interest statement

A.M. is an equity holder in Elucid Bioimaging, Picture Health and in Inspirata Inc. He is also a scientific advisory consultant for Aiforia Inc, Picture Health and SimbioSys. In addition, he has served as a scientific advisory board member for Inspirata Inc, Astrazeneca, Bristol-Myers-Squibb and Merck. He also has sponsored research agreements with Philips, Astrazeneca, Bristol-Myers Squibb, Boehringer-Ingelheim and Eli-Lilly. His technology has been licensed to Elucid Bioimaging and Picture Health. He also consults for Castle Biosciences, Biohme Inc. and SimbioSys. He is also involved in a NIH (National Institutes of Health) U24 grant with PathCore Inc, and 3 different R01 grants with Inspirata Inc. Kurt Schalper received research funding from Genoptix/Navigate (Novartis), Tesaro, Moderna Therapeutics, Takeda, Surface Oncology, Pierre-Fabre Research Institute, Merck, Bristol-Myers Squibb, AstraZeneca, and Eli Lilly. In addition, he has received honoraria for consultant/advisory roles from Celgene, Moderna Therapeutics, Shattuck Labs, Pierre-Fabre, AstraZeneca, EMD Serono, Ono Pharmaceuticals, Clinica Alemana de Santiago, Dynamo Therapeutics, PeerView, Abbvie, Fluidigm, Takeda/Millenium Pharmaceuticals, Merck, Bristol-Myers Squibb, Agenus, and Torque Therapeutics. D.L.R. has served as an advisor for AstraZeneca, Agendia, Amgen, BMS, Cell Signaling Technology, Cepheid, Danaher, Daiichi Sankyo, Novartis, GSK, Konica Minolta, Merck, NanoString, PAIGE.AI, Perkin Elmer, Regeneron, Roche, Sanofi, Ventana and Ultivue. Amgen, Cepheid, Konica Minolta, NavigateBP, NextCure, and Lilly have funded research in his lab. V.B., D.B., and M.B. are currently employees of Bristol-Myers Squibb. S.B. received research funding from Roche and Basilea (to institution) and has served as a scientific advisory board member for Eli Lilly. The remaining authors declare no competing interests.

Figures

Fig. 1
Fig. 1. Detailed patient selection and exclusion criteria from the different NSCLC cohorts (D1-8).
The inclusion criteria for the study. In total 1774 patients who satisfied all the inclusion criteria and who did not meet any of the exclusion criteria were identified. Images with low quality, blurry effects, and significant artifacts were considered for all the datasets, and images that presented them were excluded from the analysis. For D6, D7, and D8 the additional inclusion criteria invoked included the availability of histologic subtype AD. Inclusion criteria for D7 were as follows: from the initial 211 patients, those patients were considered who either underwent surgical resection after neoadjuvant therapy or had a primary resection at a locally advanced stage, which qualified them for neoadjuvant therapy. Three patients had more than one WSI scanned due to the following reasons: Firstly, the patient had a sample with neoadjuvant lung SCC with small AD as an incidental finding, second was a patient with neoadjuvant adenosquamous carcinoma and the third patient had a primary lung AD with three regions with quite different growth patterns within the primary. After invoking the inclusion and exclusion criteria for this study, 71 cases for D1 (49 excluded), 71 for D2 (35 excluded), 79 for D3 (57 excluded), 231 for D4 (49 excluded), 850 for D5 (239 excluded), 21 for D6 (49 excluded), 93 for D7 (118 excluded) and 358 for D8 (224 excluded) were included.
Fig. 2
Fig. 2. Workflow of the data preparation and experiments.
A Tissue preparation: The cohorts were digitized and represented in the form of patches extracted from whole slide images (WSIs) and tissue microarray (TMA) punches. B Image preprocessing: A subset composed of H&E-stained TMA and corresponding immunofluorescence (IF) images were utilized to analyze tumor-infiltrating lymphocyte (TIL) subtypes. C Cell Identification: Corresponding TILs from the H&E samples were associated with IF molecular labels (CD4+, CD8+, CD20+). D Feature extraction: Phenotyping features were extracted from the TIL cells patches extracted from the WSI and TMAs. E Single-Cell Clustering: An unsupervised clustering approach was applied to the phenotyping features of TILs. F Molecular Assessment: RNA-seq-based transcriptome data is obtained from each WSI-TCGA sample. TIL clusters were used as the input matrix to build a model that associate with the clinical outcome overall survival, using a Cox proportional hazards regression model with elastic net regularization. Associations between cluster conformation, molecular, morphological and genomics composition were studied. Minor components of the figure were obtained from BioRender.
Fig. 3
Fig. 3. KM curves using OS as endpoint for the TIL cluster model (MAD).
A Training set (DAD1 and DAD2) applied to (B) chemotherapy treated cohorts D3, (C) D4, (D) D5 and (E) D7. KM curves for the TIL cluster model (MSCC (F) training (DSCC1 and DSCC2) set applied to (G) D3, (H) D4 and (I) D5. KM of TIL cluster model (MAD) applied to immunotherapy treated cohorts (J) D6 and (K) D8. L Bar plot displaying the correlation between the dichotomous risk groups determined by TIL cluster model (MAD) for cohort D6 on Adenocarcinoma patients and the manual assessment of percentage of TILs. The high-risk group contains 63.6% of Low TIL and the low-risk group contains 80% of High TIL content. M Bar plot displaying the correlation between the risk groups determined by TIL cluster model (MAD) on D7 and the PD-L1 expressions (High expression >50%, low expression ≤50%, Positive >1% and Negative expression ≤1%). The low-risk group contains 79.5% of the low PD-L1. The high-risk group contains 30% of the high PD-L1.
Fig. 4
Fig. 4. The molecular composition of immune subtypes and cluster association for lung AD and SCC sample.
TIL subtype single-cell visual representation on an (A) lung AD and (B) SCC samples from cohort D3. The IF channels are displayed highlighting the spatial distribution of CD4+, CD8+, and CD20+ cells. Cluster labels are overlaid with corresponding H&E images. Smaller patches are shown to visualize the magnitude of complexity of cell detection and identification, depicting niche structures. C UMAP representation of TIL subtype composition for the lung AD. D UMAP of a lung AD sample cluster. E TIL subtype composition of clusters lung AD sample clusters has some concentrations of C1: CD4+ 10%, CD8+ 86%, CD20+ 4%; C4: CD4 + 25%, CD8+ 50%, CD20+ 25%; C6: CD4+ 9%, CD8+ 72%, CD20+ 19%. F The β coefficients (C1: 4.0, C2: −3.2, C3: −10.2, C4: 15.4, C5: 0.2, C6: 0.5, C7: 0.2, C8: −12.7) of the TIL cluster model (MAD). G UMAP representation of TIL subtype composition for the lung SCC. H UMAP of SCC sample clusters. I TIL subtype composition of SCC sample cluster. J The β coefficients (C1: −2.5, C2: 9.9, C3: 0.2, C4: 5.2, C5: 1.8, C6: 8.9, C7: −2.6, C8: 2.1) of the TIL cluster model (MSCC). K Chord diagram representing the cluster composition for lung AD. L Interconnection between the TIL subtypes and (M) between ‘constructive’ clusters. N Chord diagram representing the cluster composition for lung SCC. O Interconnection between the TIL subtypes and (P) ‘constructive’ clusters. CD4+ has a broader influence among clusters for SCC compared to AD. CD20+ plays a bigger role on the AD clusters.
Fig. 5
Fig. 5. The density plots of TIL subtypes and cluster groups for lung AD and SCC are displayed alongside their corresponding H&E-stained and IF TMAs.
The density plots based on the cluster’constructive’ C (+) and’obstructive’ C (−) are shown, depicting the concentration of each cluster group concentration. The TIL density plots also display concentration of TIL cells at the same position for each subtype, CD4+, CD8+ and CD20+. H&E samples are displayed at the outer layer of the figure and IF samples in the inside layer. The plots are shown for low- and high-risk groups assigned by the trained models (MAD and MSCC). For lung AD, CD20+ had a few cells spatially located to CD4+ pockets. high-risk TIL density plot (HRTD) sample displays CD8+ pockets to be sparse. CD20+ was found to be less frequent around CD8+ pockets. The ‘constructive’ clusters are seen to be forming highly concentrated pockets, compared to the ‘obstructive’ clusters, for both AD and SCC low-risk samples. Similarly, on the low-risk TIL density plot (LRTD), CD8+ can be seen forming concentrated pockets for AD. For SCC, the CD8+ pockets are sparser.
Fig. 6
Fig. 6. Representation of the TIL clusters at the Whole-Slide Image (WSI) level.
Two adenocarcinoma samples, labeled as low and high-risk by the trained model (MAD) from cohort D6. A It displays the H&E WSI for a sample labeled as low-risk. The overlaid grid describes patches of 2000 × 2000 pixel size which colors indicates tissue content and usefulness (green = High amount of tissue content, Yellow = Medium amount of tissue, and red = Low to no tissue content). Tiles allocated into the green grid were used for this representation. It depicts a zoomed-in region of interest at (B) 250 µm and (C) 50 µm. For each tile, TIL features and clusters were generated for the (D) for the low-risk sample. The colored-bar size indicates the log10 scale of the quantity of cells for the sample. The quantity of cells for each cluster is shown next to each colored dot and label identifier. A zoom-in patch is displayed alongside, highlighting the conformation of different cluster labels at (E) 250 µm and (F) 50 µm. Density estimation plot is further shown. The density estimation is performed through a probability density function in 2-D by a kernel density estimate, generating a binning grid area. The higher the quantity of data points (cells) that fall within the binning grid area, the higher the color intensity. This is performed for (G) individual clusters, (H) the ‘constructive’ clusters labeled as C (+) and ‘obstructive’ as negative C (−) and (I) density estimation of all the detected lymphocyte cells, highlighting the densest areas in red tonality (‘High’). Similarly, for high-risk samples, the samples were utilized from (J) H&E images, zoomed-in (K, L), (M) TIL clusters at WSI level and (N, O) zoom-in. Density plots for (P) clusters, (Q) ‘constructive’ and ‘obstructive,’ and (R) lymphocyte density plot.
Fig. 7
Fig. 7. Cluster importance comparison among lung AD and SCC.
The first two columns are squamous cell carcinoma cases (First and second columns are low and high-risk respectively). The last two columns are adenocarcinoma cases (Third and fourth columns are low and high-risk respectively). The first row represents the H&E WSI samples for lung AD (A, B) and SCC (C, D). Second row represents the plotting of cluster position that were assigned as ‘obstructive’ by the TIL model (MSCC) for (E, F) lung SCC and TIL model (MAD) for (G, H) lung AD. Third row represents the plotting of cluster position that were assigned as ‘constructive’ by the TIL model (MSCC) for (I, J) lung SCC and TIL model (MAD) for (K, L) lung AD model. For the low-risk samples (I, K), the influence of ‘constructive’ Cluster C4 around other clusters, is highlighted by the dotted-line region.
Fig. 8
Fig. 8. Gene expression and molecular pathways association with the immune clusters for lung AD and SCC.
Heatmap representation of the significant gene expression for (A) lung AD. Each row represents an overly expressed gene. Each column indicates the cluster. The colors of the heatmap represent the Pearson correlation coefficient. The grouped genes are color-coded with a GO term representation. B The biological and molecular pathways are described in box plots. The most significant (FDR adjusted p value) terms are illustrated. The number of total associated gene signatures is shown as number of regulatory genes (nRG). Similarly, for lung SCC is shown (C) the gene expression heatmap and the (D) biological and molecular pathways is also included.

References

    1. Medaglia C, et al. Spatial reconstruction of immune niches by combining photoactivatable reporters and scRNA-seq. Science. Am. Assoc. Adv. Sci. 2017;358:1622–1626. - PMC - PubMed
    1. Qi H, Kastenmüller W, Germain RN. Spatiotemporal basis of innate and adaptive immunity in secondary lymphoid tissue. Annu. Rev. Cell Dev. Biol. 2014;30:141–167. doi: 10.1146/annurev-cellbio-100913-013254. - DOI - PubMed
    1. Matsushita H, et al. Cancer exome analysis reveals a T-cell-dependent mechanism of cancer immunoediting. Nature. 2012;482:400–404. doi: 10.1038/nature10755. - DOI - PMC - PubMed
    1. Rabinovich GA, Gabrilovich D, Sotomayor EM. Immunosuppressive strategies that are mediated by tumor cells. Annu. Rev. Immunol. 2007;25:267–296. doi: 10.1146/annurev.immunol.25.022106.141609. - DOI - PMC - PubMed
    1. Park YH, et al. Chemotherapy induces dynamic immune responses in breast cancers that impact treatment outcome. Nat. Commun. Nat. Publ. Group. 2020;11:6175. doi: 10.1038/s41467-020-19933-0. - DOI - PMC - PubMed

Associated data