. 2023 Jun 1;13(1):8922.
doi: 10.1038/s41598-023-36020-8.

A platform to reproducibly evaluate human colon permeability and damage

Affiliations

A platform to reproducibly evaluate human colon permeability and damage

Elizabeth E Marr et al. Sci Rep. .

Abstract

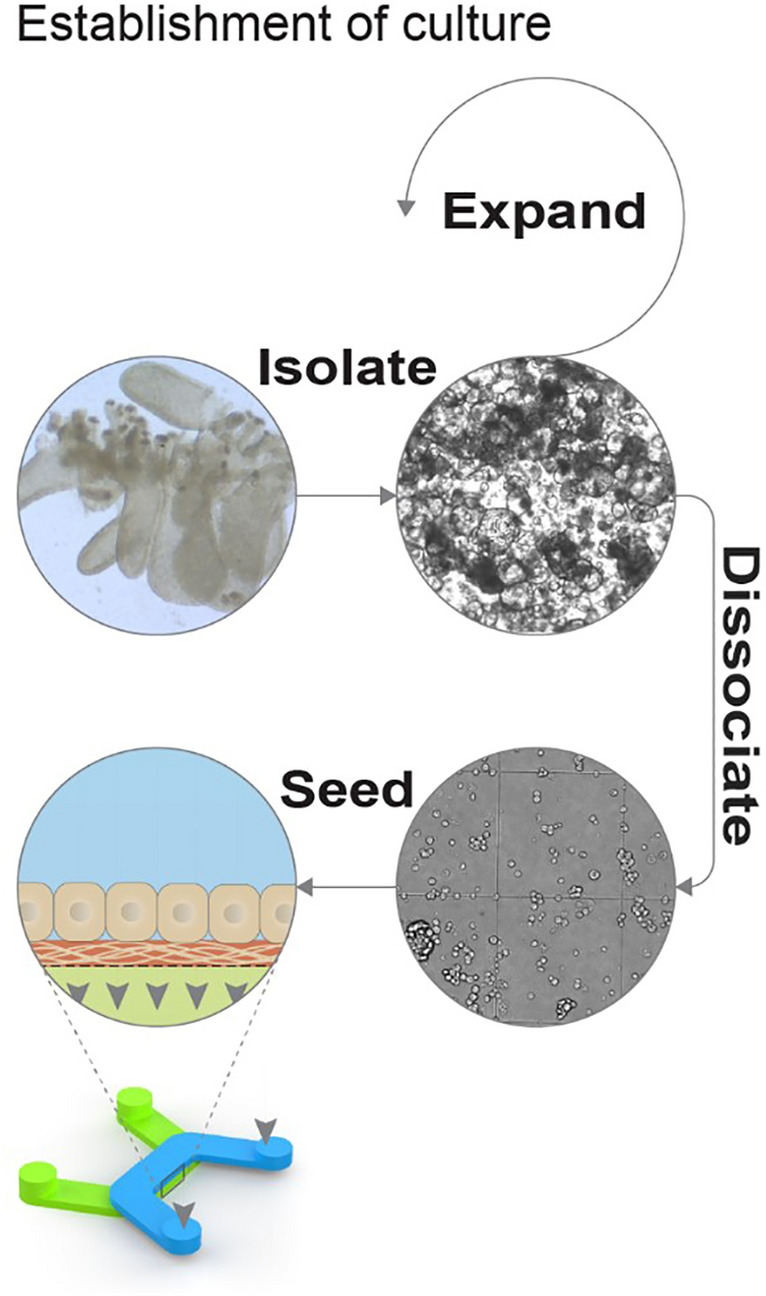
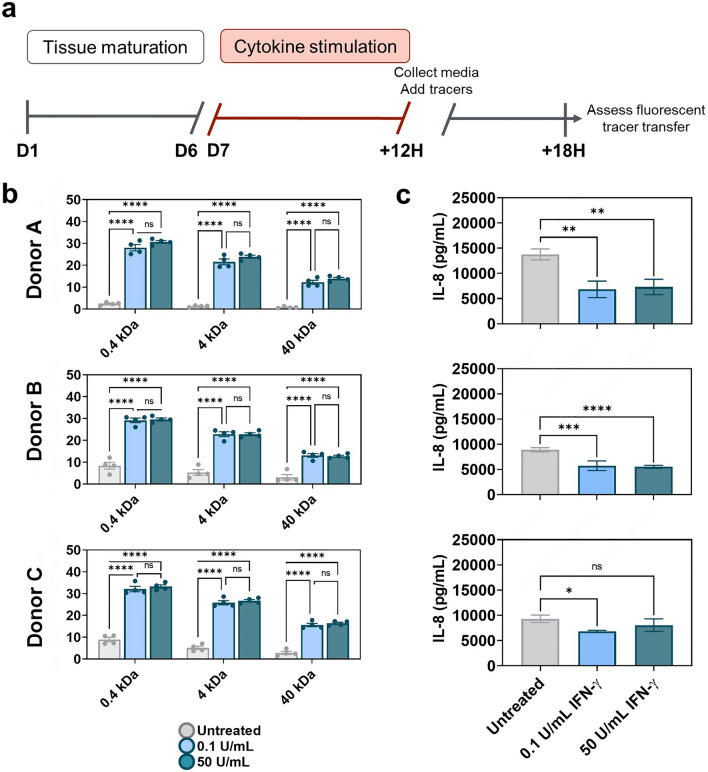
The intestinal epithelium comprises diverse cell types and executes many specialized functions as the primary interface between luminal contents and internal organs. A key function provided by the epithelium is maintenance of a barrier that protects the individual from pathogens, irritating luminal contents, and the microbiota. Disruption of this barrier can lead to inflammatory disease within the intestinal mucosa, and, in more severe cases, to sepsis. Animal models to study intestinal permeability are costly and not entirely predictive of human biology. Here we present a model of human colon barrier function that integrates primary human colon stem cells into Draper's PREDICT96 microfluidic organ-on-chip platform to yield a high-throughput system appropriate to predict damage and healing of the human colon epithelial barrier. We have demonstrated pharmacologically induced barrier damage measured by both a high throughput molecular permeability assay and transepithelial resistance. Using these assays, we developed an Inflammatory Bowel Disease-relevant model through cytokine induced damage that can support studies of disease mechanisms and putative therapeutics.


Conflict of interest statement

The authors declare no competing interests.

Figures

Figure 1
Figure 1
Establishment of human primary colon spheroid cultures and micro-tissues. Colon epithelial stem cells were isolated from the crypts of human intestine tissue using mechanical and enzymatic dissociation techniques and then plated in Matrigel to form primary 3D spheroid cultures. Spheroids were expanded and regularly passaged prior to seeding into devices. For device seeding, colon spheroids were dissociated into multi-cell aggregates, then delivered at high density into the top chamber of PREDICT96 plate bilayer devices utilizing pressure driven flow via a pipette seal press-fit interface.
Figure 2
Figure 2
Mature and differentiated colon micro-tissues were consistently generated in microfluidic devices. (a) Representative images of colon micro-tissues that were fixed, stained and imaged within devices. Anti-MUC2 (mucus proteins), anti-ZO-1 (organized tight junction at cell borders), and anti-Ezrin (brush border at the apical surface of the tissue) were stained in green. All devices were co-stained with fluorescently labeled phalloidin to identify f-actin cytoskeletal protein (pink) and Hoechst 33342 to identify nuclei (blue). White scale bars represent 20 microns. Images are representative of data collected from 3 independent experiments. (b) Micro-tissue barrier function and health was monitored longitudinally by measuring TEER in micro-cultures derived from 3 different colon donors over 14 days. TEER data are representative of data collected from 3 independent experiments. (c) Differentiation was also monitored by changes in gene expression of key stem cell and proliferation markers (ASCL2, LGR5, KI67, OLFM4) cultured in DM compared to micro-tissues cultured in PM. Quantitative RT-PCR measurement of gene expression is reported as relative to expression of the housekeeping gene β-ACTIN for each sample. In all cases, error bars represent standard error of the mean. A two-tailed unpaired t-test was used to analyze tissues grown in PM versus DM with an α = 0.05 (* p < 0.05, ** p < 0.01, *** p < 0.005, **** p < 0.0001). N = 3 (IF imaging), N = 3–8 (PCR), N = 10 (TEER).
Figure 3
Figure 3
Precisely-controlled cytokine-induced colon barrier disruption model generated using high-throughput TEER screening. (a) Colon micro-tissues were grown in devices for 4 days in PM followed by 3 days in DM before being treated with cytokine doses for 24 h. Over the 24 h treatment window, TEER was regularly measured at 2, 4, 6, 8, 12, and 24 h post treatment. After 24 h, cytokine doses were washed out and replaced with cytokine-free differentiation media. Micro-tissue barrier function was tracked for 2 additional days via TEER measurements. (b) TEER values measured during the damage time course at 2 h intervals, and every 24 h during recovery. (c) Barrier disruption in response to combination dose curve of TNF-α (0.14–100 ng/mL) and IFN-γ (1.6–1000 U/mL). Heat map colors indicate relative TEER and white font reports exact TEER for each well. One representative experiment is reported during cytokine treatment (12 h) and after recovery (72 h) for two separate colon donors (Donor A, Donor B). (d) Dose curves were generated for TNF-α (left) and IFN-γ (right) for each of the sensitizing concentrations of IFN-γ and TNF-α. Data are displayed from Donor A after recovery (72 h after cytokine addition; 48 h after cytokine removal), where each data point was normalized to the pre-treatment TEER for comparison across wells.
Figure 4
Figure 4
TNF-α dosing impacts colon micro-tissue permeability and IL-8 secretion (a) Colon tissues were generated in devices through 4 days culture in PM followed by 3 days in DM. Established colon micro-tissues (verified by high TEER) were exposed for 12 h to TNF-α doses and then replaced with the tracer dye molecules under recirculation. (b) Permeability was assayed as fluorescent tracer transfer from top to bottom channel after 6 h. Values are displayed as percent of tracer in bottom channel to quantify probe transfer across the epithelial barrier of micro-tissues derived from 3 colon donors. Results of 0.4 kDa lucifer yellow (LY), 4 kDa FITC-dextran and 40 kDa TRITC-dextran transfer are shown for high and low doses of TNF-α compared to untreated controls. All error bars represent standard error of the mean. A one-way ANOVA with α = 0.05 was utilized to compare dose responses within a group unique to each donor, cytokine dose curve, and tracer. Post hoc analyses were performed with Tukey’s multiple comparisons test after ANOVA. (ns not significant, * p < 0.05, ** p < 0.01, *** p < 0.005, **** p < 0.0001. N = 4). (c) Following damage to colon micro-tissues, media was collected from microfluidic chambers and IL-8 was measured using a commercial ELISA assay kit. All error bars represent standard error of the mean. A one-way ANOVA was performed with an α = 0.05 and Dunnett’s multiple comparisons test was used to compare cytokine stimulation conditions to the untreated control for each donor. (ns not significant, * p < 0.05, ** p < 0.01, *** p < 0.005, **** p < 0.0001. N = 3).
Figure 5
Figure 5
IFN-γ dosing impacts colon micro-tissue permeability and IL-8 secretion (a) Established colon micro-tissues (verified by high TEER) were exposed for 12 h to IFN-γ doses and then replaced with the tracer dye molecules under recirculation. (b) Permeability was assayed as fluorescent tracer transfer from top to bottom channel after 6 h. Values are displayed as percent of tracer in bottom channel to quantify probe transfer across the epithelial barrier of micro-tissues derived from 3 colon donors. Results of 0.4 kDa lucifer yellow (LY), 4 kDa FITC-dextran and 40 kDa TRITC-dextran transfer are shown for high and low doses of IFN-γ compared to untreated controls. All error bars represent standard error of the mean. A one-way ANOVA with α = 0.05 was utilized to compare dose responses within a group unique to each donor, cytokine dose curve, and tracer. Post hoc analyses were performed with Tukey’s multiple comparisons test after ANOVA. (ns not significant, * p < 0.05, ** p < 0.01, *** p < 0.005, **** p < 0.0001. N = 4). (c) Following damage to colon micro-tissues, media was collected from microfluidic chambers and IL-8 was measured using a commercial ELISA assay kit. All error bars represent standard error of the mean. A one-way ANOVA was performed with an α = 0.05 and Dunnett’s multiple comparisons test was used to compare cytokine stimulation conditions to the untreated control for each donor. (ns not significant, * p < 0.05, ** p < 0.01, *** p < 0.005, **** p < 0.0001. N = 3).

References

    1. Dahlhamer JM, Zammitti EP, Ward BW, Wheaton AG, Croft JB. Prevalence of inflammatory bowel disease among adults aged ≥18 years—United States, 2015. MMWR Morb. Mortal. Wkly. Rep. 2016;65:1166–1169. doi: 10.15585/mmwr.mm6542a3. - DOI - PubMed
    1. Xu F. Health-risk behaviors and chronic conditions among adults with inflammatory bowel disease—United States, 2015 and 2016. MMWR Morb. Mortal. Wkly. Rep. 2018;67:190. doi: 10.15585/mmwr.mm6706a4. - DOI - PMC - PubMed
    1. Burisch J, Munkholm P. The epidemiology of inflammatory bowel disease. Scand. J. Gastroenterol. 2015;50:942–951. doi: 10.3109/00365521.2015.1014407. - DOI - PubMed
    1. Xu F, Liu Y, Wheaton AG, Rabarison KM, Croft JB. Trends and factors associated with hospitalization costs for inflammatory bowel disease in the United States. Appl. Health Econ. Health Policy. 2019;17:77–91. doi: 10.1007/s40258-018-0432-4. - DOI - PMC - PubMed
    1. Argollo M, et al. Comorbidities in inflammatory bowel disease: A call for action. Lancet Gastroenterol. Hepatol. 2019;4:643–654. doi: 10.1016/S2468-1253(19)30173-6. - DOI - PubMed