. 2023 Jul;30(7):902-913.
doi: 10.1038/s41594-023-01002-x. Epub 2023 Jun 1.

Structural basis for control of bacterial RNA polymerase pausing by a riboswitch and its ligand

Affiliations

Structural basis for control of bacterial RNA polymerase pausing by a riboswitch and its ligand

Adrien Chauvier et al. Nat Struct Mol Biol. 2023 Jul.

Abstract

Folding of nascent transcripts can be modulated by the RNA polymerase (RNAP) that carries out their transcription, and vice versa. A pause of RNAP during transcription of a preQ1 riboswitch (termed que-PEC) is stabilized by a previously characterized template consensus sequence and the ligand-free conformation of the nascent RNA. Ligand binding to the riboswitch induces RNAP pause release and downstream transcription termination; however, the mechanism by which riboswitch folding modulates pausing is unclear. Here, we report single-particle cryo-electron microscopy reconstructions of que-PEC in ligand-free and ligand-bound states. In the absence of preQ1, the RNA transcript is in an unexpected hyper-translocated state, preventing downstream nucleotide incorporation. Strikingly, on ligand binding, the riboswitch rotates around its helical axis, expanding the surrounding RNAP exit channel and repositioning the transcript for elongation. Our study reveals the tight coupling by which nascent RNA structures and their ligands can functionally regulate the macromolecular transcription machinery.


Conflict of interest statement

Competing Interests Statement

The authors declare no competing interests.

Figures
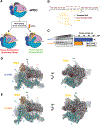
Figure 1.
Figure 1.. Mechanism of transcriptional pausing at the que pause and structure of the que-PEC.
(A) Schematic illustration of transcriptional pausing regulation through a riboswitch conformational change at the que pause. Upon encountering a consensus pause sequence, RNAP enters an offline elemental paused state (PEC) that can be either stabilized (undocked state) or released through a riboswitch conformational change (docked state) upon preQ1 ligand binding. Green star represents potential contact between the RNA and RNAP ß-flap domain (B) Nucleic acid scaffold used for cryo-EM data acquisition. Sequence and secondary structure of the Bsu preQ1 riboswitch used in this study are shown. (C) Lifetimes of the que pause determined in the absence and presence of preQ1. que-PEC was assembled under conditions similar to those used to assemble the sample for cryo-EM data collection. The rate of pause escape was determined after addition of the next templated rNTP (rGTP). Samples were taken 15, 30, 45, 60, 90, 120, 240 and 480 s after the addition of 5 μM rGTP (band labeled as +2). Ch lanes are chased reactions collected after addition of 100 μM rGTP for 5 additional min. Error bars are SD (Standard Deviation) of the mean from independent replicates (n = 2) (D) Overall fold and cryo-EM density of the que-PEC obtained in the absence of preQ1. The 3.3 Å resolution cryo-EM map is rendered as a transparent surface and the refined model of the que-PEC is colored as labeled. The RNAP backbone is represented as a ribbon diagram. The RNA transcript is colored gold, tDNA is colored black and ntDNA is colored dark red. (E) Overall fold and cryo-EM density of the que-PEC obtained in the presence of preQ1. The 3.8 Å resolution cryo-EM map is rendered as a transparent surface and the refined model of the que-PEC is colored as in panel D.
Figure 2.
Figure 2.. Transcription reactivation occurs through RNA reverse translocation in the presence of ligand.
(A) Nucleic acid scaffold and density map (transparent surface) for the RNA-DNA hybrid is indicated on the left. The RNA transcript is colored gold, tDNA is colored black and ntDNA is colored dark red. In the middle the RNAP translocation state is compared to the cross-linked EC (PDB: 6ALF), which is colored green. The que-PEC is colored in blue in the absence of preQ1 and orange in the presence of ligand. (B) Diagram of the RNAP:DNA and RNAP:RNA contacts in the absence (left) and presence (right) of preQ1 ligand as seen (or modeled) in the cryo-EM maps from 3DVA. (C) In vitro transcription assay of mutants altering the uracil content in the RNA-DNA hybrid at the que-PEC performed in the absence and presence of preQ1. Sequences of the RNA-DNA hybrid for each mutant are indicated on the top. FL, full-length RNA and Term, terminated RNA products. (D) Percentage of terminated product relative to the full-length transcript for each construct tested. Error bars are SD (stand deviation) of the mean from independent replicates (n = 2).
Figure 3.
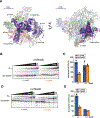
Figure 3.. Binding of preQ1 to que-PEC RNAP induces swivel module rotation and β-clamp closing.
(A) Least-squares super-positioning of the que-PEC in the absence and presence of preQ1. The arrows at the β’-SI3 domain and clamp helices represent the directionality of the transition upon preQ1 binding. The non-swiveled preQ1-bound que-PEC is colored blue and the swiveled que-PEC structure in the absence of preQ1 is colored purple. The ntDNA, tDNA and the RNA nucleotides are colored red, black and gold respectively. The protein backbone is rendered as cartoon ribbons and the nucleic acids as both sticks and cartoons. Refined coordinates for both ligand-free 3DVA component 0 and ligand-bound 3DVA component 0 structures were aligned with the RNAP structural core module in ChimeraX. (B) Representative gels from in vitro transcription of the preQ1 riboswitch performed in the presence of 100 nM NusA transcription factor. Transcription was performed in the absence (-) and presence (+) of 10 μM preQ1 ligand. Samples were taken 15, 30, 45, 60, 90, 120, 240 and 480 s after the addition of all rNTPs. Ch lanes are chased reactions collected after addition of 500 μM rNTPs for 5 additional min. FL, Full-length product. (C) Quantification of que pause half-life performed in the absence (blue) or presence (orange) of preQ1 when NusA is missing (left) or present (right) during the transcription reaction. Error bars are SD (Standard Deviation) of the mean from independent replicates (n = 2). (D) Representative gels from in vitro transcription of the preQ1 riboswitch performed in the presence of 100 nM NusG transcription factor. Transcription was performed in the absence (-) and presence (+) of 10 μM preQ1 ligand. Samples were taken 15, 30, 45, 60, 90, 120, 240 and 480 s after the addition of all rNTPs. Ch lanes are chased reactions collected after addition of 500 μM rNTPs for 5 additional min. FL, Full-length product. (E) Quantification of que pause half-life performed in the absence (blue) or presence (orange) of preQ1 when NusG is missing (left) or present (right) during the transcription reaction. Error bars are SD (Standard Deviation) of the mean from independent replicates (n = 2).
Figure 4.
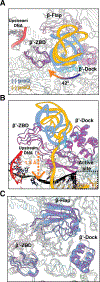
Figure 4.. MDFF analysis reveals a rotation of the riboswitch within the RNA exit channel in the presence of ligand.
(A) RNAP exit channel subdomains in close proximity to the emerging riboswitch in the absence (blue) and presence (orange) of preQ1 ligand. The arrow depicts the 42° rotation of the riboswitch upon ligand binding. Key RNAP structural subdomains are colored purple and magenta in the absence and presence of preQ1, respectively. (B) Rotated view of the RNAP exit channel showing the widening of the exit channel domains and reverse translocation of the transcript toward the active site (dashed black box). The catalytic triad residues D460, D462 and D464 (green) and the active site (dashed box) are indicated. The arrow depicts the direction of the RNA translocation in the presence of preQ1. (C) The exit channel cleft of the ligand-free complex (light blue) compared to the ligand-bound complex which can be seen to be in a more open state (purple).
Figure 5.
Figure 5.. Key RNA:protein interactions within the RNA exit channel.
(A) View from the outside of the RNAP exit channel with the surface of RNAP colored by electrostatic charge (−5 red to +5 blue). (B) Map of RNAP amino acid side chains that are in close contact with the riboswitch pseudoknot. Blue, interactions in the absence of preQ1; orange in the presence of preQ1. Green boxes highlight residues conserved among bacteria. (C) Close contacts between The RNAP exit channel nucleotides and the 5’-side of the pseudoknot in the absence of preQ1. The RNAP exit channel domains are colored in green and the RNA residues in yellow. Shaded ovals indicate the regions of proximity between the riboswitch and RNAP domains and key nucleotides are indicated in red (see also Table S3). (D) preQ1 binding and subsequent steric hindrance shift the riboswitch closer to the ß’-ZBD. Shaded oval indicates the region of proximity between the riboswitch and RNAP domains and key nucleotides are indicated in red (see also Table S3).
Figure 6.
Figure 6.. Model for RNAP entering and release from the que pause as a function of ligand binding to the riboswitch.
RNAP can convert to a PEC once encountering a consensus pause sequence that is stabilized by riboswitch folding. Binding of preQ1 ligand induces pseudoknot stabilization to release RNAP from the paused state. The docked state (induced by ligand binding) leads to riboswitch rotation within the RNAP exit channel, ultimately leading to RNA exit channel expansion to accommodate the nascent transcript. Active site schematics are shown as oval insets.

References

    1. Lane WJ & Darst SA Molecular evolution of multisubunit RNA polymerases: structural analysis. J. Mol. Biol 395, 686–704 (2010). - PMC - PubMed
    1. Bar-Nahum G et al. A ratchet mechanism of transcription elongation and its control. Cell 120, 183–193 (2005). - PubMed
    1. Pan T & Sosnick T RNA folding during transcription. Annu. Rev. Biophys. Biomol. Struct 35, 161–175 (2006). - PubMed
    1. Chatterjee S, Chauvier A, Dandpat SS, Artsimovitch I & Walter NG A translational riboswitch coordinates nascent transcription–translation coupling. Proc. Natl. Acad. Sci 118, (2021). - PMC - PubMed
    1. Artsimovitch I & Landick R The transcriptional regulator RfaH stimulates RNA chain synthesis after recruitment to elongation complexes by the exposed nontemplate DNA strand. Cell 109, 193–203 (2002). - PubMed

Publication types