. 2023 Jun;26(6):1100-1110.
doi: 10.1038/s41593-023-01324-5. Epub 2023 Jun 1.

Augmenting hippocampal-prefrontal neuronal synchrony during sleep enhances memory consolidation in humans

Affiliations

Augmenting hippocampal-prefrontal neuronal synchrony during sleep enhances memory consolidation in humans

Maya Geva-Sagiv et al. Nat Neurosci. 2023 Jun.

Abstract

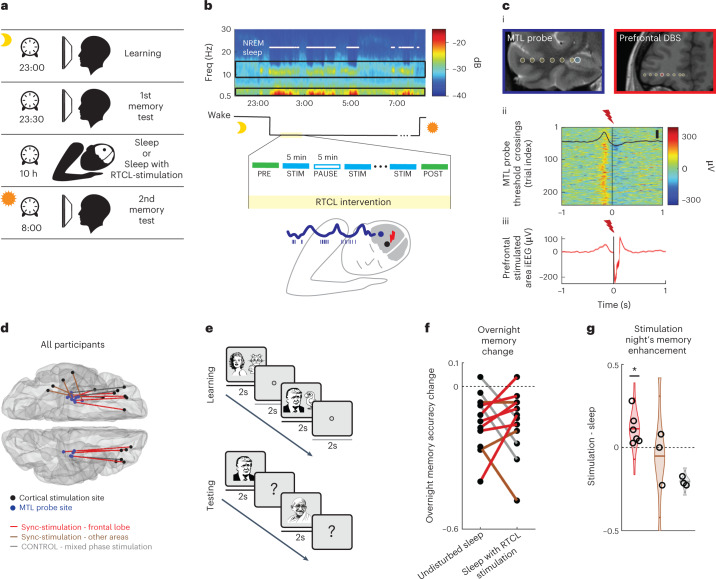
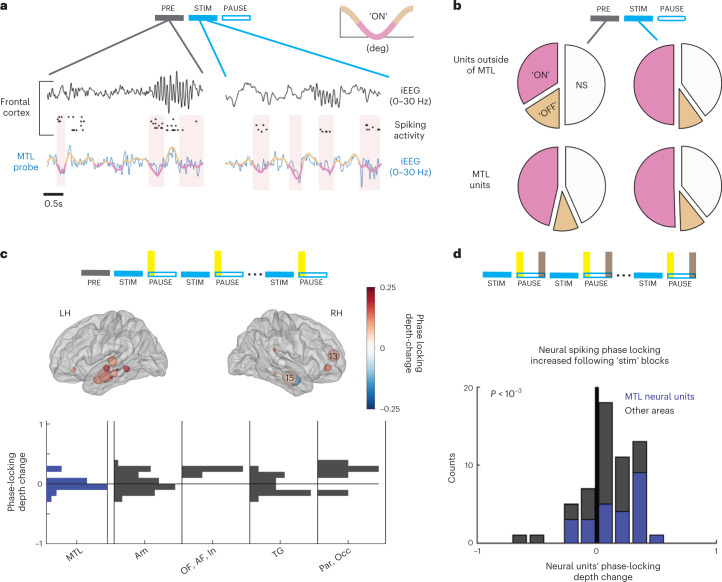
Memory consolidation during sleep is thought to depend on the coordinated interplay between cortical slow waves, thalamocortical sleep spindles and hippocampal ripples, but direct evidence is lacking. Here, we implemented real-time closed-loop deep brain stimulation in human prefrontal cortex during sleep and tested its effects on sleep electrophysiology and on overnight consolidation of declarative memory. Synchronizing the stimulation to the active phases of endogenous slow waves in the medial temporal lobe (MTL) enhanced sleep spindles, boosted locking of brain-wide neural spiking activity to MTL slow waves, and improved coupling between MTL ripples and thalamocortical oscillations. Furthermore, synchronized stimulation enhanced the accuracy of recognition memory. By contrast, identical stimulation without this precise time-locking was not associated with, and sometimes even degraded, these electrophysiological and behavioral effects. Notably, individual changes in memory accuracy were highly correlated with electrophysiological effects. Our results indicate that hippocampo-thalamocortical synchronization during sleep causally supports human memory consolidation.


Conflict of interest statement

M.G.-S., Y.N. and I.F. are co-inventors of a US patent related to this investigation. The authors declare no other competing interests.

Figures

Fig. 1
Fig. 1. Neocortical stimulation synchronized to medial temporal lobe sleep activity improves overnight recognition memory accuracy.
a, Experimental design. Each individual participated in two overnight sessions (order counterbalanced), an undisturbed sleep session and another session with RTCL neocortical stimulation. Memory was assessed immediately following evening learning and following sleep. b, Top, representative spectrogram of iEEG during overnight sleep session (short-time Fourier transform; Methods). Black rectangles mark slow-wave (0.5–4 Hz) and sleep spindle (9–16 Hz) frequency bands used for NREM detection (white dots). Middle, RTCL intervention lasted 45–90 min with alternating 5-min stimulation (STIM) and PAUSE intervals. PRE interval (interval before the first stimulation block) is used for some analyses. Bottom, schematic of RTCL approach where MTL slow-wave active states (blue iEEG troughs, co-occurring with neuronal activity, bars) are used to trigger neocortical stimulation pulses (red). c, Representative RTCL input and DBS sites: (i) Coronal magnetic resonance (MR) images denoting iEEG electrode locations. Blue, RTCL input’s MTL location; red, prefrontal white-matter DBS location; yellow, iEEG contacts on same electrodes. (ii) Single-trial MTL probe iEEG signals (each row denotes a trial): increased voltage (warm colors) triggered stimulation in a neocortical site at t = 0 s (participant 2, n = 244 stimulations). Average and s.e.m. of the MTL probe signal are superimposed (black; scale bar, 100 μV). (iii) Average iEEG signal adjacent to the neocortical stimulation site, aligned to stimulation pulses. d, All pairs of MTL probe (blue) and stimulation site electrodes (black), overlaid on a standard (Montreal Neurological Institute (MNI)) brain template (n = 18 participants). Line color depicts stimulation type. Red, synchronizing stimulation (sync-stim) in prefrontal cortex; brown, sync-stimulation in temporal neocortical regions; gray, mixed-phase stimulation in prefrontal neocortex. e, Learning and memory paradigm presented image pairs of celebrities and animals, followed by recognition memory testing (Methods). f, Overnight change in recognition memory accuracy following undisturbed sleep versus sleep with RTCL stimulation. Line colors as in d. g, Within-participant difference in overnight recognition memory accuracy between intervention night and undisturbed sleep. All participants with sync-stimulation in orbitofrontal cortex (red) show superior performance in stimulation nights (P = 0.01, binomial test), while none of mixed-phase stimulation participants (gray) do. Source data
Fig. 2
Fig. 2. Synchronized stimulation enhancement of sleep spindles correlates with memory accuracy improvements.
a, Immediate (<3 s) changes in sleep spindle activity during STIM blocks (yellow highlight) compared to sham intervals during PAUSE blocks. (i) Representative average time–frequency response (TFR; induced power) following stimulation in orbitofrontal cortex iEEG shows immediate increase in spindle power (9–16 Hz, white rectangle). (ii) Enhanced spindle power following sync-stimulation compared to sham stimulation (n = 565 iEEG electrodes). P = 1.4 × 10−39 via Wilcoxon paired signed-rank test. b, Representative spindles (blue asterisks) in simultaneously recorded iEEGs (black time-courses, z-scored for visualization) of two participants. Bottom time course (blue), MTL signal used for stimulation timing, superimposed with slow-wave-filtered (<2.5 Hz) signal showing active (pink) versus inactive (brown) phases; R, right; L, left; OF, orbitofrontal cortex; EC, entorhinal cortex; AH, anterior hippocampus; A, amygdala; PHG, parahippocampal gyrus. c, Spindle detection probability increases immediately following sync-stimulations (i, n = 509 iEEG electrodes) and decreases following mixed-phase stimulation (iii, n = 212 iEEG electrodes) relative to sham moments. Black crosses denote the median. P = 1.6 × 10−6 for sync-stimulation versus sham. P = 2.44 × 10−10 for mixed-phase stimulation versus sham via Wilcoxon signed-rank tests. P = 2.66 × 10−14 for sync versus mixed-phase stimulation via Wilcoxon rank-sum test. (ii) Individual memory accuracy enhancement by intervention (y axis, as in Fig. 1g) correlates with immediate spindle enhancement (Spearman correlation ρ = 0.69, P = 0.013, n = 12 participants). Spindle enhancement distribution across all iEEG contacts is shown for each participant; colors as in Fig. 1d. Black crosses indicate the median per participant. Black solid or dashed lines show the linear fit for all participants or sync-stim participants alone, respectively. d, Top: Prolonged stimulation-driven change in spindle rate in the 1 min following STIM blocks (post-stim; yellow) compared to the 1 min at the end of pause blocks (pre-stim; gray). Middle: Prolonged stimulation-driven enhancement scores (Methods) in slow-wave event rate (y axis) versus sleep spindle event rate (x axis). Each dot depicts an iEEG electrode (n = 275, 90 and 175 iEEG contacts for red, brown and gray groups, respectively; colors as in Fig. 1c). Spindle rates are elevated in sync-stimulation participants but not in mixed-phase participants. Statistical comparisons via Wilcoxon rank-sum test: P = 2.98 × 10−9 for slow waves and P = 1.42 × 10–10 for spindle indices. Whiskers depict the 25th–75th percentiles for sync-stim (red; all stim locations) and mixed-phase contacts (gray). Bottom: Prolonged enhancement of spindle rate following sync-stimulation blocks is widespread across both cortical hemispheres. Each circle (n = 275) marks an iEEG electrode in sync-stimulation participants. Circle color represents spindle event enhancement score (Methods); contact location is overlaid on a standard MNI brain template. Source data
Fig. 3
Fig. 3. Neuronal spiking across the brain phase locks to medial temporal lobe slow-wave activity following synchronized stimulation.
a, Two representative examples show 4 s of orbitofrontal cortex spiking activity during sleep before (left) and during (right) stimulation. Rows (top to bottom) show prefrontal iEEG (black, filtered 0–30 Hz), spiking in four neuronal clusters (black ticks) and MTL probe iEEG (blue) superimposed with slow-wave active (pink) versus inactive (brown) phases. Spiking activity before stimulation is scattered and becomes phase locked to MTL active phase (pink) during stimulation blocks. iEEGs were z-scored for visualization. b, Analysis across neuronal population: Fraction of units showing significant phase locking to MTL ‘ON’ phase (pink), to MTL ‘OFF’ phase (brown) or no significant (NS) phase locking (white). Top row, outside MTL (n = 190), the percentage of locked clusters increased from 34.0% during baseline (‘PRE’, gray block, left pie chart) to 50.0% during stimulation block (‘STIM’, blue, right pie chart). In MTL, the percentage of phase-locked units (n = 107) remained stable (46.5% pre-stim (left) and 50.5% during stim block (right)). c, Prolonged increase (1 min after stimulation, yellow intervals) in phase locking to MTL slow waves (quantified by locking depth change; Methods) is widespread across cortex in both hemispheres regardless of stimulation location. Each circle shows the anatomical location of neuronal clusters overlaid on a standard (MNI) brain template. Circle color represents changes in phase locking for that region (color bar on right). Circle size reflects the number of units detected in that region (largest spheres have numbers overlaid). Bottom, locking depth change distributions by regions. MTL includes hippocampus, entorhinal cortex and parahippocampal gyrus. Am, amygdala; OF, orbitofrontal cortex; AF, anterior prefrontal cortex; In, insula; TG, temporal gyrus; Par, parietal cortex; Occ, occipital cortex. d, Prolonged neural phase-locking increase (Methods, time periods as in Fig. 2d, yellow versus gray periods highlighted in top illustration). Locking depth change distributions are stacked for neural units located in MTL (blue) and other areas (dark gray); n = 57 units met firing rate criteria; P = 5 × 10−4 via Wilcoxon signed-rank test. Source data
Fig. 4
Fig. 4. Synchronized stimulation increases triple co-occurrence of medial temporal lobe ripples, neocortical slow waves and thalamocortical spindles.
a, (i) Example ripples (brown asterisks) detected in MTL (parahippocampal gyrus) iEEG: top and bottom rows show iEEG signal filtered (0–300 Hz or 80–100 Hz, respectively). Middle row, spiking activity on adjacent microelectrodes. (ii) Grand average of unfiltered iEEG aligned to the maximum ripple peak (mean ± s.e.m., n = 7,172 ripple detections in 28/13 iEEG channels/participants during pre-stim epochs). (iii) Average ripple-peak-locked TFR (percentage change from 1-s baseline) highlights the band-limited frequency profile of detected ripples. b, All pairs of neocortical (black) and MTL (blue) iEEG electrodes used in subsequent co-occurrence analysis, overlaid on a standard (MNI) brain template (n = 41 iEEG electrode pairs, 15 participants). Line colors as in Fig. 1d. c, Double co-occurrence of MTL ripples and neocortical slow waves: (i) Example: simultaneous recording of neocortical slow wave (top; purple asterisk shows positive iEEG peak) and MTL ripple (middle and bottom; brown asterisk shows detected ripple). (ii) Incidence of double co-occurrence significantly increased in the 1-min interval post-stimulation blocks (yellow) relative to 1-min end of pause block (gray). Inset, box plot of differences between post-stim and pre-stim incidence rates (n = 25 electrode pairs in 10 participants in sync-stimulation group; P = 8.2 × 10−4, right-tailed Wilcoxon signed-rank test). Line colors as in Fig. 1d. See Extended Data Fig. 9d for mixed-phase distribution. d, Triple co-occurrence of MTL ripples, neocortical slow waves and thalamocortical spindles: (i) Example signals as in c. Pink asterisk denotes spindle identified shortly after slow-wave/ripple event. (ii) Incidence of triple co-occurrence significantly increased in the 1-min interval post-stimulation blocks (yellow) relative to 1-min end of interval block (gray). Inset, box plot of differences between post-stim and pre-stim incidence rates (n = 5 electrode pairs in 3 participants, P = 0.03, right-tailed Wilcoxon signed-rank test). See Extended Data Fig. 9e for mixed-phase distribution. Box plots in panels c and d represent interquartile range, whiskers mark the 1–99 percentiles. e, Memory accuracy enhancement following intervention (y axis) correlates with increase in MTL ripples-neocortical slow waves double co-occurrence (x axis; Spearman correlation, ρ = 0.8, P = 0.007; n = 30 MTL–neocortical electrode pairs in 8 participants). Markers are median values per participant, bars are the s.e.m.; colors as in Fig. 1d; black line shows linear fit based on median values per participant. Subpanel shows correlation between memory accuracy enhancement and stringent triple co-occurrence criteria (MTL ripples, neocortical slow waves and spindles; n = 12 pairs, 6 participants, ρ = 0.7, P = 0.2). iEEGs were z-scored for visualization. Source data
Extended Data Fig. 1
Extended Data Fig. 1. Automated scoring of NREM sleep intervals based on iEEG.
An example of overnight NREM detection performed on orbitofrontal cortex iEEG activity, used for sleep scoring in participant #3 (full spectrogram: Fig. 1b). (a) Scatter plot of spindle power (9–16 Hz) versus slow-wave power (0.5–4 Hz). Each dot marks a 30 sec epoch, and its color denotes scoring as NREM (red) or desynchronized (REM sleep/wakefulness, green), according to the maximum posterior probability of a 2-component Gaussian mixture fit to the entire dataset. (b) iEEG power spectrum for each vigilance state for participant #3. Red: NREM sleep. Green: overnight desynchronized. Gray: unequivocal wakefulness periods occurring before or after the overnight sleep session. Note that iEEG power spectrum during overnight desynchronized states (green) resembles that found for unequivocal wakefulness (gray). (c) (i) Grand mean iEEG power spectra over all participants for all sleep/wake stages (n = 19 overnight sessions). Colors as in b. (ii-iv) Solid lines show the mean spectra across all patients; Dashed lines denote power spectrum per patient for NREM sleep (ii), overnight desynchronized states(iii), and unequivocal wakefulness periods(iv). Source data
Extended Data Fig. 2
Extended Data Fig. 2. Location of MTL synchronization-probe and neocortical stimulation iEEG electrodes.
For each participant (p1–18), two coronal MR images show the locations of the MTL synchronization-probe for closed-loop control (left image, blue circles) and neocortical stimulation site (right image, red circles, for bipolar stimulations the adjacent contact was used as reference). Yellow circles depict other iEEG contacts on the depth electrode. Title for each MR image: p = participant, number corresponds to participant-id in Supplementary Tables 1–4. Then the location of the highlighted iEEG contact. R = right, L = Left; PF = prefrontal cortex, T = temporal cortex, TO = Temporal-occipital cortex, AH = Anterior Hippocampus, MH = Middle hippocampus, EC = Entorhinal cortex, PHG = Parahippocampal gyrus. Note that participants 5–7,15 are shown at the bottom, as stimulation site was outside the prefrontal lobe.
Extended Data Fig. 3
Extended Data Fig. 3. Closed loop system.
(a) Example from participant #7 showing the average and SEM of MTL probe’s iEEG signal (blue trace, filtered between [0.5–4]Hz to highlight slow-wave activity), time-locked to the positive iEEG peak immediately preceding stimulation time (t = 0). Note that iEEG peak corresponds to the neuronal inactive slow-wave phase. Top inset: distribution of stimulation delays (n = 423 stimulation events during period highlighted by gray background) from iEEG slow-wave positive peak for this participant. (b) Our phase targeting method was based on detecting peaks in the iEEG signal and delivering stimulation at a pre-determined delay following the peak. We quantified the degree to which stimulations were delivered in phase with MTL active periods post hoc. All sync-stimulation patients (red, brown) had >60% stimulations delivered in the planned delay range, while mixed-phased patients (gray) had <45% stimulations within that range. Two subpanels on the right depict two representative distributions of stimulation delays in two patients – patient #18 from sync-stim group (top) and patient #1 from the mixed-phase group (bottom). (c) Individual immediate effect of spindle increase reveal significant positive correlation to the percentage of in-range stimulations (Spearman correlation: ρ = 0.51, *P = 0.027, n = 18 nights). The distribution across all iEEG contacts for each stimulation night is shown; black crosses mark the mean spindle enhancement in each subject. Red, sync-stimulation in prefrontal cortex. Brown, sync-stimulation in other neocortical regions. Gray, mixed-phase stimulation in prefrontal cortex. (d) Memory enhancement (as in Fig. 1g) is positively correlated with the percentage of in-range stimulations (Methods, Spearman correlation: ρ = 0.40, P = 0.19, n = 12 patients). Source data
Extended Data Fig. 4
Extended Data Fig. 4. Behavioral measures.
(a, b) Association testing: Participants were asked to recall the animal associated with every person they recognized from the learning session. Pairing index (PI; 100*number correct/number attempted). (a) Overnight change PIMorning-PIEvening is plotted for participants who were tested following undisturbed sleep (left) and following a sleep with RTCL stimulation (right). Line color depicts stimulation type: red, synchronizing stimulation (n = 5, one participant chose not to complete the association test after undisturbed sleep night); brown, synchronizing stimulation, delivered in other regions (n = 2); gray, mixed-phase stimulation in prefrontal neocortex (n = 3). (b) Within-subject difference of overnight change in pairing success between intervention night and undisturbed sleep (difference between the dots in panel a): 5 of 7 participants with sync-stimulation (red, brown) showed either no change or superior performance in stimulation nights (Stimulation – Sleep > = 0), while only 1 of 3 participants with mixed-phase stimulation (gray) showed this effect. There were no significant changes in pairing success rates following RTCL stimulation relative to undisturbed nights. (ce) Estimating effect size for recognition memory accuracy and its components (hit rate and false alarm rate): we performed bootstrapping (n = 1000) by selecting a random sample (with replacement) from each night’s image set and recalculating each memory evaluation measure on the subsampled data for each patient. The main panel displays the mean and standard deviation of the bootstrapped values for each patient, and the inset shows the distribution of the means across patients for each bootstrapping cycle, aggregating all sync-stim patients in red and mixed-phase patients in gray. (c) Recognition memory accuracy. The mean change in memory accuracy for the sync-stim averaged bootstrapped group trends toward improvement, but does not reach the 5% significance level, as the 95% confidence interval contains 0. (d) Correctly recognized images (hits). Each intervention had minimal effect on this measure. (e) Wrongly identified lures (false alarms). None of the frontal-lobe sync-stimulation subjects (red) exhibited an increase in the number of false alarms, while all mixed-phase subjects exhibited such an increase. The distribution of estimated means indicates a trend toward a decrease in false alarms for the sync-stimulation subjects and a significant increase in false alarm rate for the mixed-phase stimulation subjects. This suggests that the difference in performance following the two types of stimulation can be attributed to distinct effects on source memory. (f, g) Reaction time (RT) changes: (f) Change in mean RT for recognized images was not significantly different between intervention nights (red) and undisturbed nights (green) (n = 9, P = 0.65; Wilcoxon rank-sum test). (g) RT change on a separate psychomotor vigilance task (PVT, see Methods) shows significantly faster performance following undisturbed sleep than after sleep with RTCL stimulation (n = 11, P = 0.01; Wilcoxon rank-sum test). The bounds of the boxes (panels f, g) represent the interquartile range and whiskers extend between 1–99 percentiles. Source data
Extended Data Fig. 5
Extended Data Fig. 5. Brain-wide change in sleep oscillation rates following sync-stimulation.
(a-c) Distributions of immediate change of detection probabilities for slow waves (a), spindles (b), and slow wave-spindle couples (c) for contacts across the brain. Probability was calculated in 3 sec intervals immediately following stimulations, relative to SHAM-stimulation control points (as in Fig. 2c). These distributions reveal decreased probability of slow waves in participants from both stimulation groups (red: sync stim; gray: mixed-phase stim). Wilcoxon signed rank tests are reported for each distribution and rank sum for comparing both distributions: (a) slow-waves: P = 8*10−80 (sync), P = 3*10−32 (mixed), P = 0.08 (between groups), n = 556/215 iEEG contacts for red/gray groups. (b) Spindles: P = 6*10−8 (sync), P = 4*10−17 (mixed), P = 3*10−23 (between groups), n = 508/212 iEEG contacts for red/gray groups. (c) Slow wave-spindle couples: P = 1.9*10−5 (sync), P = 5*10−8 (mixed), P = 0.056 (between groups), n = 333/169 iEEG contacts for red/gray groups. n-values differ between panels (a–c) because channels with zero detections in one of the conditions were excluded. Sub-panels depict the distribution of baseline probabilities which are not significantly different between the two stimulation-mode groups. (d–i) Distributions of prolonged changes of detection rate for slow-waves, spindles, and slow wave-spindle couples for channels outside the MTL (df) and MTL channels (gi). Event rates were calculated over 1-min following stimulations-blocks (yellow shade in top illustration), relative to an equal time range at the end of each ‘pause’ block (gray shade in top illustration). Panels display the difference between rates (events/min). These distributions reveal an increase in spindle event rate in iEEG contacts in the sync-stimulation condition that decays during ‘pause’ blocks, while mixed-phase stimulation contacts exhibit either no change or reduced rates immediately after stim blocks. Wilcoxon signed rank tests are reported for each distribution and rank sum for comparing both distributions: (d) slow-waves: P = 0.4 (sync) P = 2*10−15 (mixed), P = 4.6*10−10 (between groups), n = 269/161 iEEG contacts for red/gray groups; (e) Spindles: P = 2*10−14 (sync) P = 0.017 (mixed), P = 1.2*10−12 (between groups), n = 208/157 iEEG contacts for red/gray groups; (f) Slow-wave – spindle couples: P = 1.72*10−4 (sync), P = 0.3 (mixed), P = 0.003 (between groups), n = 135/110 iEEG contacts for red/gray groups. N-values differ between panels (d-f) because channels with zero detection in one of the conditions were excluded. (g) slow-waves: P = 0.29 (sync) P = 0.053 (mixed), P = 0.052 (between groups), n = 167/54 iEEG contacts for red/gray groups; (h) Spindles: P = 9*10−5 (sync) P = 0.27 (mixed), P = 0.086 (between groups), n = 106/47 iEEG contacts for red/gray groups; (i) Slow wave-spindle couples: P = 0.71 (sync) P = 0.70 (mixed), P = 0.99 (between groups), n = 60/29 iEEG contacts for red/gray groups. N-values differ between panels (g-i) because channels with zero detection in one of the conditions were excluded. *** is used for P < 0.001, * for P < 0.05. Source data
Extended Data Fig. 6
Extended Data Fig. 6. Phase-locking change following stimulation.
(a) Spike sorting procedure: (i) top illustration - flexible depth electrodes used for simultaneous recording of iEEG (platinum contacts, blue and black) and unit spiking activity (recorded on microwires, green). (ii) Representative 30-sec example of high-pass filtered (>300 Hz) microwire LFP signal recorded in prefrontal cortex along with threshold for spike detection (red horizontal line). (iii) Screenshot from ‘wave clus’ spike-sorting toolbox demonstrating automatic superparamagnetic clustering of wavelet coefficients for 3 clusters. Left – average waveform for 3 detected clusters, right – each cluster’s waveform (mean and standard deviation) displayed as a heat map. (iv) Example: Inter spike interval (ISI) distribution for cluster #1 during pre-stim sleep and post-stim sleep (correlation between distributions is 0.96). (b) Temporal-fit method for spike phase distribution: Distribution of spike-phases from a neural unit recorded in orbitofrontal cortex, phases calculated for MTL iEEG slow-wave signal. (i) Left - before any stimulation block (‘PRE’), right - during the first ‘pause’ block, demonstrating a prolonged effect of sync-stimulation. Colored letters correspond to fitted values in the equation plotted in bottom panel (see below). (ii) Left: same distributions as in (i) in blue (for ‘PRE’), and in red (prolonged condition), overlaid on a polar plot, with mean direction and resultant vector length computed with circstat toolbox (Matlab, Mathworks); Right - average and SEM of action potential waveform during the entire intervention session. Calibration bars mark 1 msec and 50 µV. (iii) Equation used for fitting the phase distribution and quantifying locking: specific elements used for calculating phase-locking depth are color-coded and shown also on the example distribution plotted in top panel: red dashed line, fitted function. a = amplitude/gain, b = preferred phase. c=baseline (mean firing rate/DC). (c) (i) The distribution of depth-lock change in the prolonged condition (pink, aggregated for n = 65 neural units included in Fig. 3e) is significantly different from a shuffled distribution in which baseline and evaluated condition values are mixed (gray). (ii) The distribution of depth-lock change isn’t significantly different from a bootstrapped distribution calculated based on a sub-set of spikes to test for biases due to firing rate changes (Kolmogorov-Smirnov two-sample test, P = 0.42) (d) Changes in lock-depth for units outside of MTL are not dependent on selection of baseline. (i) and (ii) compare distributions of change relative to two possible baselines (shown in gray shade on each timeline): the PRE-block before any stimulation (i) or aggregated 1-min periods preceding all stim blocks (ii). Each violin plot depicts a distribution of phase-lock changes for a different condition. Pink: prolonged effect (1-min following stim blocks), Yellow: first pause block, Gray: the other panel’s baseline (gray). (i). There is an increase in phase locking for the prolonged time point relative to the baseline (pink; n = 47 units; P = 0.008), as well as during the entire first pause block (yellow; n = 27, P = 0.04). (ii) Baseline: gray; n = 35, P = 0.49. Prolonged: pink; n = 32, P = 0.024. First pause block: yellow, n = 25, P = 0.028. P-values are based on Wilcoxon rank-sum test. Note that inclusion criteria result in slightly different population sizes for each pair of conditions but results are consistent with Fig. 3d, e for all condition-pairs. (e) Phase locking changes following mixed phase stimulation. Reporting the results of a single stimulation session recorded during a daytime nap. The session included interleaved synched and mixed-phase stimulation blocks. We did not find elevated phase-locking of single units for this session (n = 14 single units; 6 from MTL) (i) iEEG power spectrum for each vigilance state for nap session. Blue, NREM sleep. Green, desynchronized states (REM sleep or sporadic wake intervals). Gray, unequivocal wakefulness periods occurring before and after the daytime sleep session. (ii) Average and SEM of MTL probe’s iEEG signal (blue trace, filtered between [0.5–4]Hz to highlight slow-wave activity), time-locked to the positive iEEG peak immediately preceding stimulation time (t = 0). Box-plots depict the distribution of stimulation delays iEEG slow-wave positive peak for this participant – red is sync-stim blocks and black is mixed-phase stim blocks. The bounds of the boxes represent the interquartile range and whiskers extend between 1–99 percentiles. (iii) Comparison of units’ phase-locking to MTL iEEG pre-stim (left pie charts) and during stimulation blocks: While units in the MTL were not affected by mixed-phase stimulation, the number of non-significantly phase-locked units outside the MTL increased during stimulation blocks (an opposite trend than we observed in sync-stimulation sessions – see Fig. 3c). Pink – units phase-locked to MTL iEEG ‘ON’ phase (90–270 degrees); White, non-significant phase-locking (we did not observe units phase-locked to ‘OFF’ phase in this session). Source data
Extended Data Fig. 7
Extended Data Fig. 7. Ripple characteristics in specific MTL regions.
(a) Detected ripples in iEEG electrodes targeting hippocampus (i) Grand average of raw unfiltered iEEG traces (n = 3685 detected ripple events in 12 electrodes/10 patients, mean ± s.e.m.) aligned to the maximum of the ripple peak during pre-stim epochs. (ii) Average power spectrum of iEEG traces (±1 sec around detected ripples). (iii) Average of ripple-peak-locked TFR (time-frequency representation, % change from pre-event baseline, color bar on right) highlights the band-limited nature of ripples around 80–120 Hz. (b) Same format as panel a for detected ripples in iEEG traces of electrodes targeting entorhinal cortex (n = 2646 events in 10 electrodes/7 patients). (c) Same format as panel a for detected ripples in iEEG traces of electrodes targeting parahippocampal cortex (n = 841 events in 6 electrodes/5 patients). Power spectrum reveals peaks at ~3 Hz and ~14 Hz (fast sleep spindles). Calibration bars mark 100 ms and 30μV (hippocampus) or 10μV (other MTL regions). Source data
Extended Data Fig. 8
Extended Data Fig. 8. Pathological interictal epileptiform discharges (IEDs).
(a) (i) Grand average of 5819 unfiltered iEEG traces during pre-stim intervals (mean ± s.e.m) in 33 electrodes with prevalent IED activity based on visual review and neurologist definition (n = 7 participants), aligned to the maximum IED peak (time 0). Note that these channels were excluded from main analyses based on high rate of abnormal activity. Calibration bars mark 100 ms (x-axis) and 100μV (y-axis). (ii) Average of IED-locked TFR (% change from pre-event baseline, color bar on right), highlighting the wide-band and high-frequency spectral profile of IEDs. (iii) Grand average iEEG power spectrum around (±1 s) detected IED events (1–300 Hz, 1 Hz resolution). (b) Effects of stimulation on overnight memory accuracy enhancement (y-axis) vs. change in IED rates (x-axis) do not reveal a consistent relationship: Recognition memory accuracy enhancement per subject (values as in Fig. 1g) vs. median value of each participant’s distribution of IED change does not show a significant correlation (Spearman correlation: ρ = −0.12, P = 0.69, n = 12 participants). The distribution for each patient across all iEEG contacts is shown; IED event rates were calculated over 1-min following stimulations-blocks (yellow shade in top illustration), and normalized relative to an equal time range at the end of each ‘pause’ block (gray shade in top illustration). Color corresponds to stimulation type, as in Extended Data Fig. 3; black crosses mark the median value for each patient. Source data
Extended Data Fig. 9
Extended Data Fig. 9. Coupling of sleep oscillation between MTL and neocortex.
(a) Immediate effect of stimulation on ripple detection. We found a significant reduction, in both stimulation protocols, in ripple event detection probability on MTL iEEG electrodes calculated during 200 ms following stimulation bursts, relative to sham stimulation points. P-values are reported for a Wilcoxon sign-rank test for each distribution. Red: MTL contacts in sync-stimulation patients (n = 18 iEEG contacts, P = 0.004); gray: MTL contacts in mixed-phase stimulation patients (n = 8 iEEG contacts, P = 0.01). Only MTL contacts ipsilateral to the closed-loop input (probe) are included. No significant difference was found between distributions (rank-sum Wilcoxon test. P = 0.7). Note that stimulation was delivered in neocortical sites, distant from MTL (Fig. 1d). (b) Prolonged effect of stimulation on ripple detection: Event rates were calculated over 1-min following stimulation blocks (yellow shade in top illustration), relative to an equal time range at the end of each ‘pause’ block (gray shade). Ripple detection rates were stable in MTL channels during ‘pause’ blocks. Colors as in (a). Wilcoxon sign-rank test for each distribution: Red: n = 18, P = 0.2; Gray: n = 8, P = 0.7. (c) Examples of triple co-occurrences of neocortical slow-waves, thalamo-cortical-spindles and MTL-ripple events: each example displays simultaneous recordings from a pair of iEEG electrodes in neocortex (black, top row, 0–30 Hz), MTL (blue, middle row, 0–300 Hz) and a ripple band (80–100 Hz) band-pass filtered trace of the MTL iEEG (bottom row). Brown star, detected ripple; Purple, detected slow-wave positive iEEG peak (‘OFF’ period), pink – detected spindle event. Calibration bars mark 500 ms (x-axis), for visualization purposes iEEG data were z-scored over a 2-sec period plotted in panel. Examples from participants 2 and 14 (d) Prolonged change in MTL ripple-neocortical slow wave co-occurrence incidence: distribution of differences between post-stim period vs pre-stim period is plotted for iEEG channel couples from each stimulation-mode group. Wilcoxon right-tail signed-rank test: Red: sync-stim, n = 25 iEEG couples, P = 0.0008; gray: mixed-stim, n = 13 iEEG couples, P = 0.36. Wilcoxon rank-sum test between groups: P = 0.049). (e) Prolonged change in MTL ripple-neocortical slow wave, thalamo-cortical spindle triple co-occurrence incidence: distribution of differences between post-stim period vs pre-stim period is shown for iEEG channel couples from each stimulation-mode groups. Wilcoxon right-tail signed-rank test: Red: n = 5 sync-stim iEEG couples, P = 0.031; Gray, n = 7 mixed-stim iEEG couples, P = 0.054, Wilcoxon rank-sum test between groups: P = 0.01). N-values differ between panels (d, e) because channels with zero detection in both conditions were excluded. *** is used for P < 0.001, * for P < 0.05. Source data
Extended Data Fig. 10
Extended Data Fig. 10. High frequency sleep spindles detected in cortical channels.
(a) Neocortical iEEG contacts included in triple-coupling analysis between sleep oscillations in neo-cortex and MTL ripples (n = 41, black), overlaid on a standard (Montreal Neurological Institute) brain template. (b) High-frequency spindles (above 11 Hz), in iEEG electrodes included in triple-coupling analysis. Top: Grand average of raw unfiltered iEEG traces (n = 3764 events in 41 electrodes from11 patients, mean ± s.e.m) aligned to the maximum of the spindle peak during PRE-stim epochs; bottom: average of spindle-peak-locked TFR (time-frequency representation, % change from pre-event baseline, color bar on right) highlights the band-limited nature of spindles around 9–16 Hz (marked by dashed lines). (c) Average of slow wave-peak-locked TFR highlights the increase in spindle-frequency-band (9–15) Hz around slow-wave troughs calculated for slow-waves detected in PRE-stim blocks (same iEEG contacts as in panels a, b). Mean± s.e.m slow wave trace is superimposed in white (scale shown on righthand y-axis). Source data

References

    1. Jenkins JG, Dallenbach KM. Obliviscence during sleep and waking. Am. J. Psychol. 1924;35:605–612. doi: 10.2307/1414040. - DOI
    1. Maquet P. The role of sleep in learning and memory. Science. 2001;294:1048–1052. doi: 10.1126/science.1062856. - DOI - PubMed
    1. Walker MP, Stickgold R. Sleep-dependent learning and memory consolidation. Neuron. 2004;44:121–133. doi: 10.1016/j.neuron.2004.08.031. - DOI - PubMed
    1. Diekelmann S, Born J. The memory function of sleep. Nat. Rev. Neurosci. 2010;11:114–126. doi: 10.1038/nrn2762. - DOI - PubMed
    1. Squire LR, Zola SM. Structure and function of declarative and nondeclarative memory systems. Proc. Natl Acad. Sci. USA. 1996;93:13515–13522. doi: 10.1073/pnas.93.24.13515. - DOI - PMC - PubMed

Publication types