. 2023 Jun;26(6):970-982.
doi: 10.1038/s41593-023-01334-3. Epub 2023 Jun 1.

Single-nucleus multiregion transcriptomic analysis of brain vasculature in Alzheimer's disease

Affiliations

Single-nucleus multiregion transcriptomic analysis of brain vasculature in Alzheimer's disease

Na Sun et al. Nat Neurosci. 2023 Jun.

Erratum in

Abstract

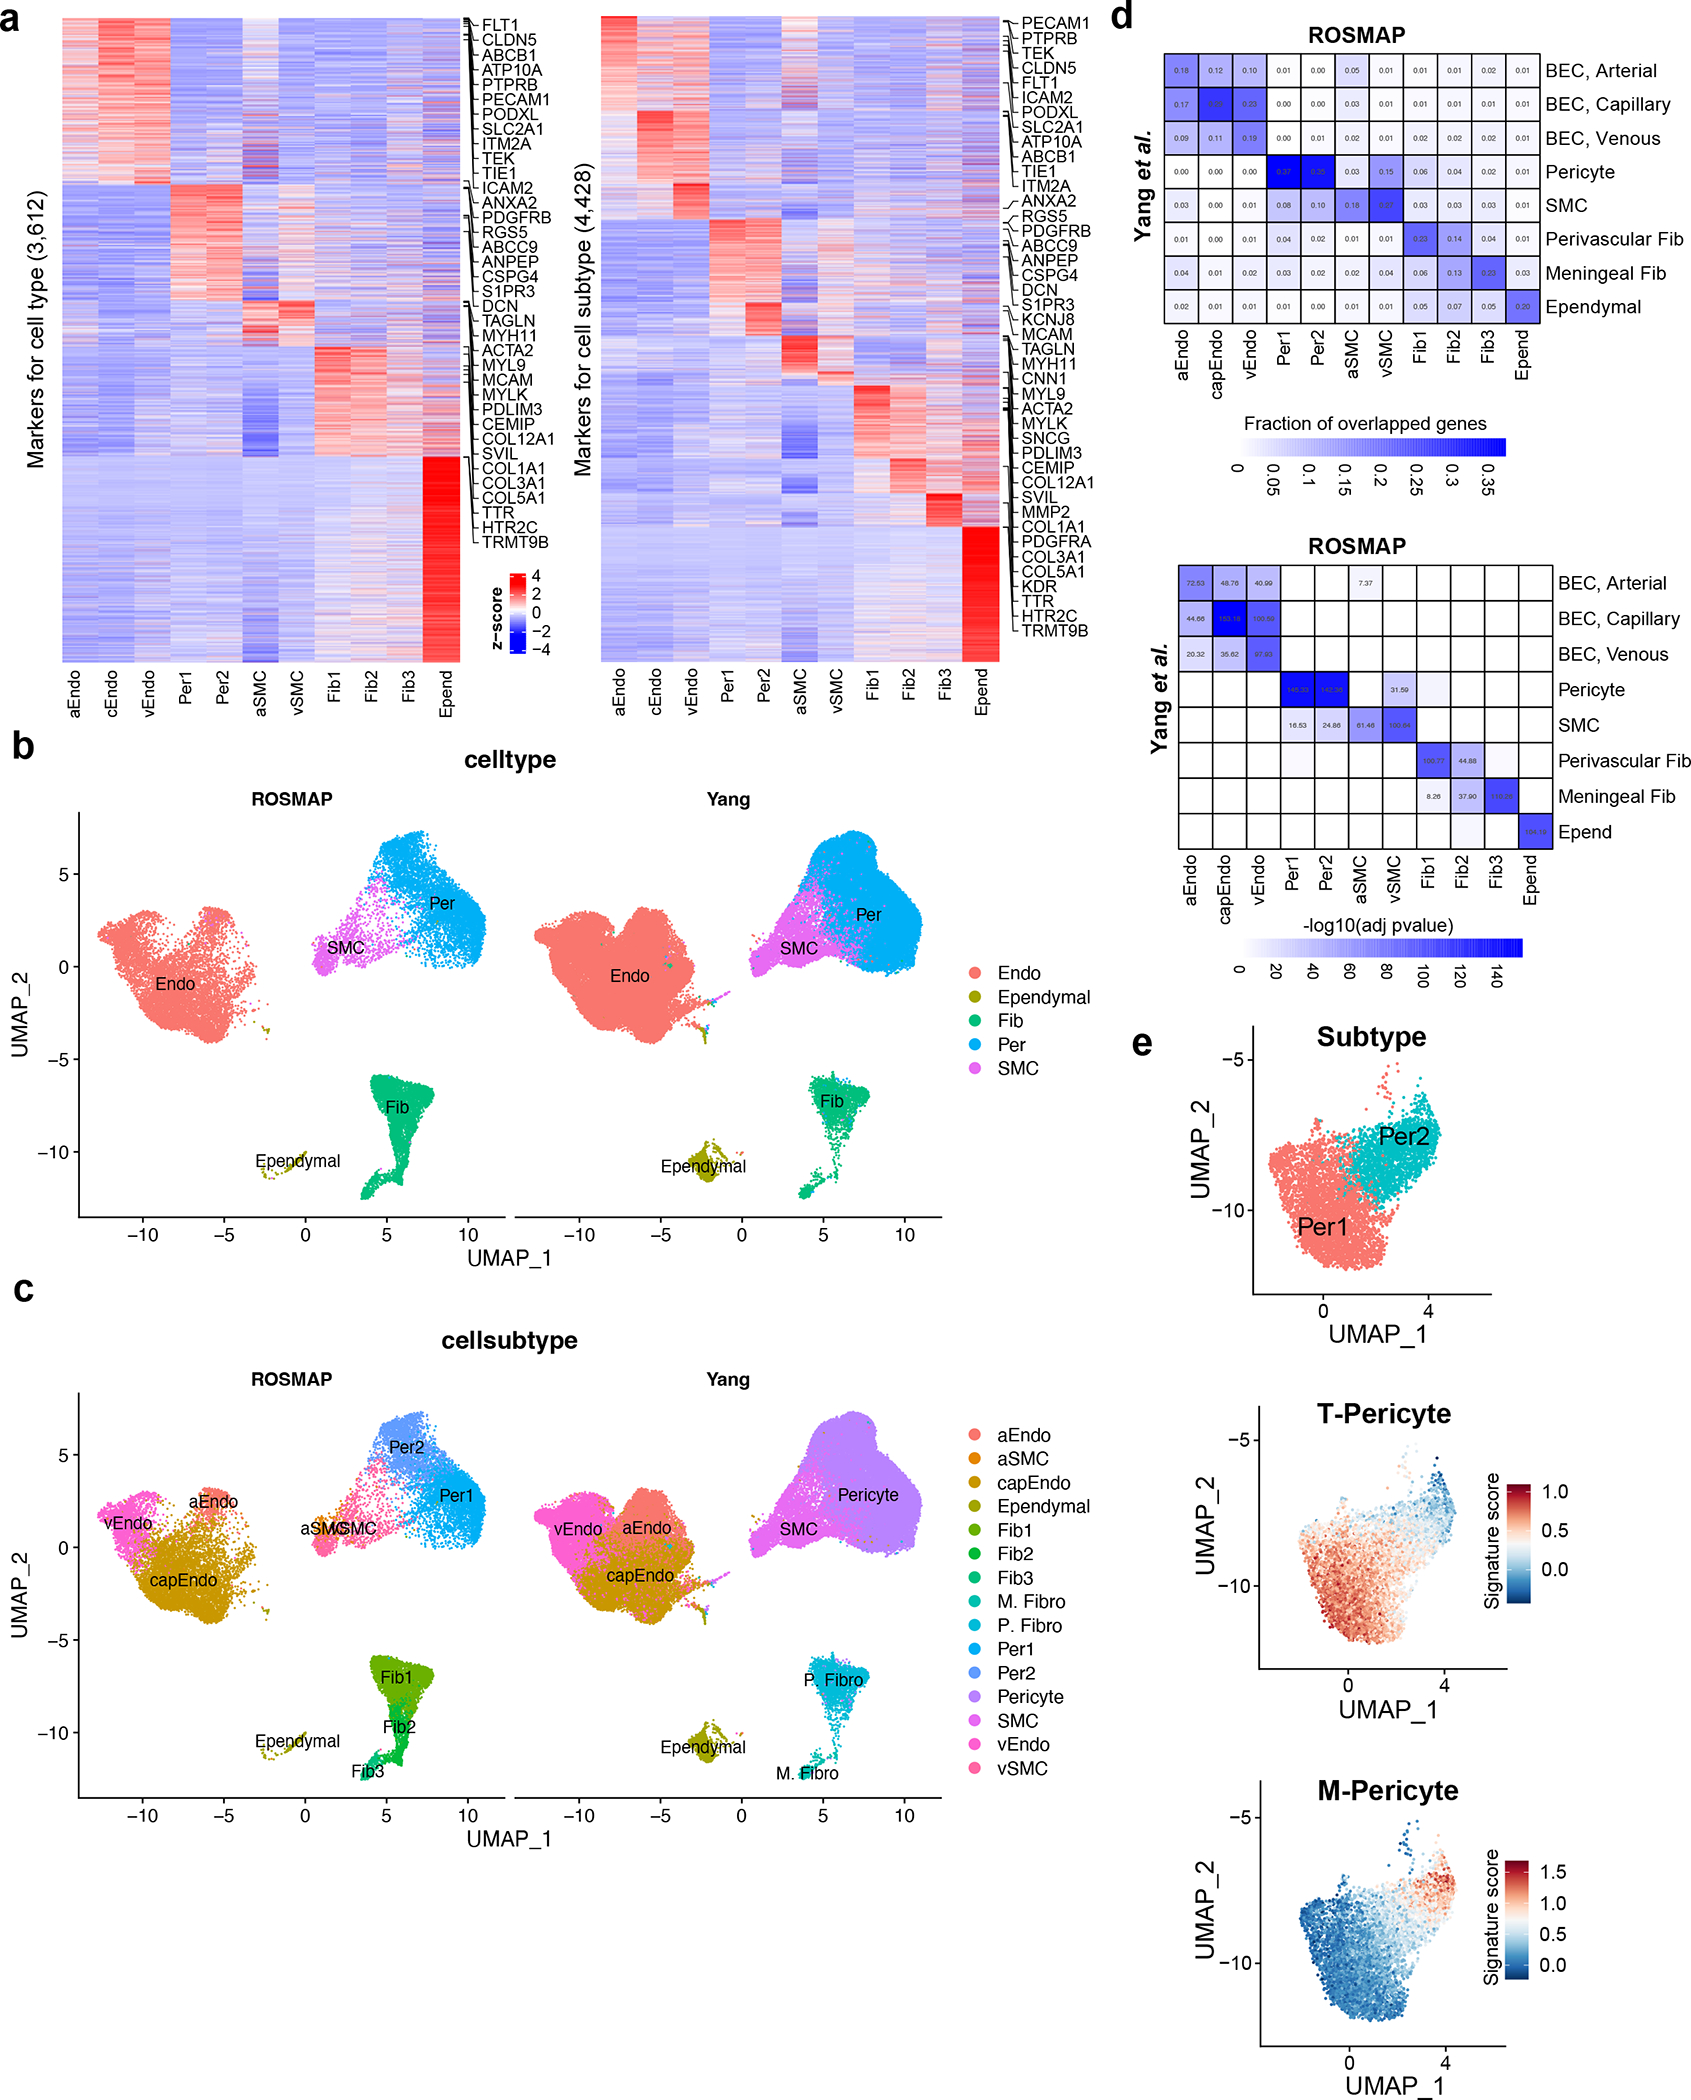
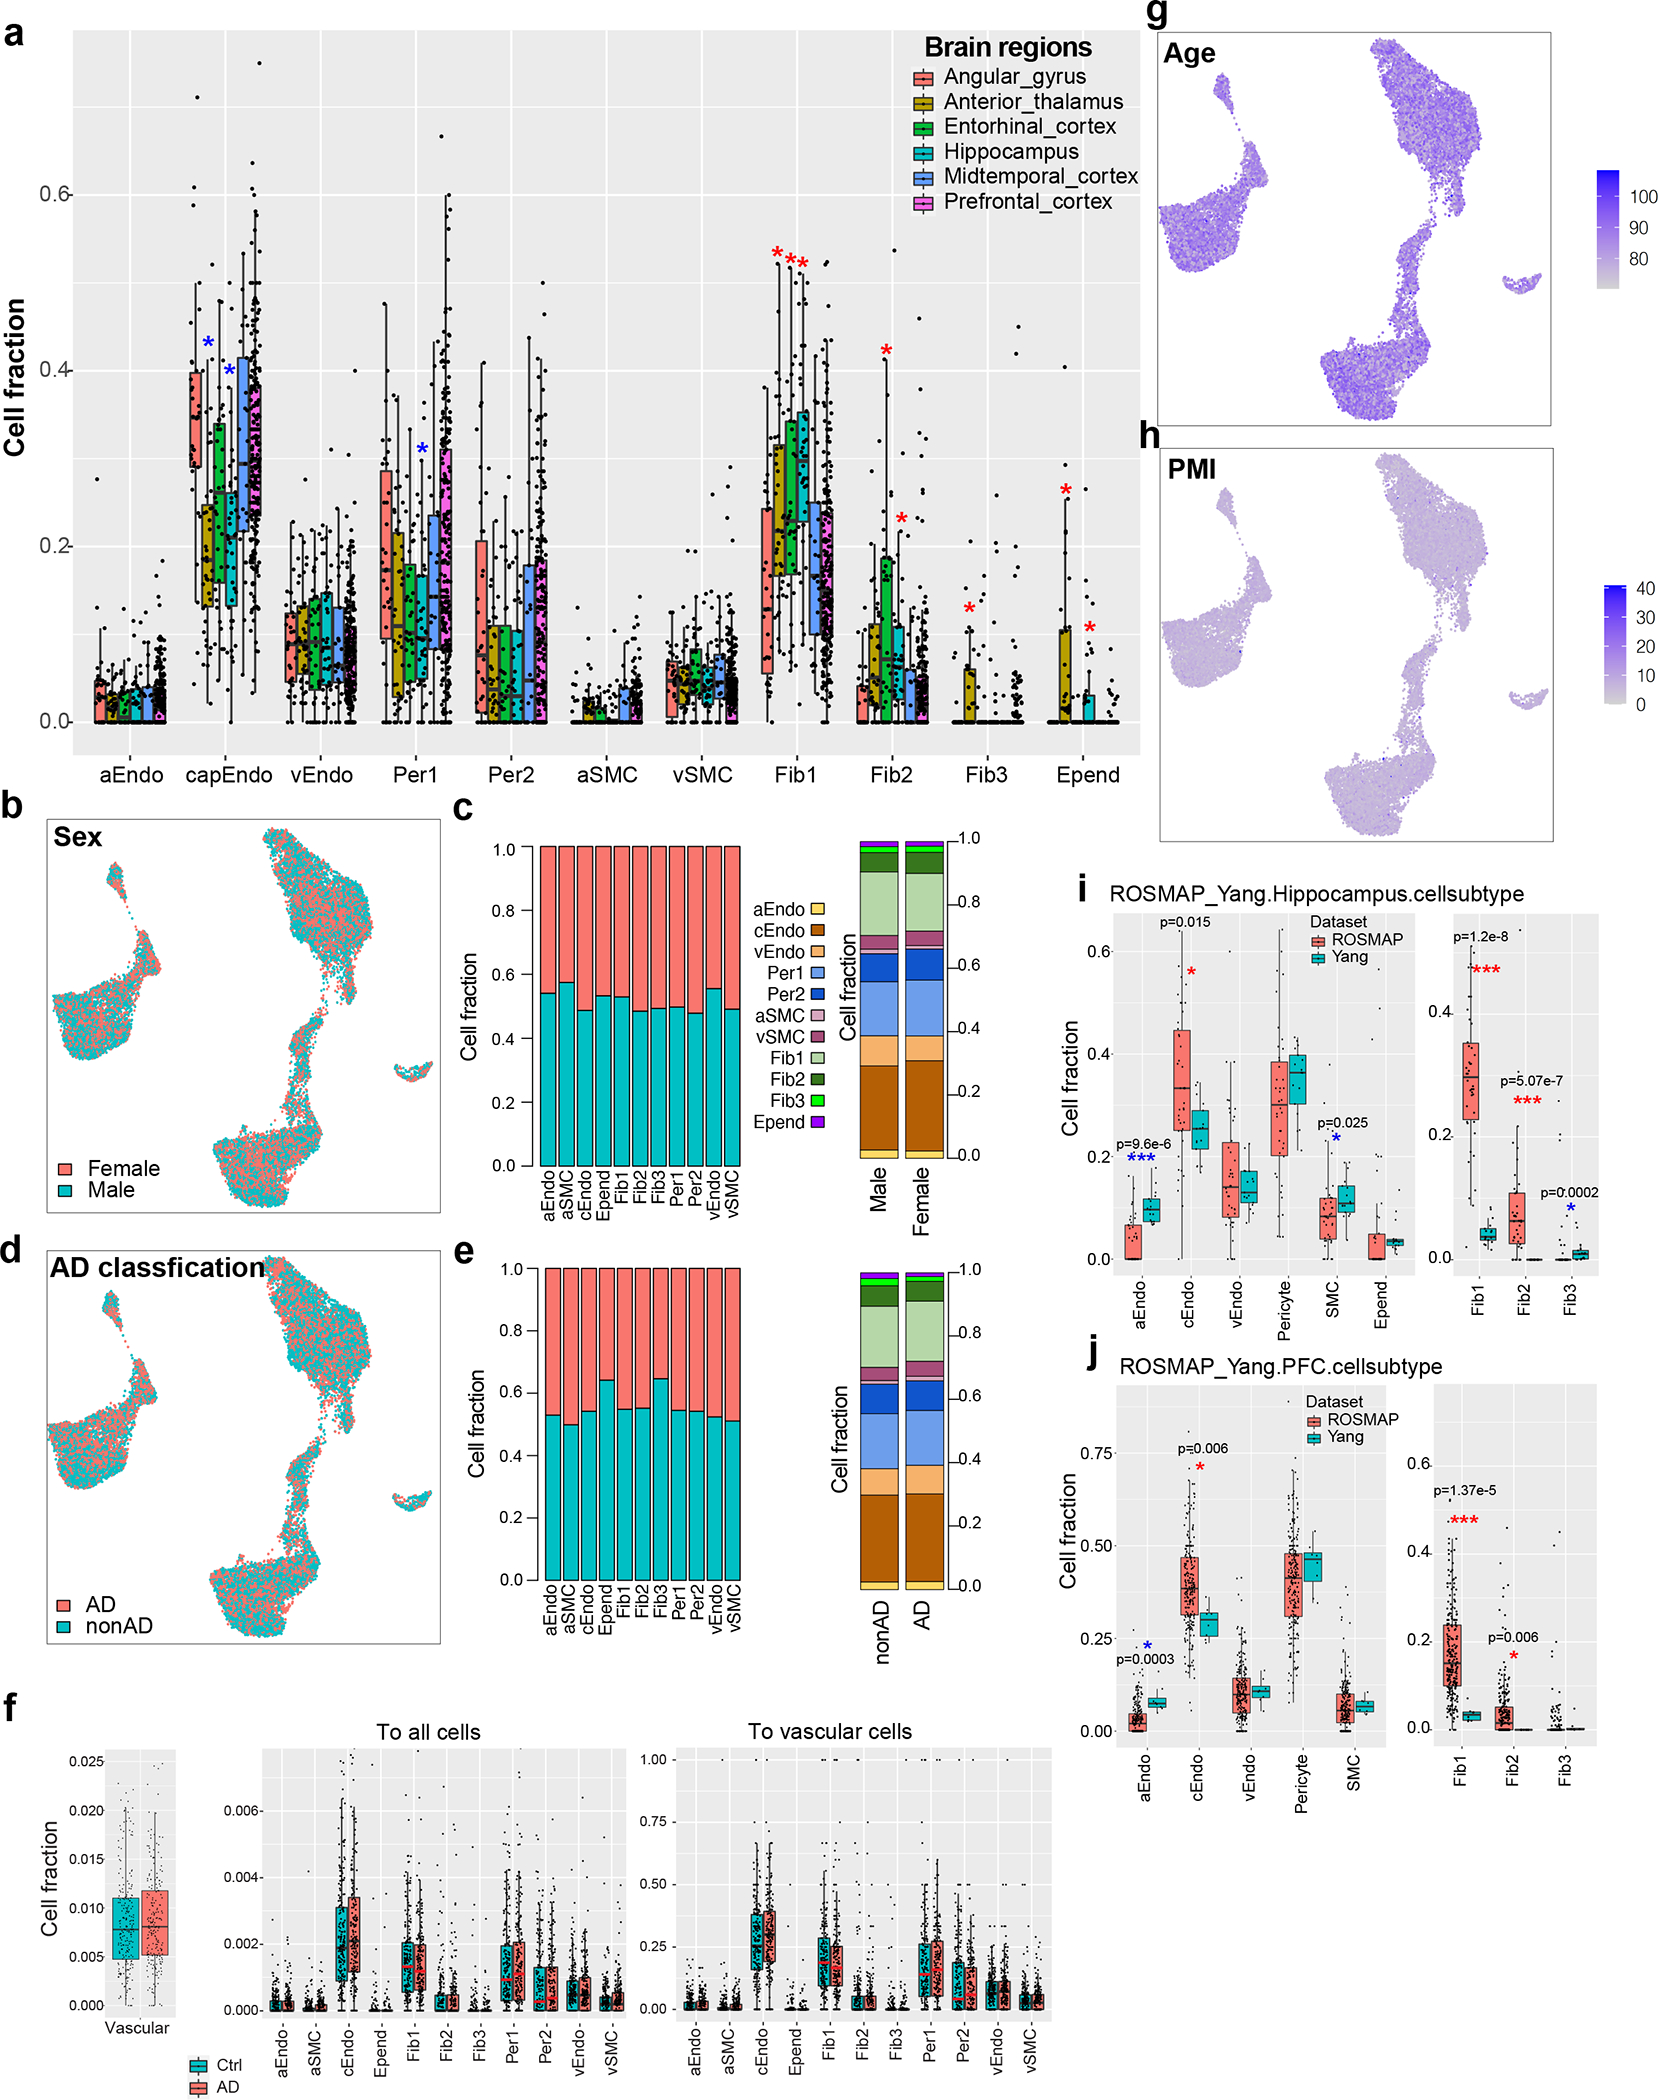
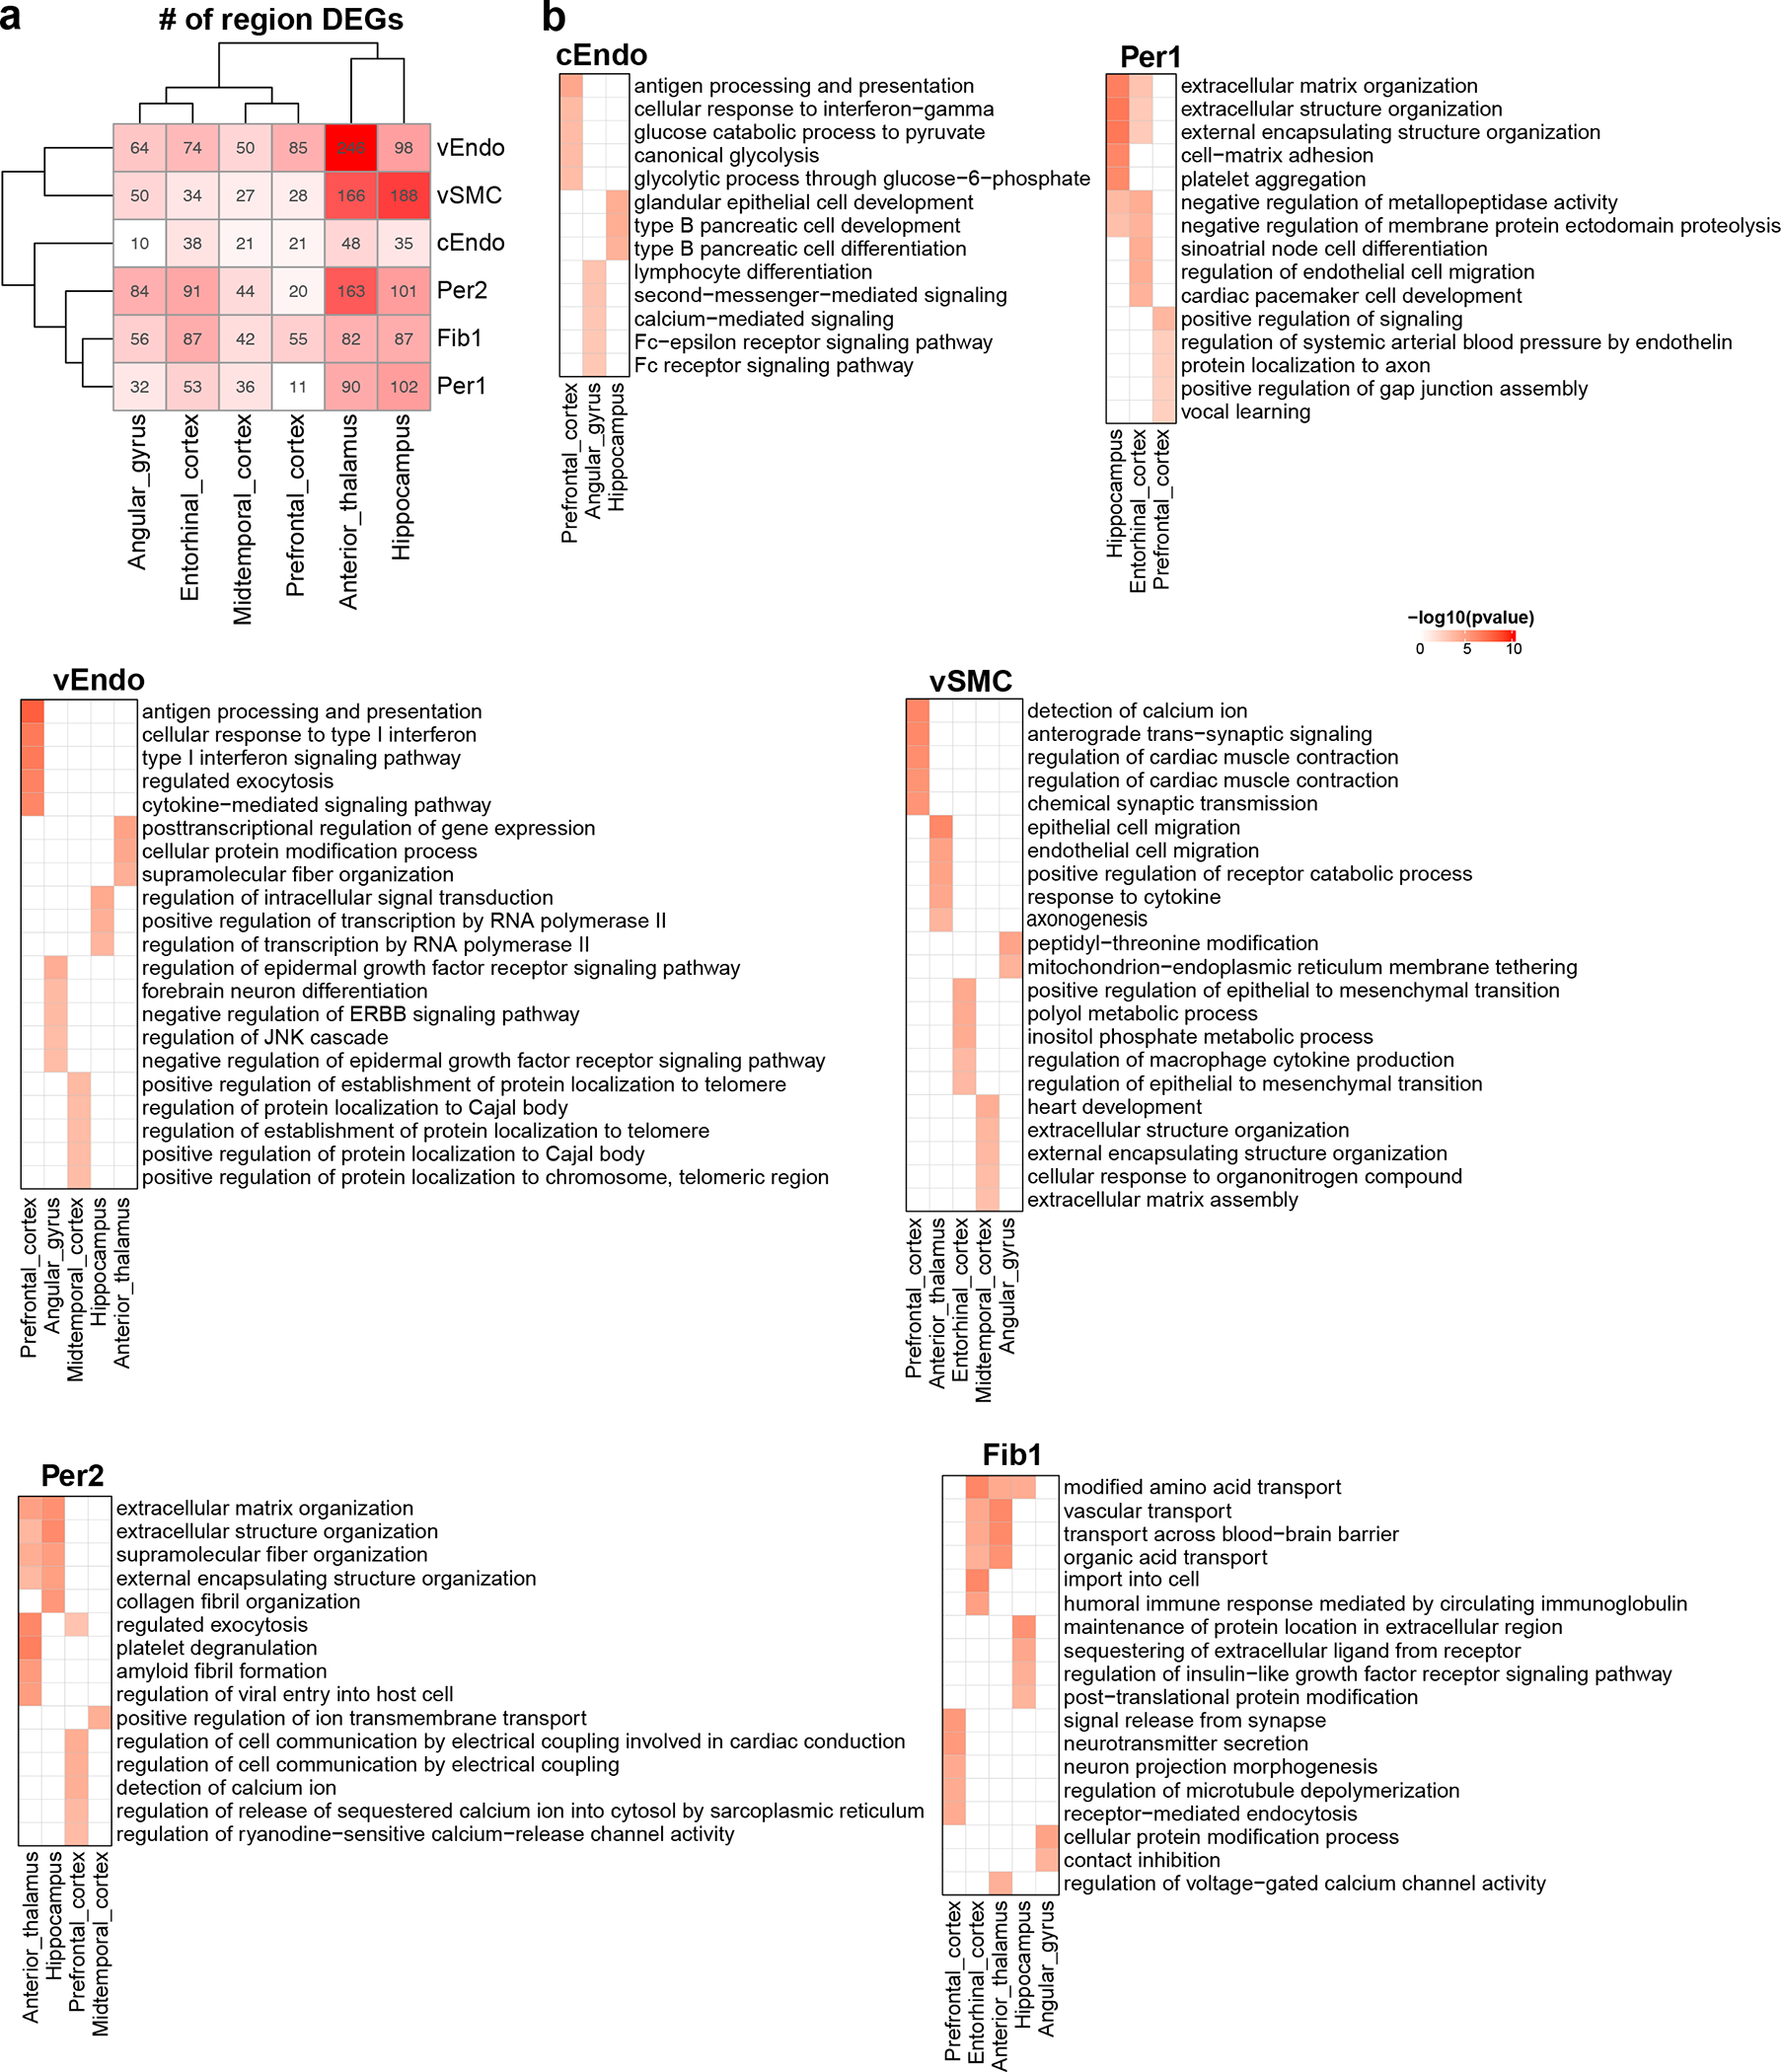
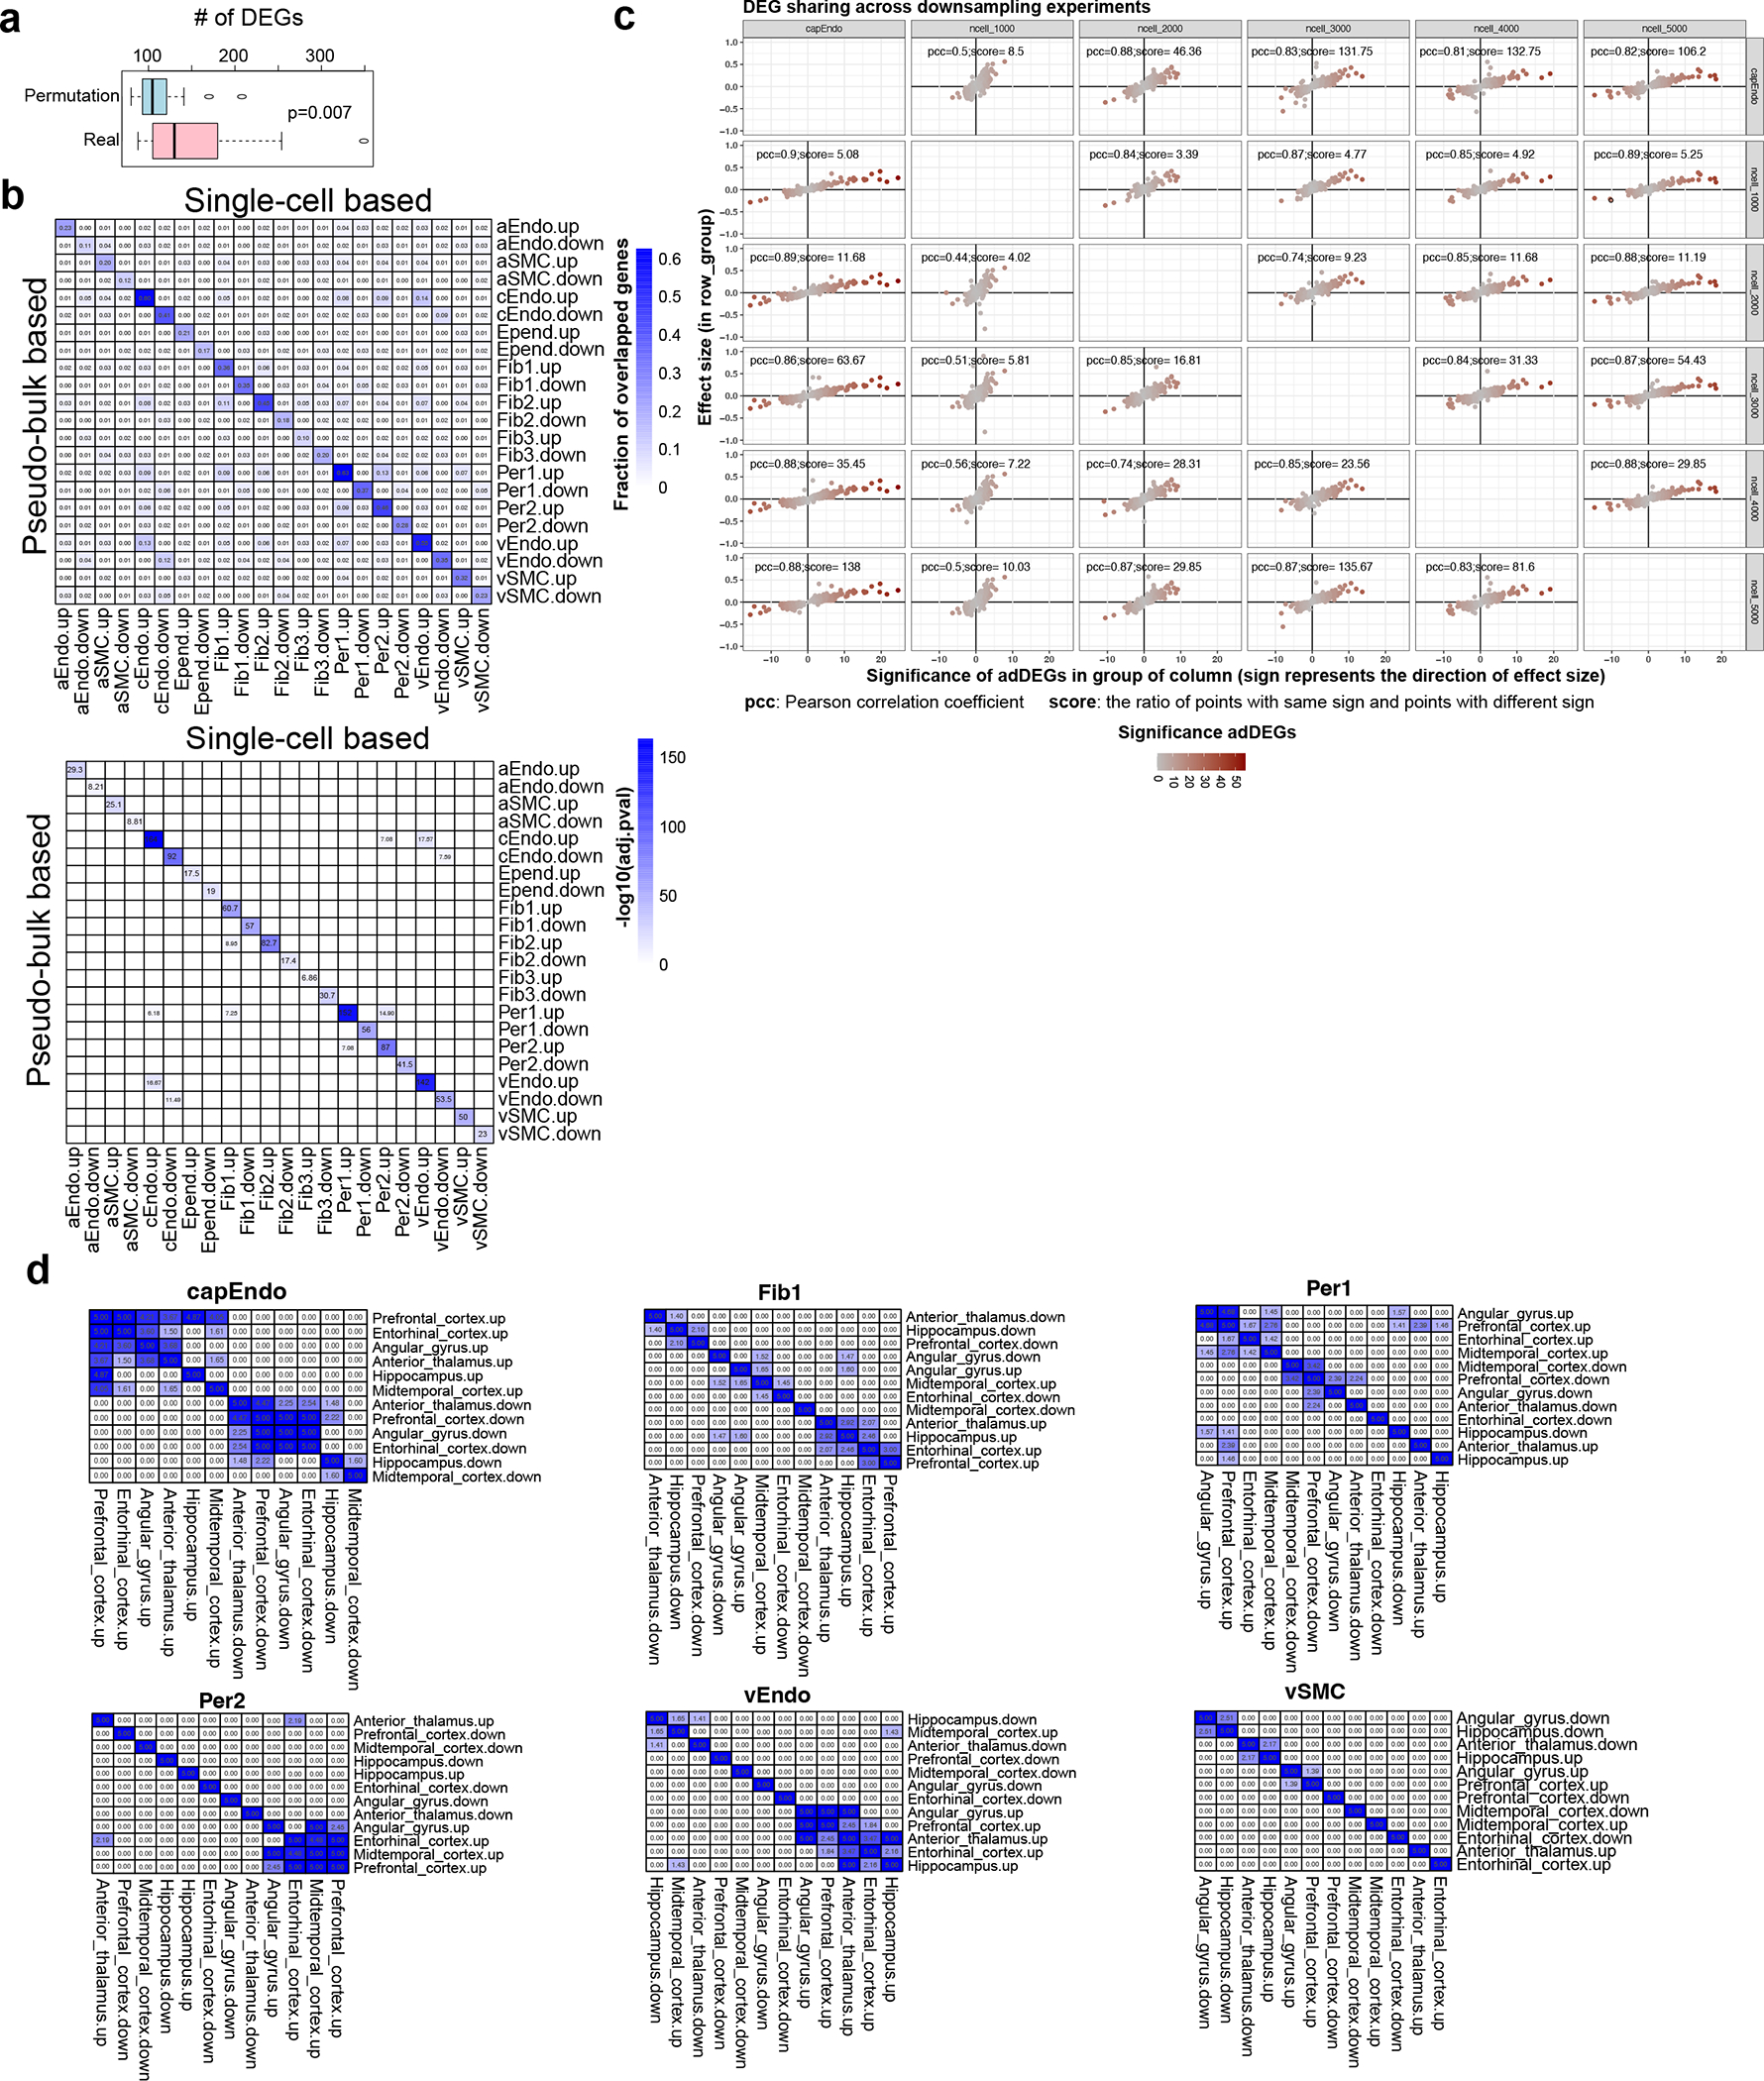
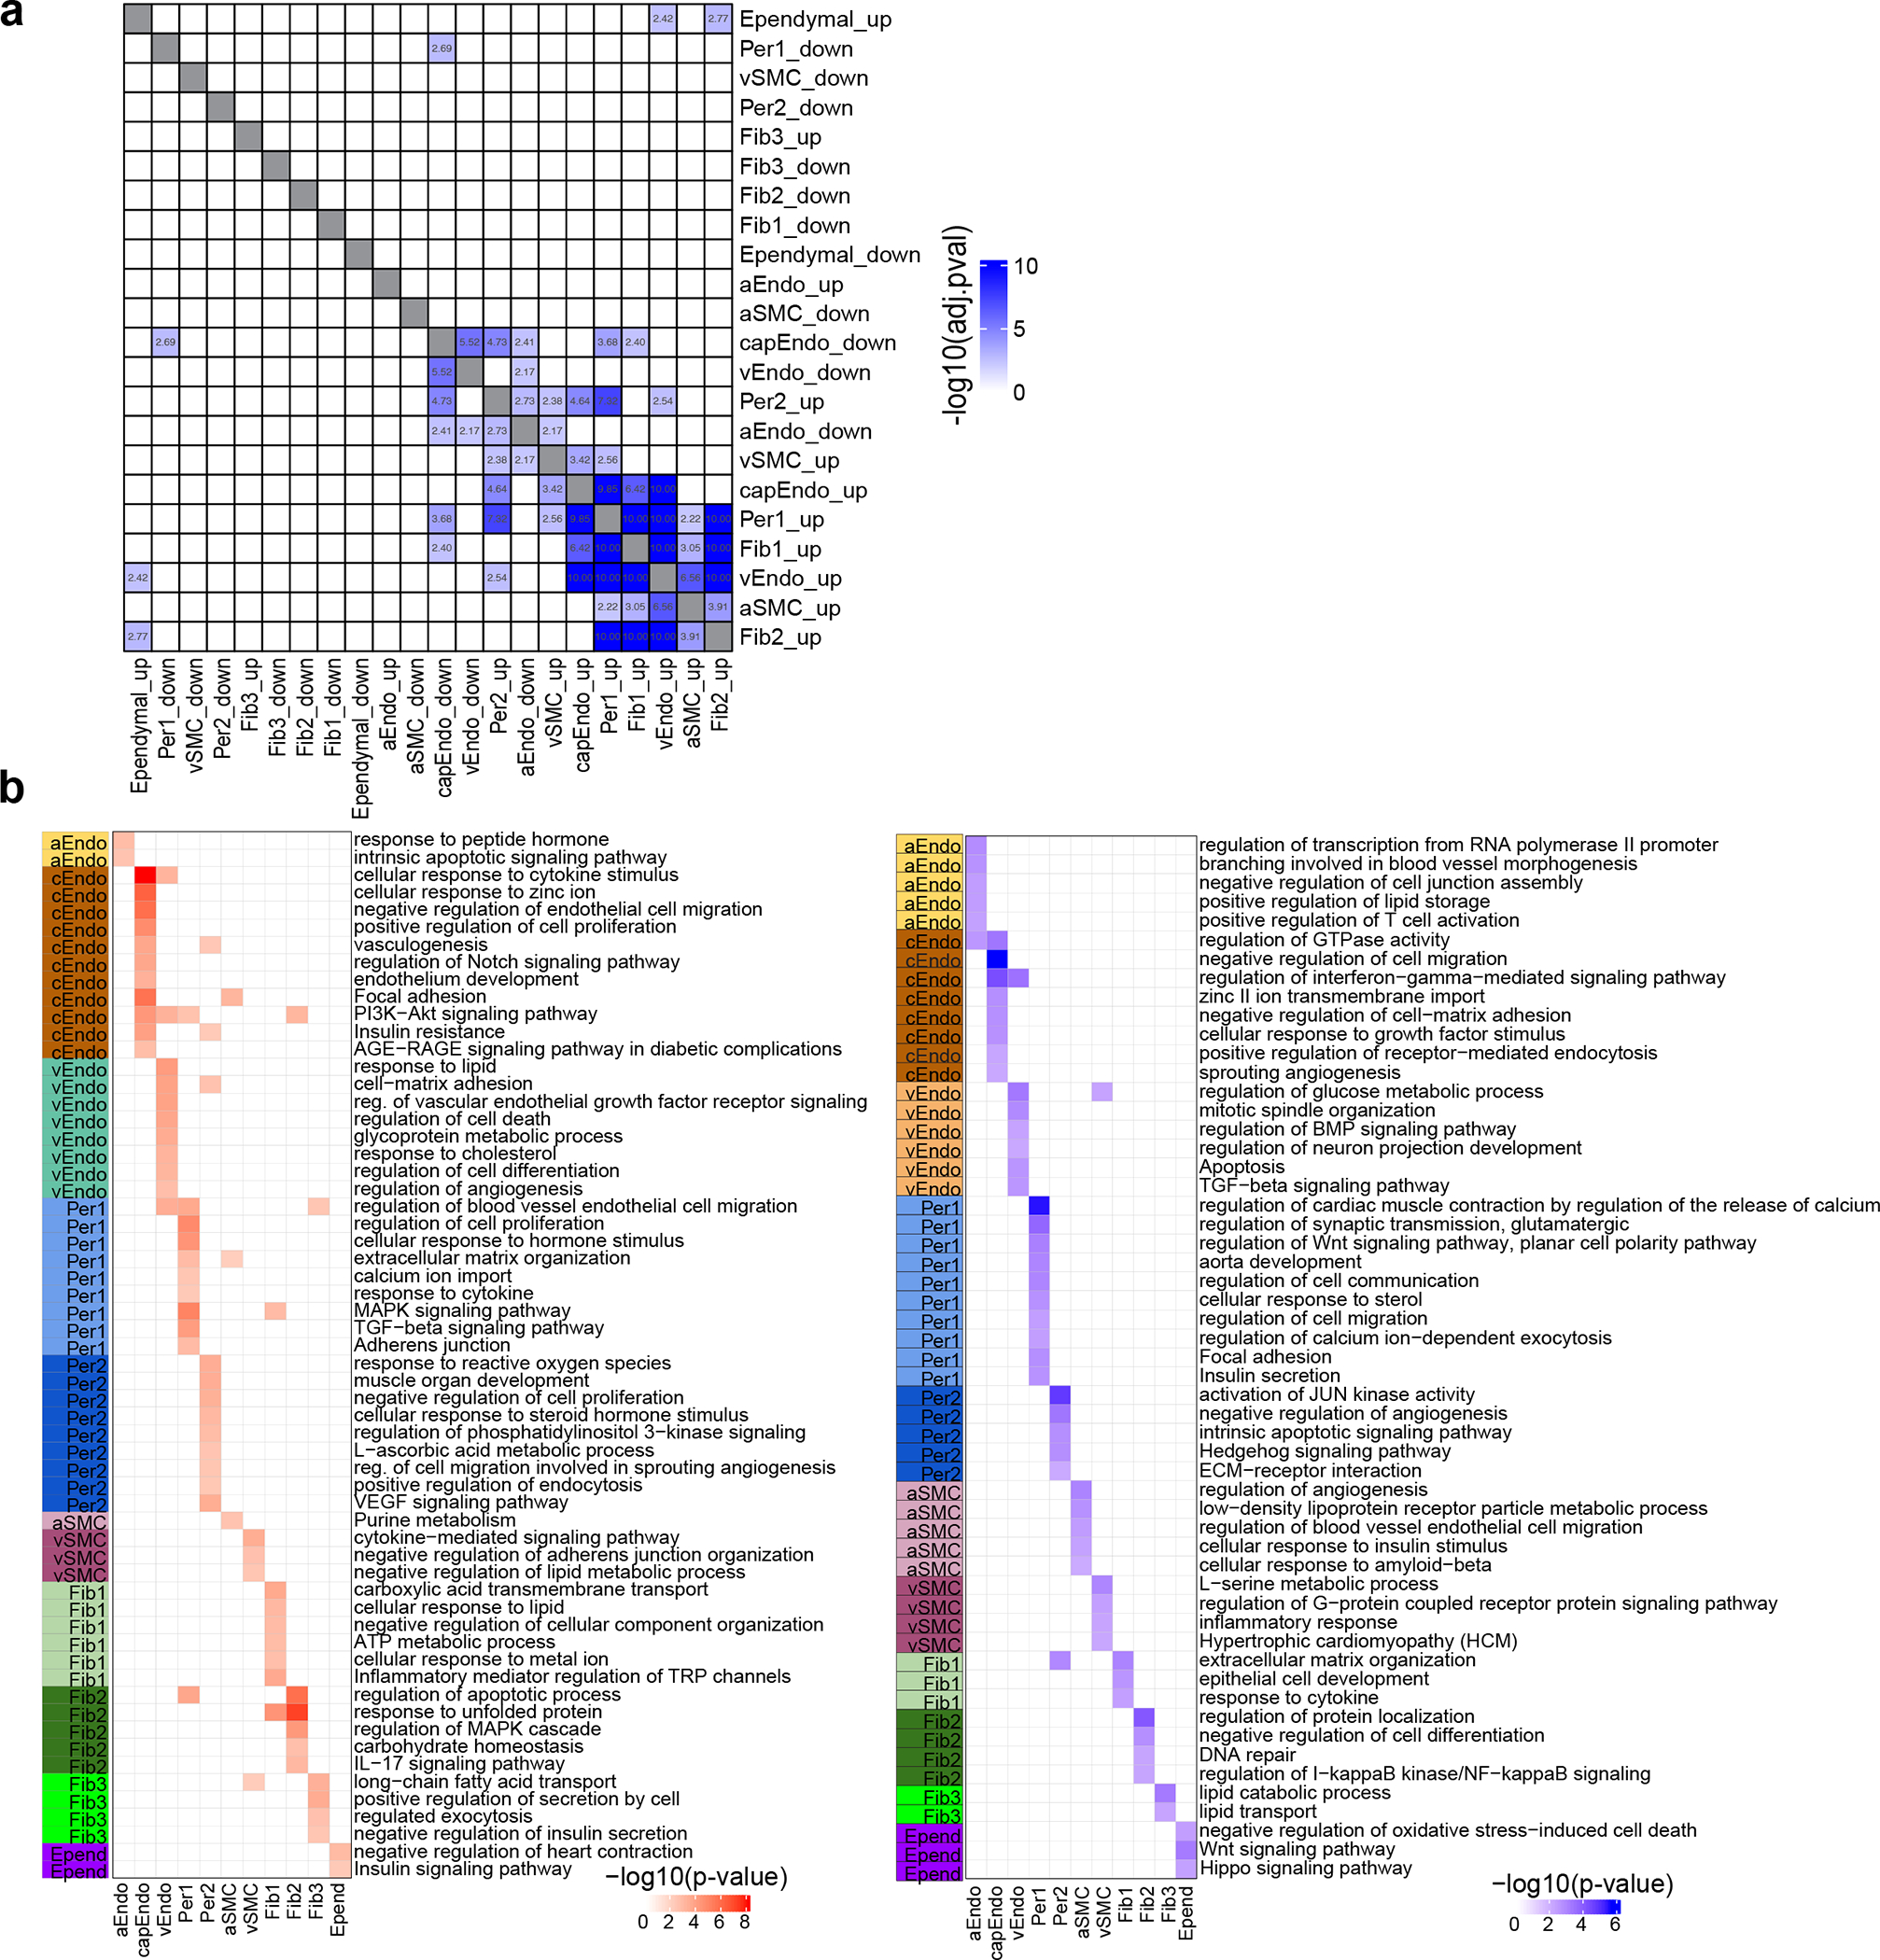
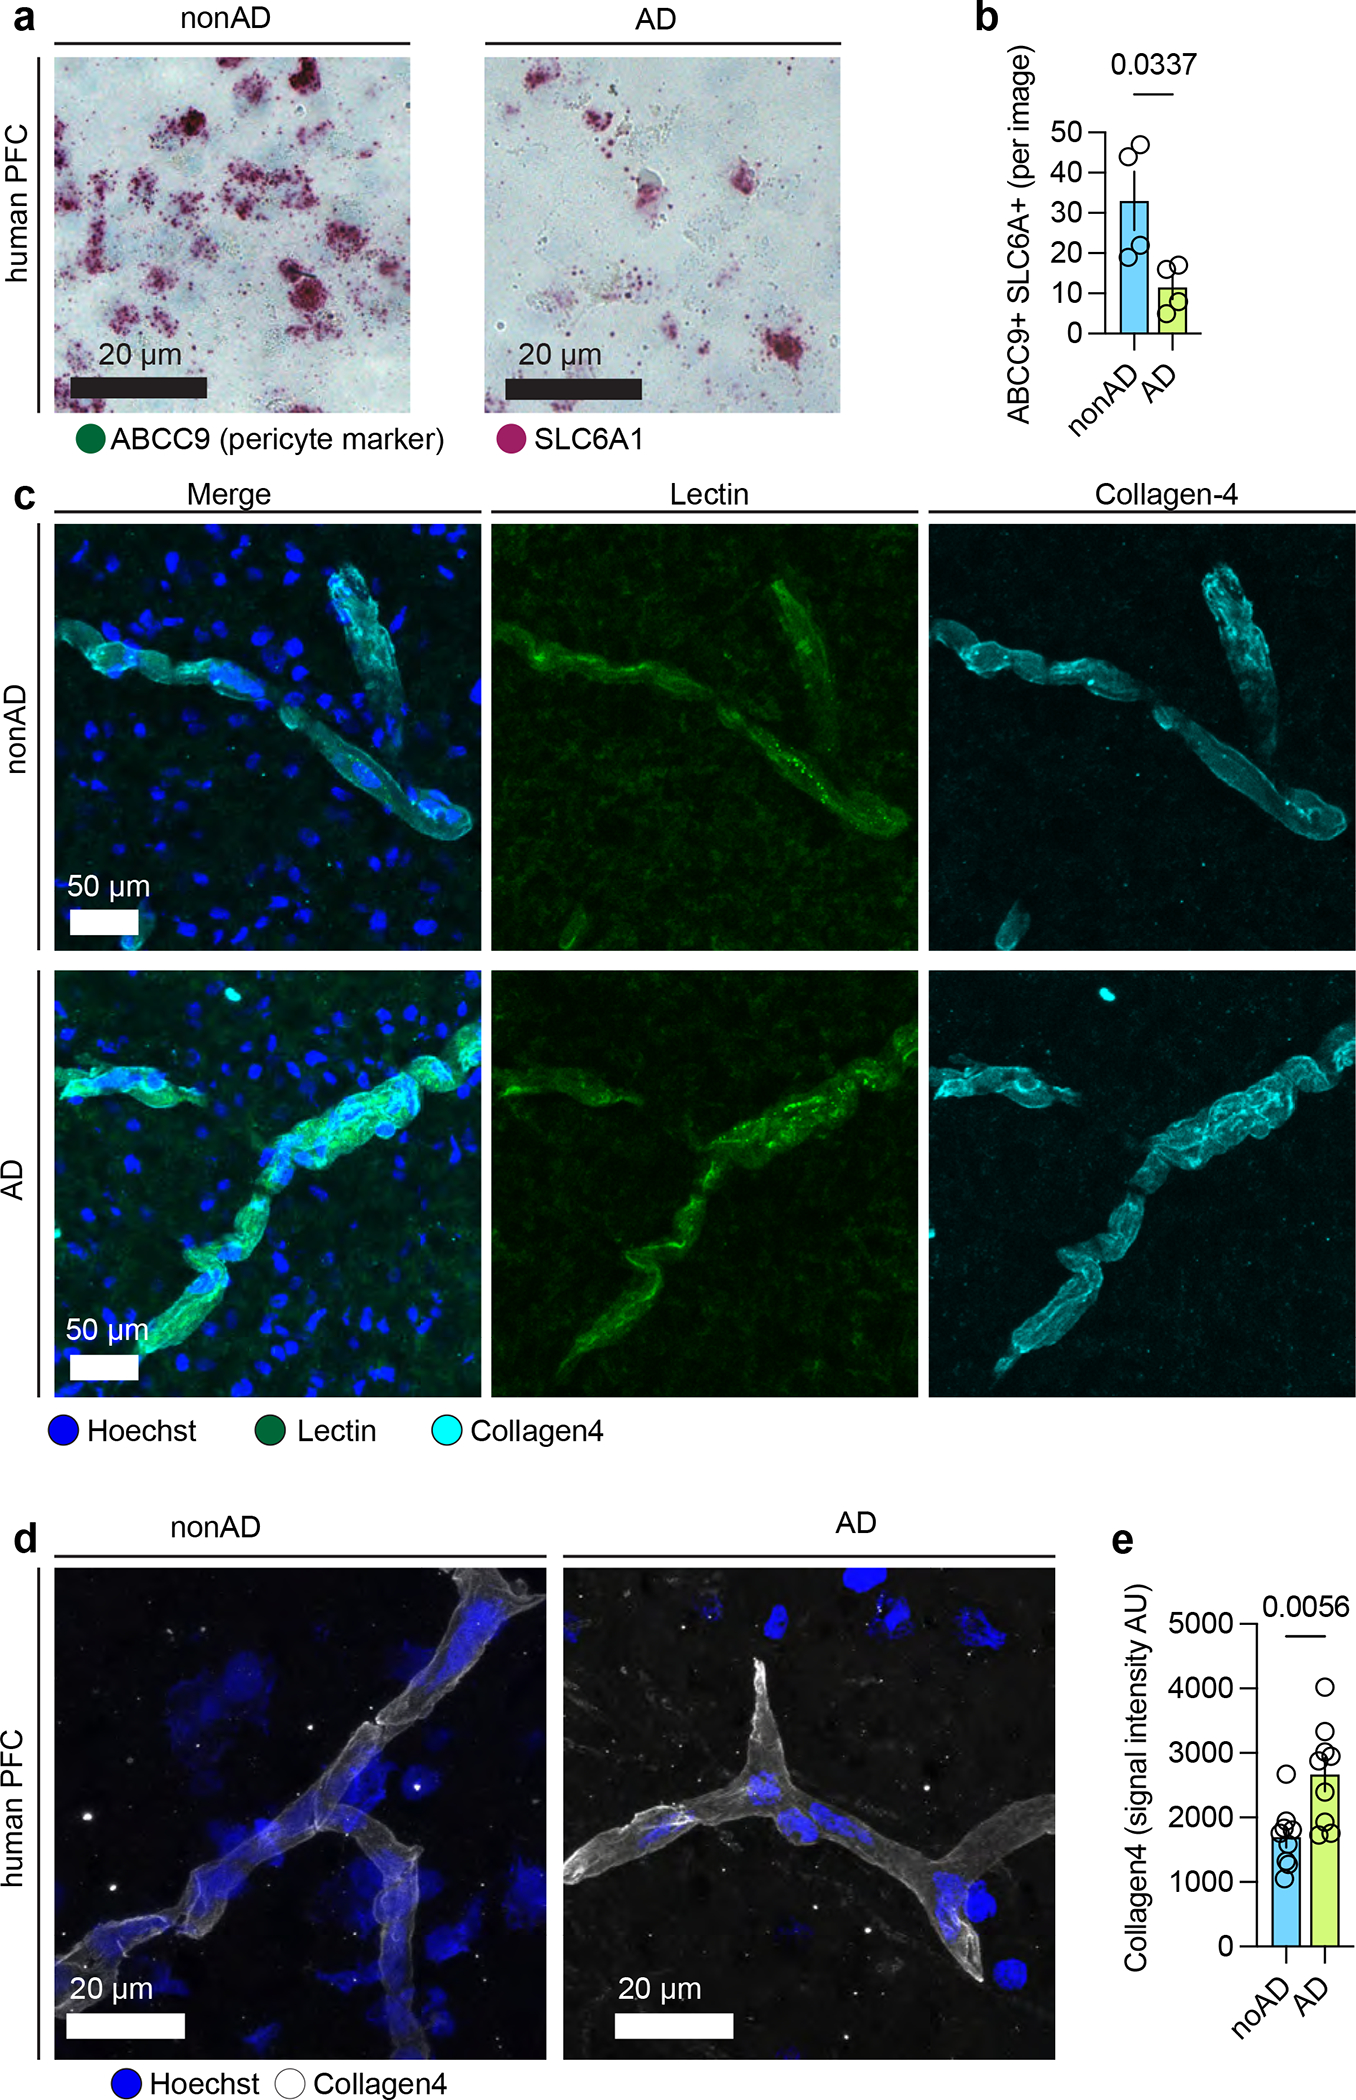
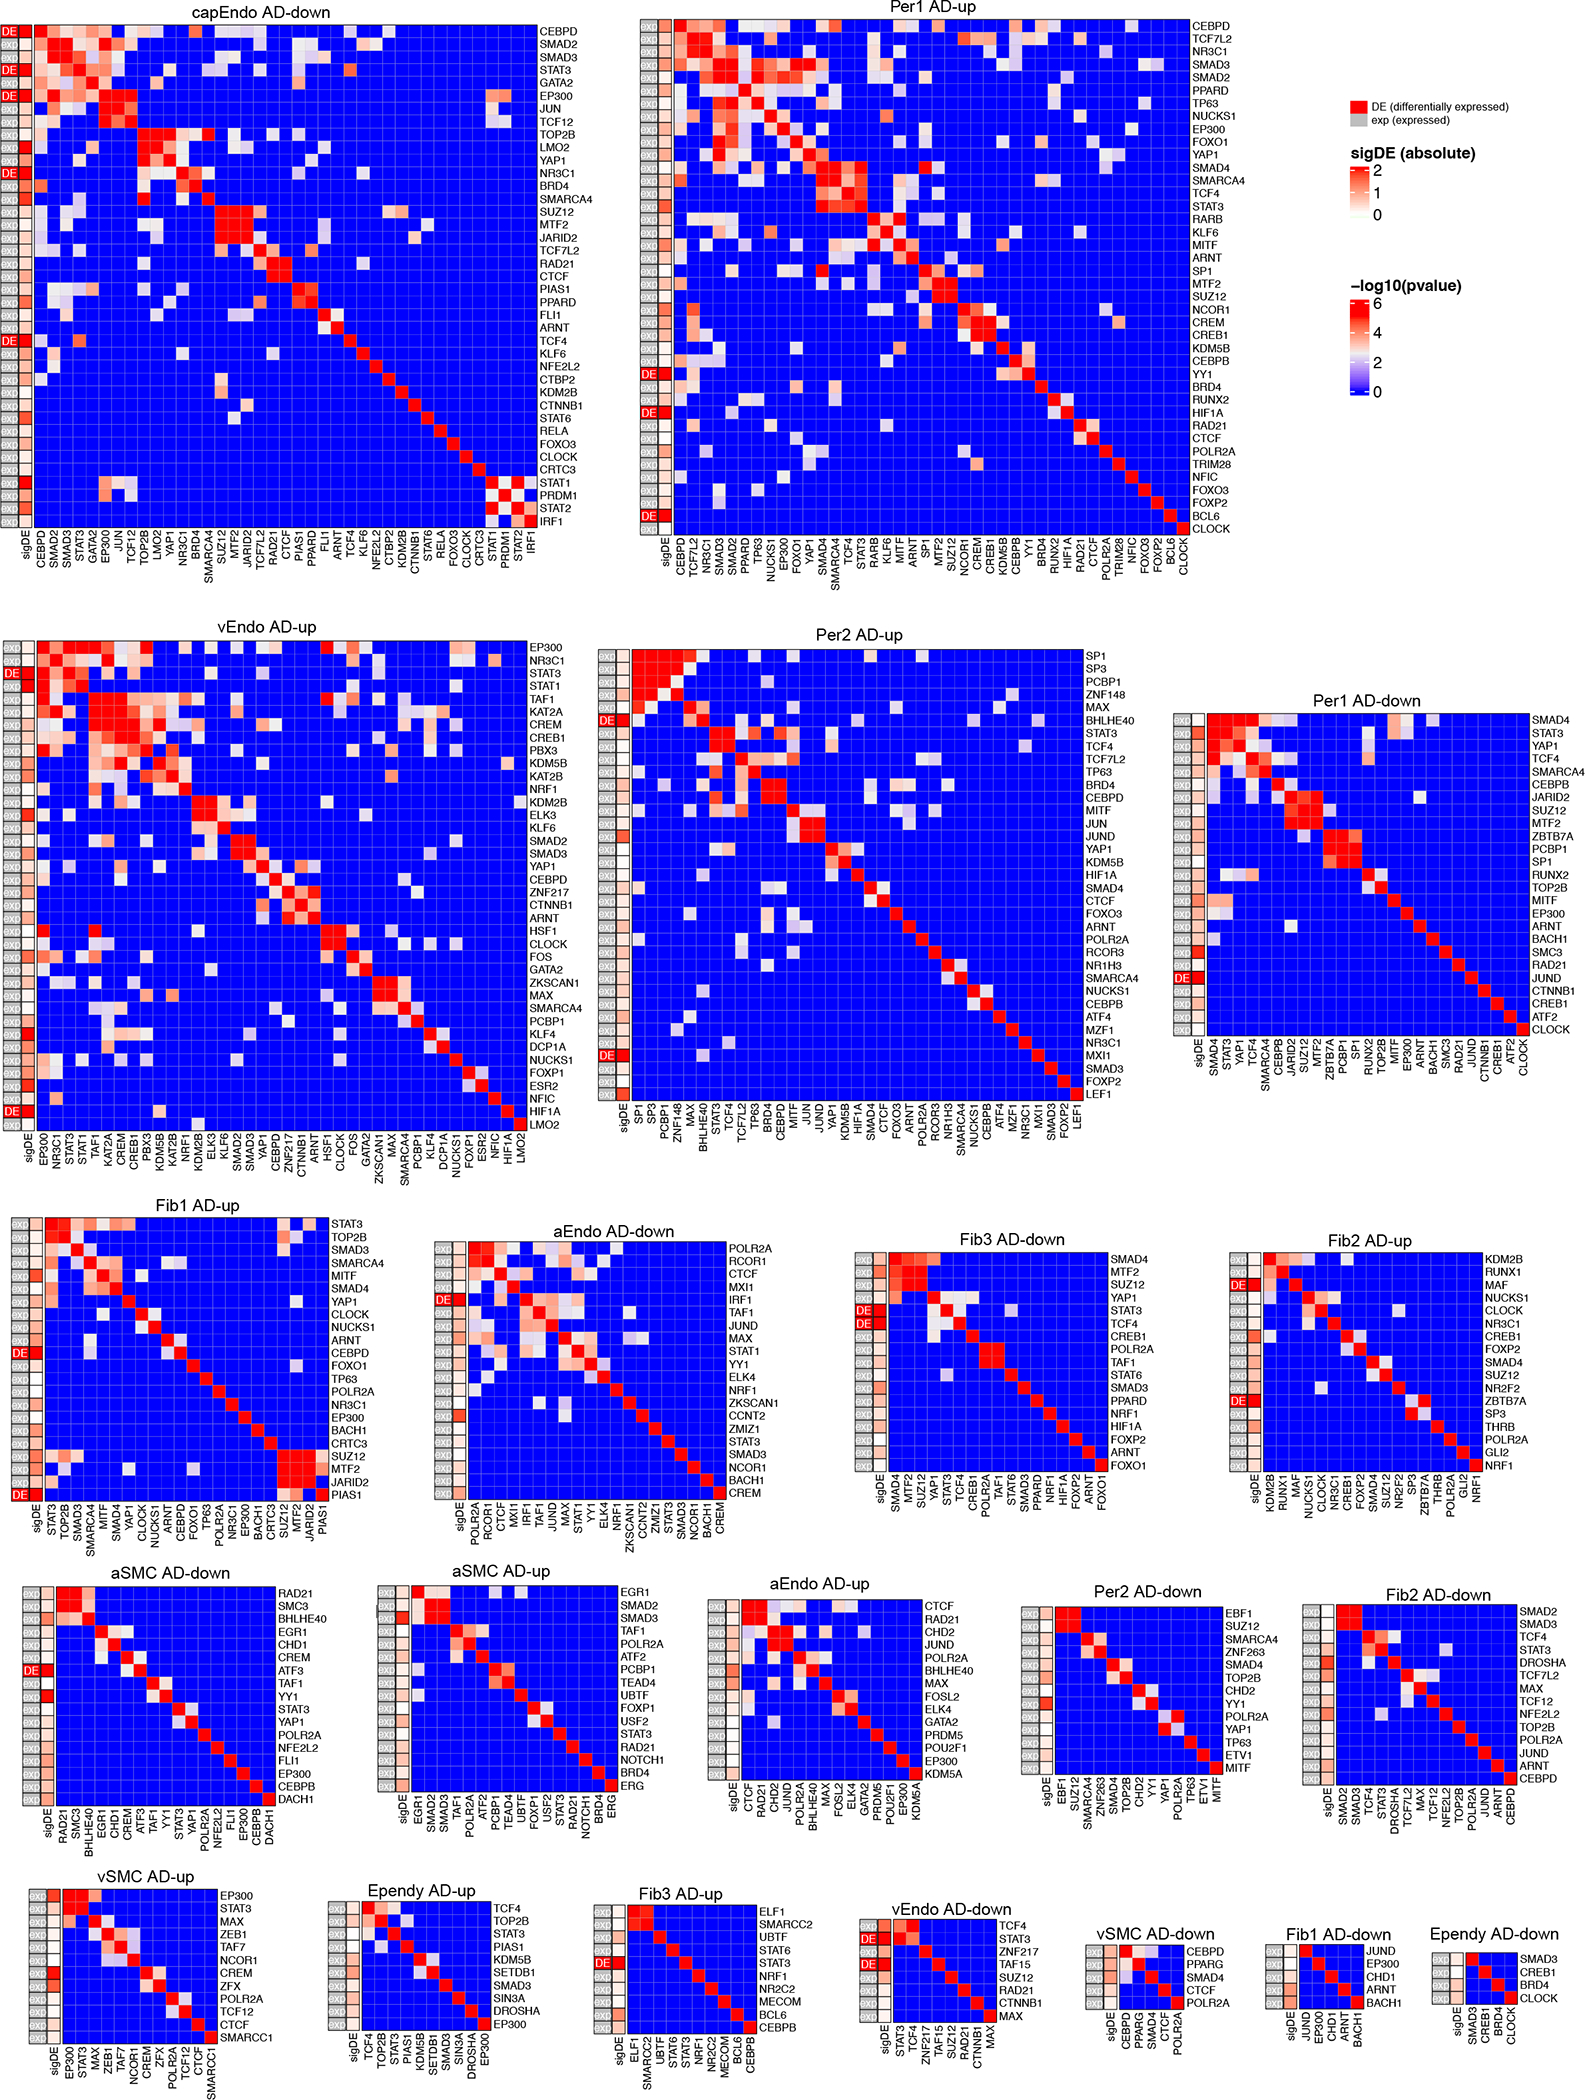
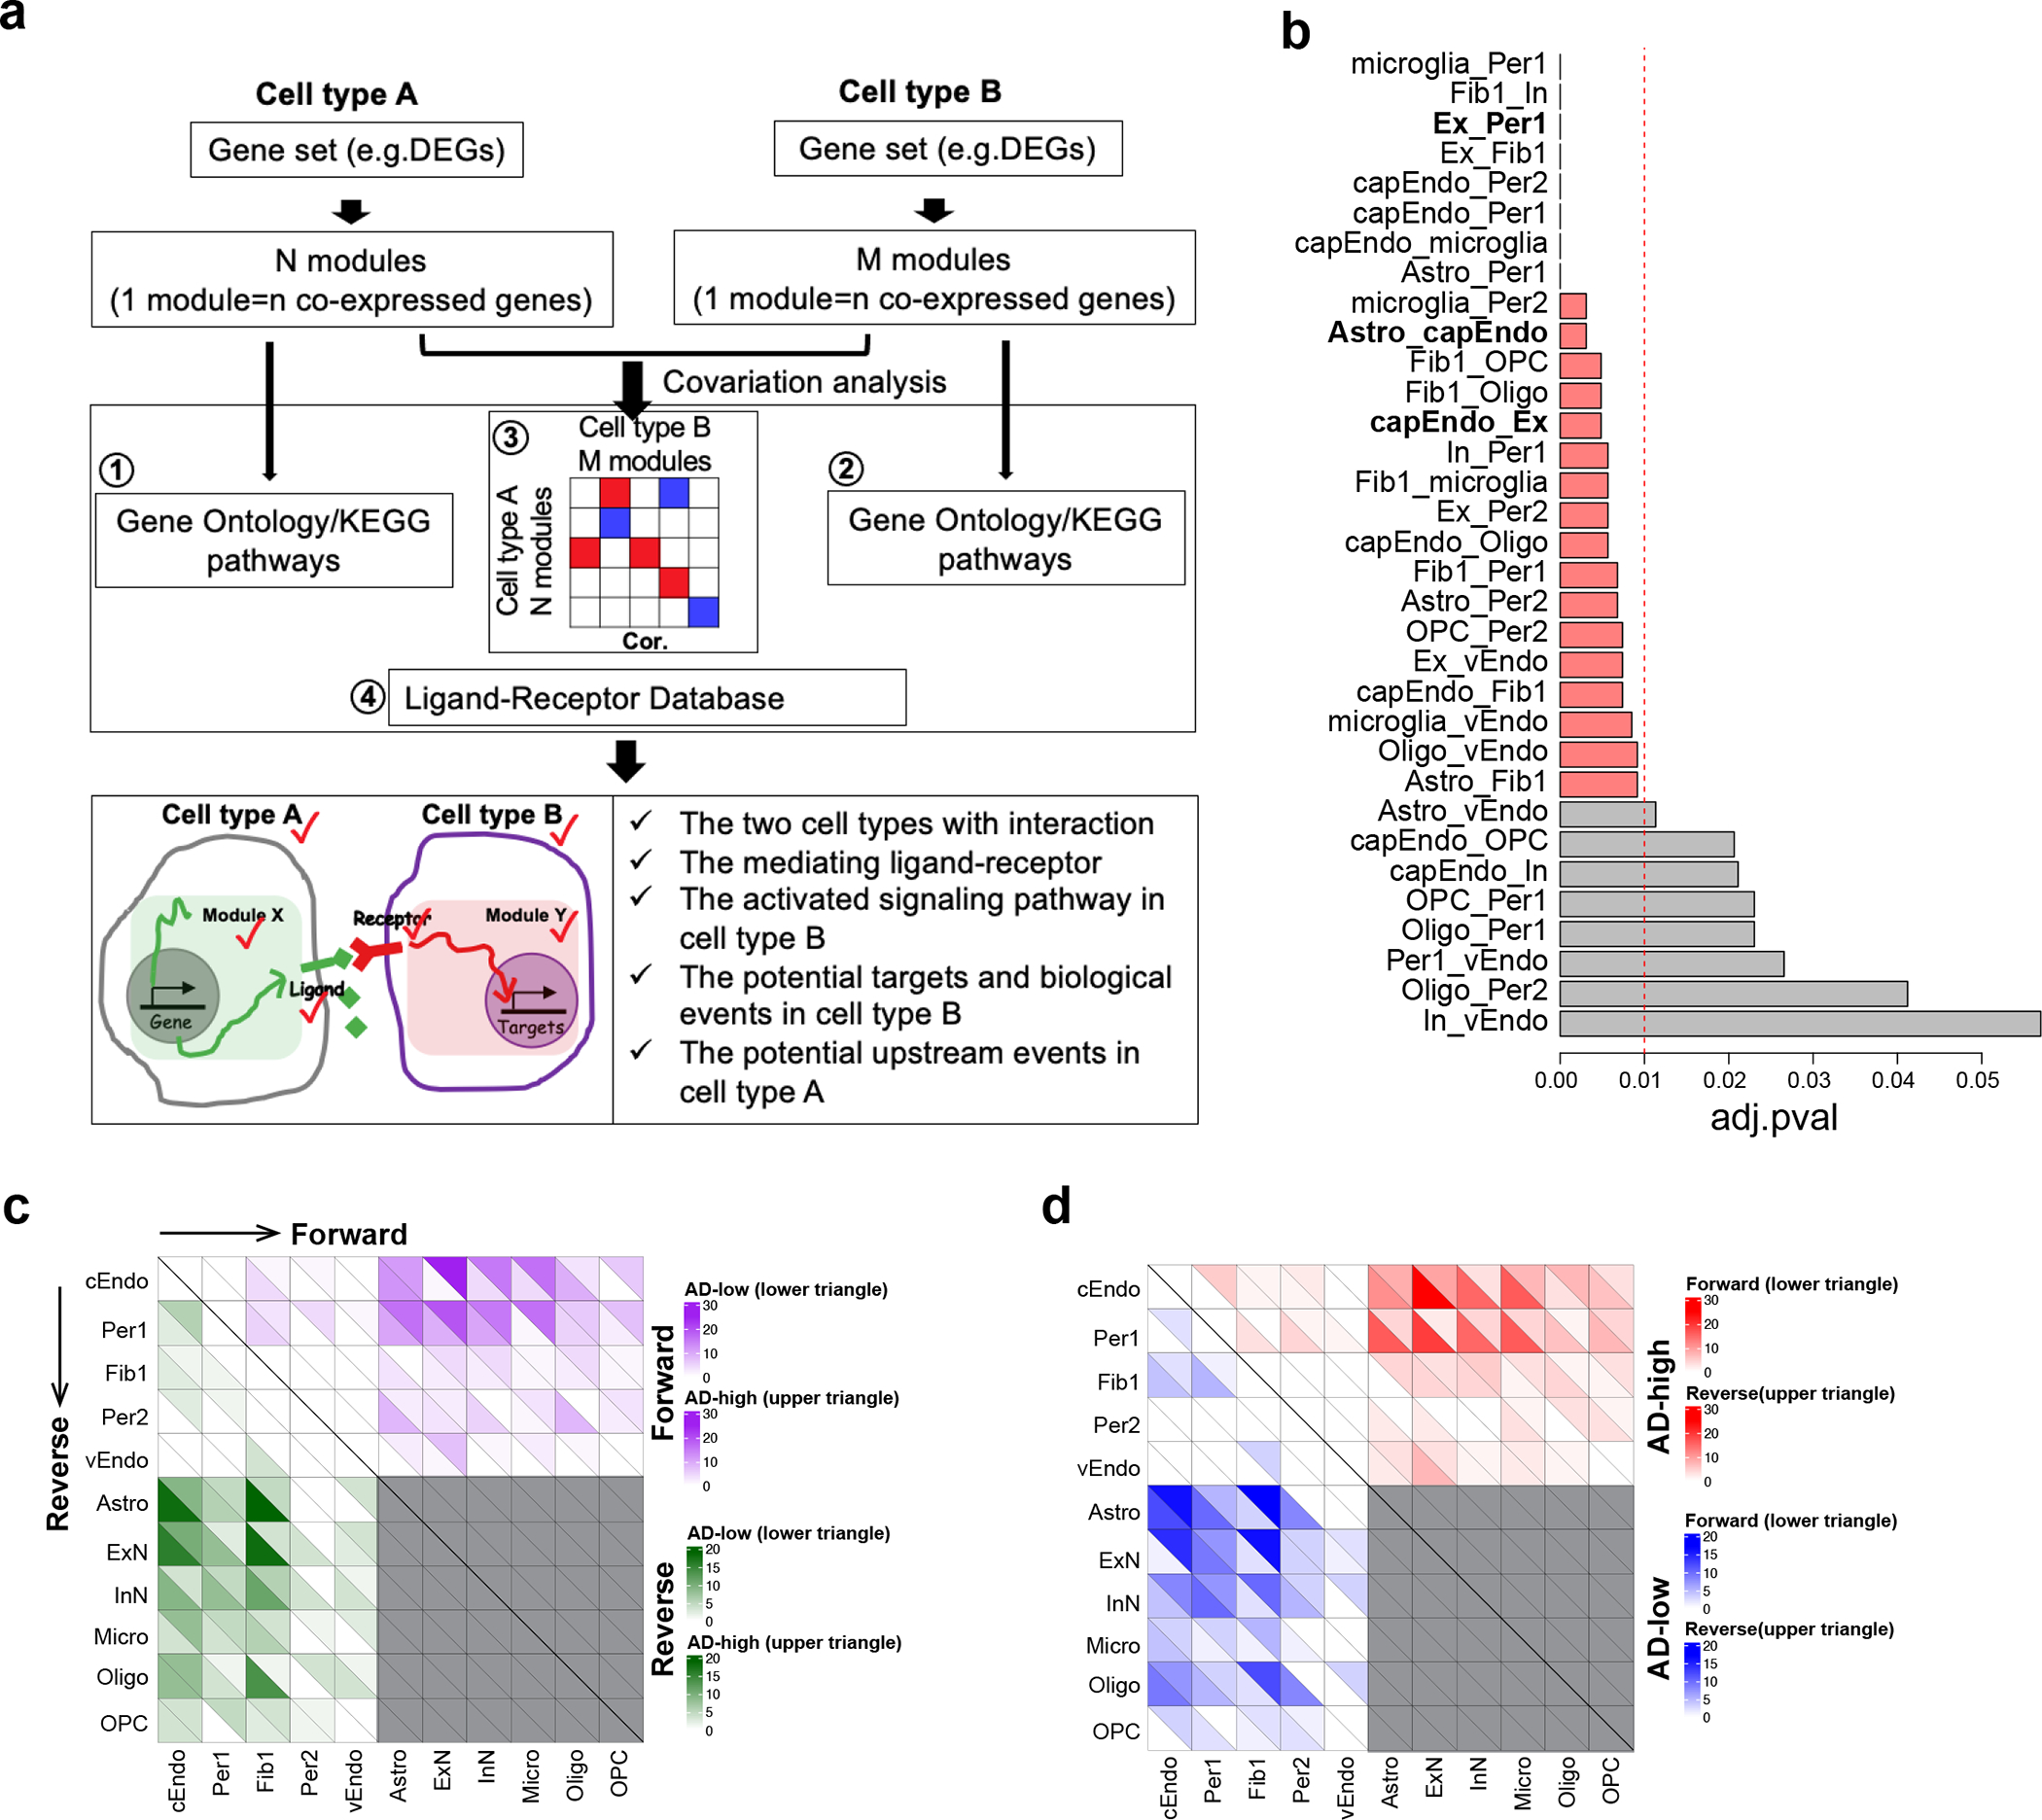
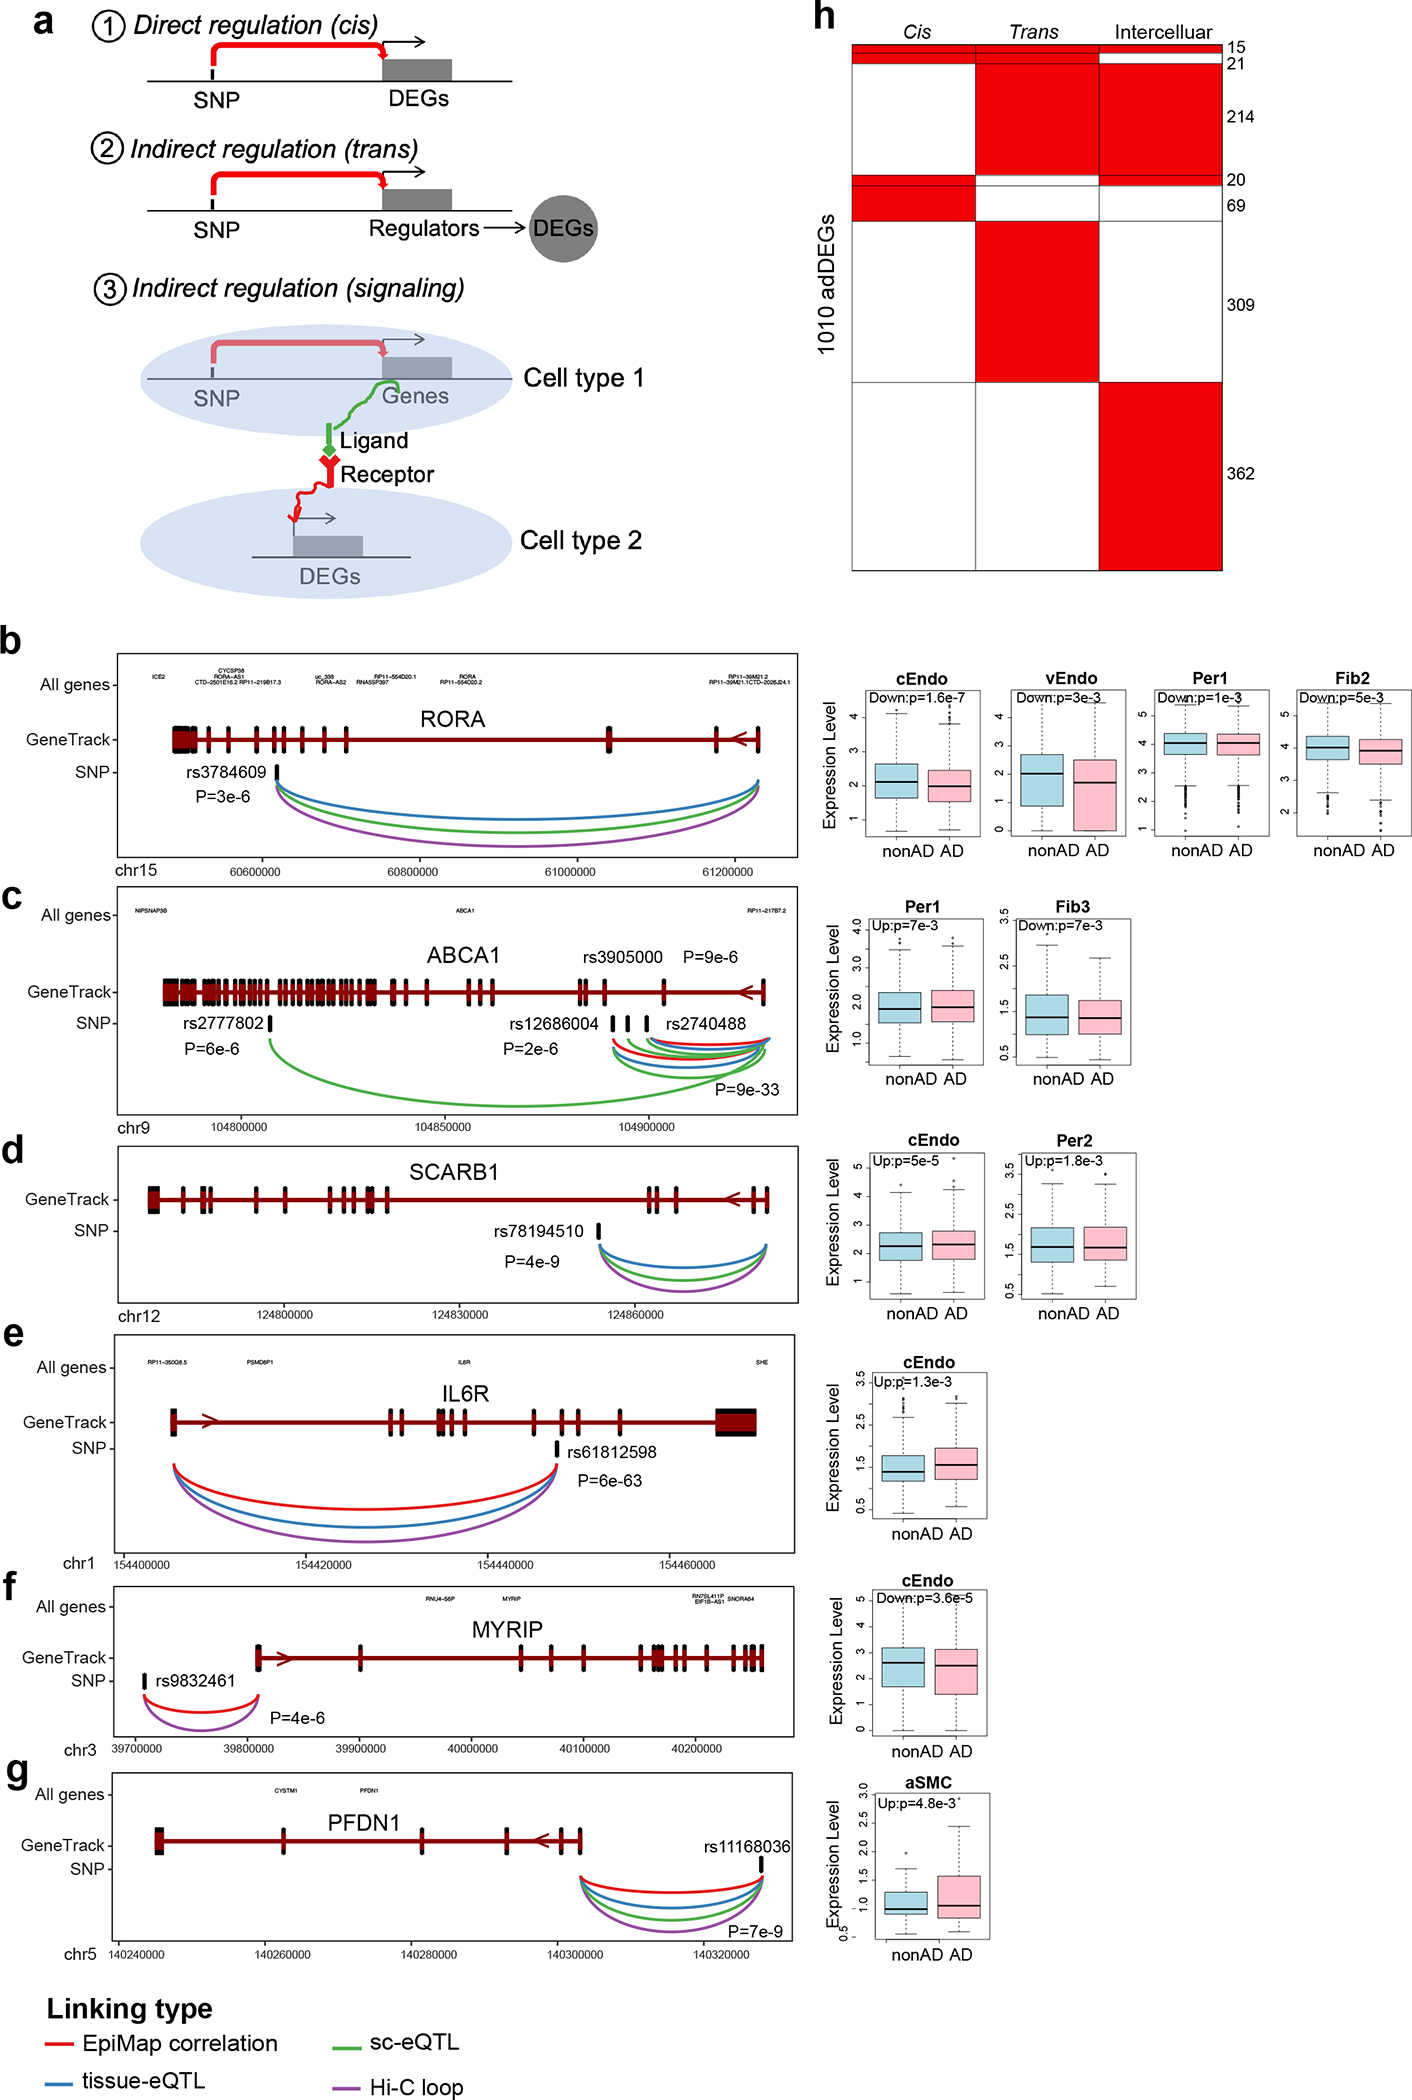
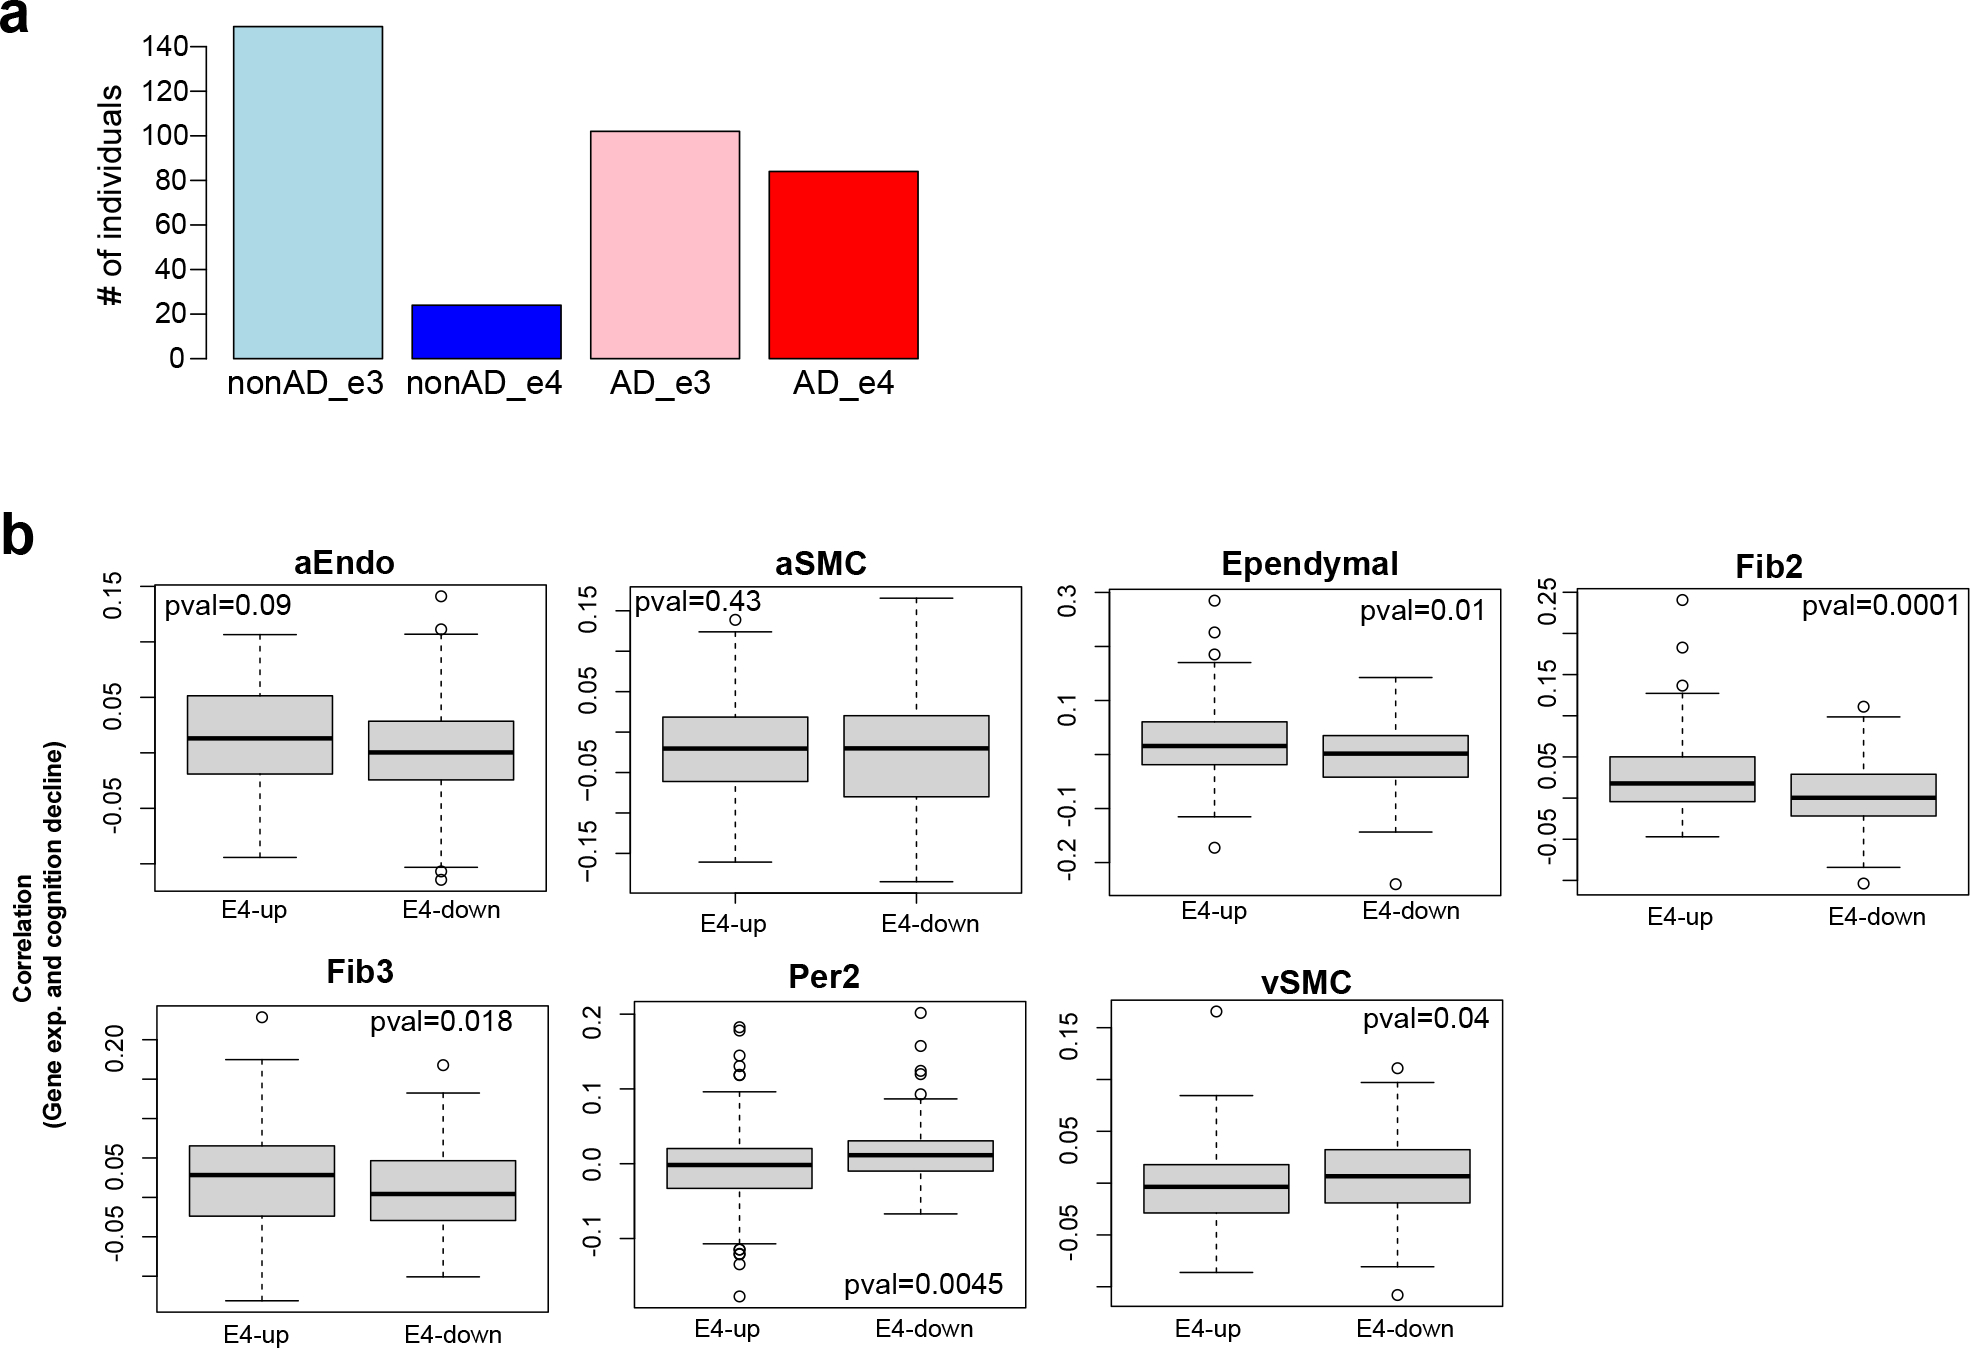
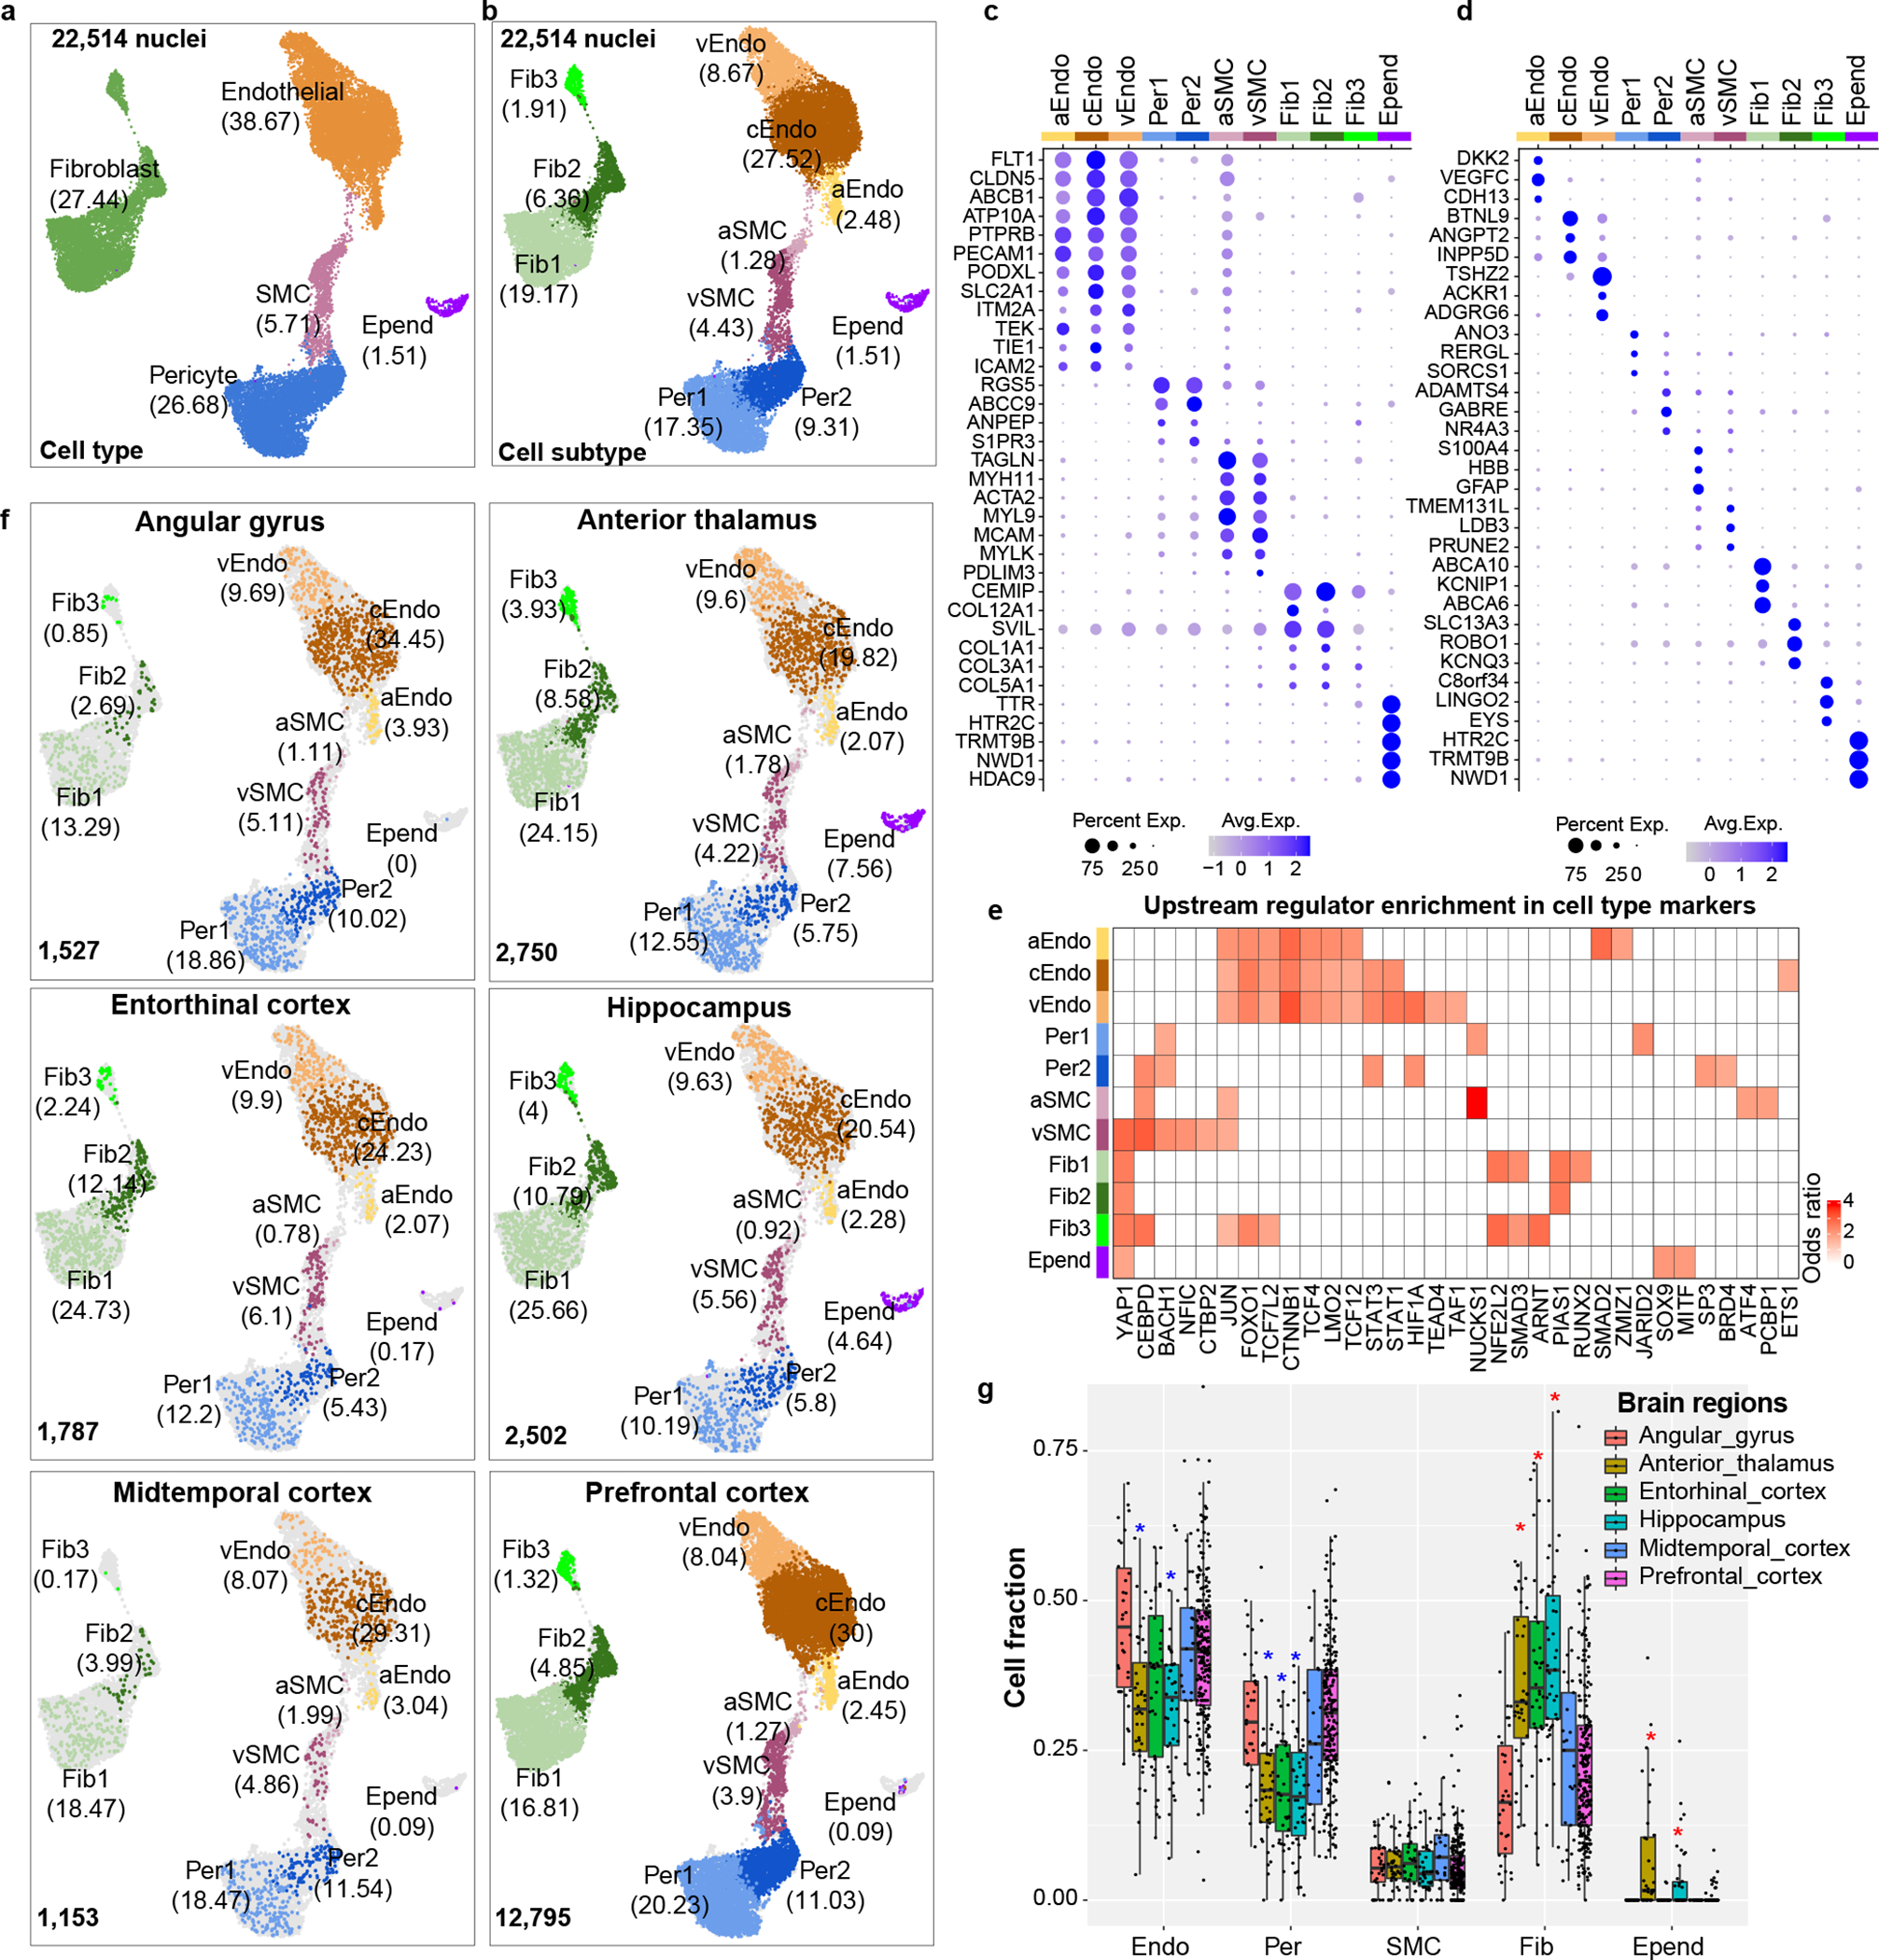
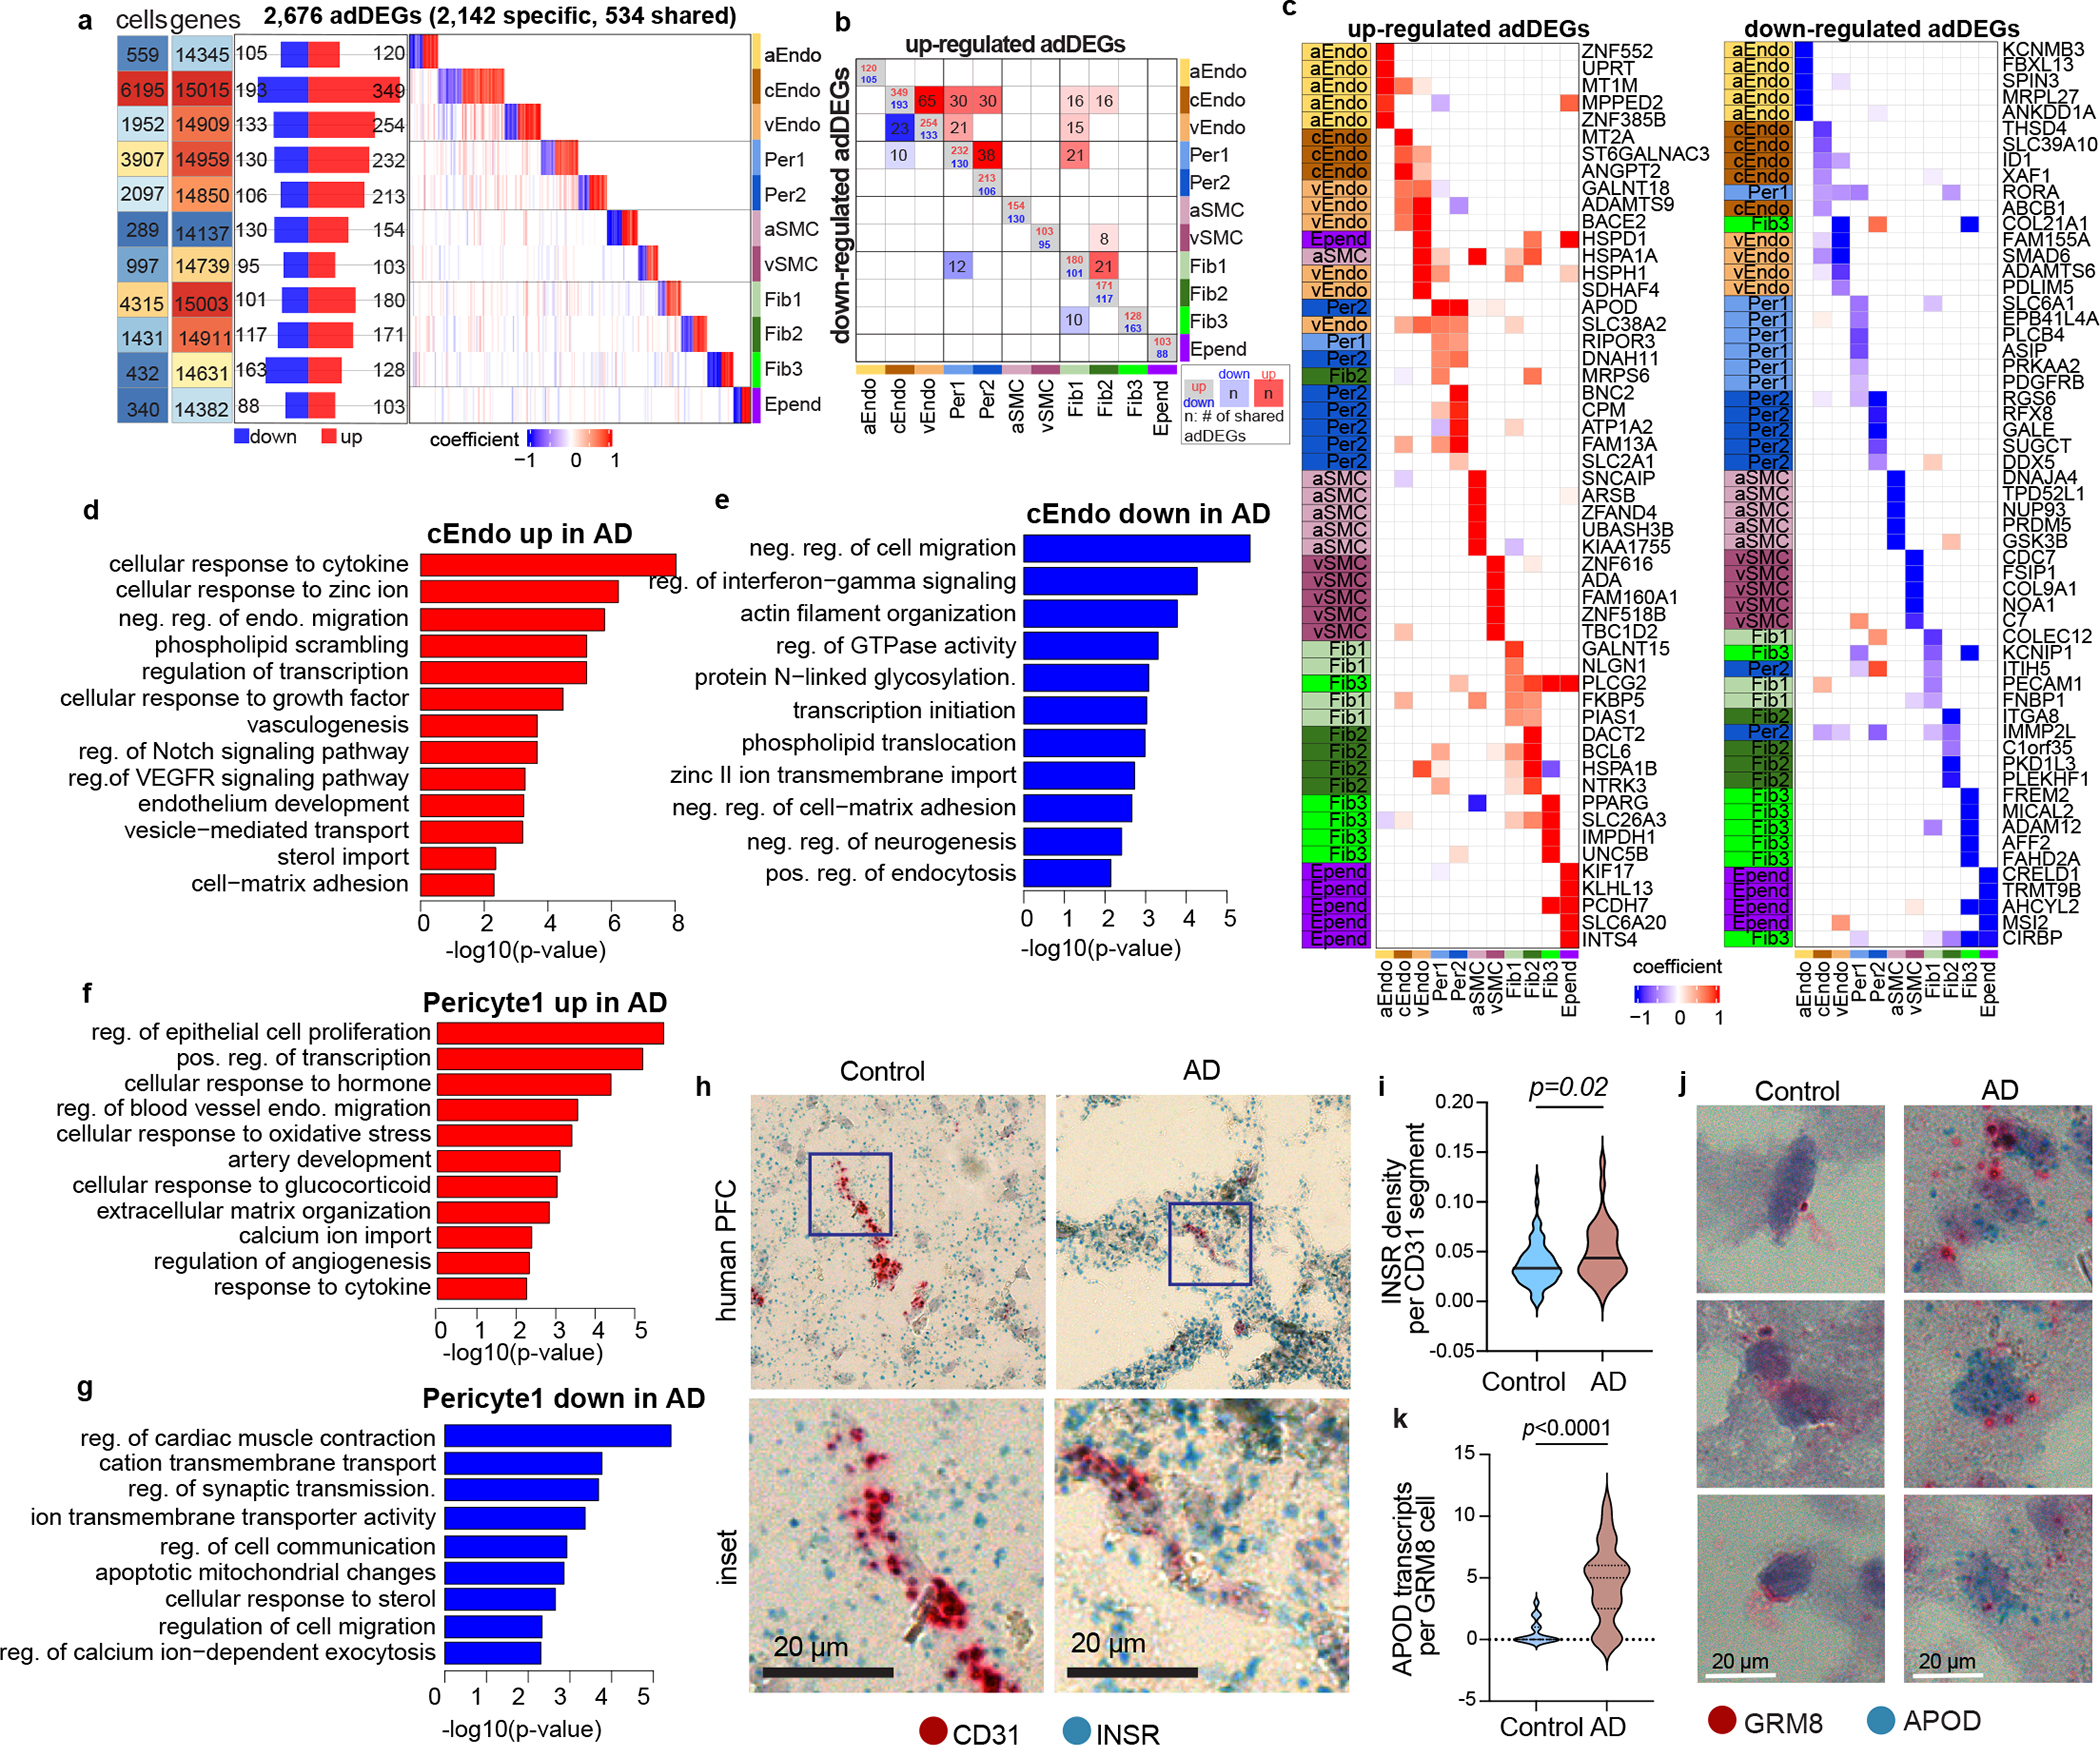
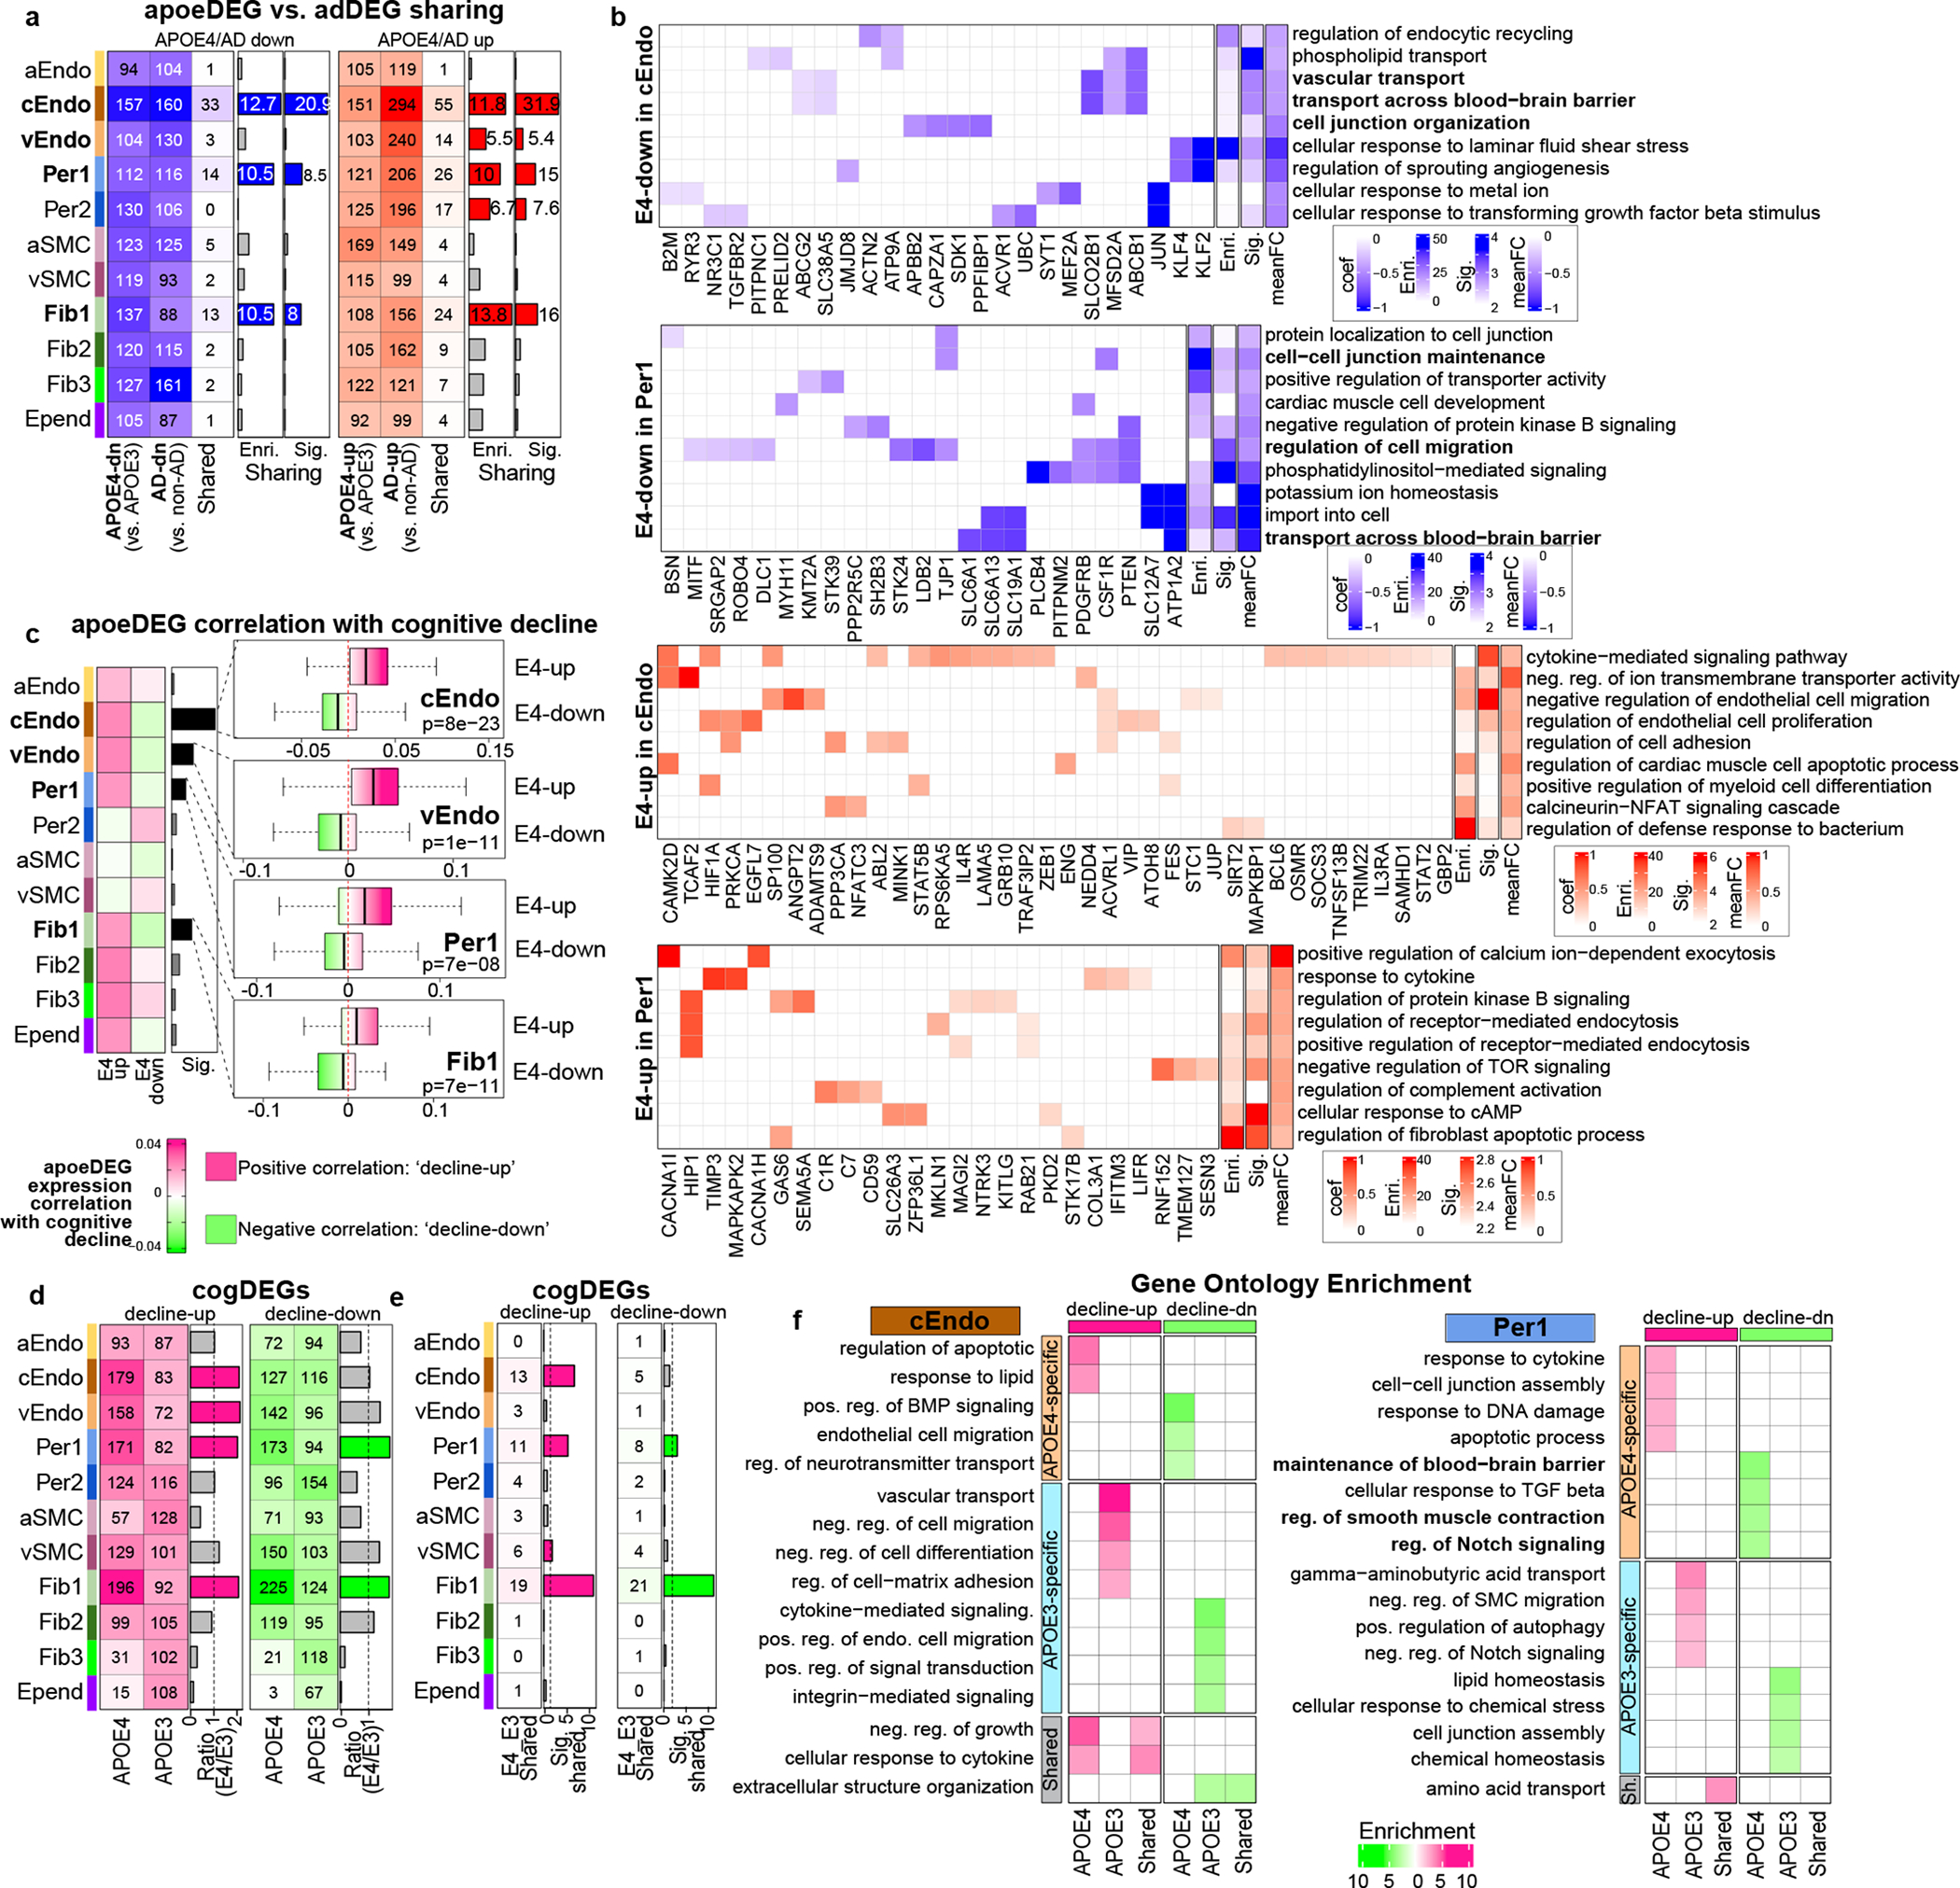
Cerebrovascular dysregulation is a hallmark of Alzheimer's disease (AD), but the changes that occur in specific cell types have not been fully characterized. Here, we profile single-nucleus transcriptomes in the human cerebrovasculature in six brain regions from 220 individuals with AD and 208 age-matched controls. We annotate 22,514 cerebrovascular cells, including 11 subtypes of endothelial, pericyte, smooth muscle, perivascular fibroblast and ependymal cells. We identify 2,676 differentially expressed genes in AD, including downregulation of PDGFRB in pericytes, and of ABCB1 and ATP10A in endothelial cells, and validate the downregulation of SLC6A1 and upregulation of APOD, INSR and COL4A1 in postmortem AD brain tissues. We detect vasculature, glial and neuronal coexpressed gene modules, suggesting coordinated neurovascular unit dysregulation in AD. Integration with AD genetics reveals 125 AD differentially expressed genes directly linked to AD-associated genetic variants. Lastly, we show that APOE4 genotype-associated differences are significantly enriched among AD-associated genes in capillary and venule endothelial cells, as well as subsets of pericytes and fibroblasts.


Conflict of interest statement

Competing Interests

The authors declare no competing interests.

Figures

Extended Data Figure 1.
Extended Data Figure 1.. Brain vasculature characterization across six brain regions.
a. Markers for vascular cell types (left) and cell subtypes (right). The z-scores are shown at the pseudo-bulk level. The top 5 markers for each cell type or subtype with highest fold change and the known markers are shown along the right side of the heatmap. b-c. UMAPs showing the comparison of brain vascular nuclei in this study (labeled as “ROSMAP”) and Yang et al. at both the cell type (b) and subtype (c) levels. d. Heatmaps showing the significant overlap of marker genes at the subtype level between this study (labeled as “ROSMAP”) and Yang et al. (top: significance; bottom: the fraction of overlapped genes). The top heatmap shows the fraction of overlapped genes. The −log10(adj. p-value) are shown in the bottom heatmap to represent the significance (Fisher’s exact test, two-sided adjusted p-value < 0.05 as a cutoff). e. UMAPs showing the correspondence of pericyte subtypes between this study and Yang et al.. The top UMAP shows the two subtypes of pericytes identified in this study. The bottom two UMAPs show the T-pericyte and M-pericyte signature score distribution in this study. The signature genes of T-pericyte and M-pericyte were defined in Yang et al..
Extended Data Figure 2.
Extended Data Figure 2.. Cell fraction analysis.
a. Distribution of cell fraction across six brain regions in cell subtypes. The stars represent the significance of cell types enriched(red star) or depleted(blue star) in specific regions compared to the overall fraction by the Wilcoxon rank test adjusted p-value < 0.05, n=409 in PFC; 47 in angular gyrus, mid-temporal cortex and thalamus; 45 in entorhinal cortex; 84 in hippocampus. The box starts in the first quantile (25%) and ends in the third (75%). The line inside represents the median. Two whiskers represent the maximum and minimum without outliers. b-c. Cerebrovascular cell distribution by sex. b. UMAP of brain vascular nuclei colored by sex. c. Cell fraction across sex for each cell type (left) and across cell types for male and female individuals (right). d-e. Cerebrovascular cell distribution by AD classification. d. UMAP of brain vascular nuclei colored by AD classification. e. cell fraction across AD classification for each cell type (left) and across cell types for AD and control individuals (right). f. Cell fraction distribution between control and AD individuals in overall vascular cells (left) and each cell type (middle: in all cells; right: in vascular cells) (n=220 for AD and n=208 for nonAD). The box starts in the first quantile (25%) and ends in the third (75%). The line inside represents the median. Two whiskers represent the maximum and minimum without outliers. g-h. UMAP of brain vascular nuclei colored by age (g) and PMI (h) showing no difference of cell distribution with age or PMI. i-j. Comparison of cell fraction between this study (labeled “ROSMAP”) and Yang et al. in hippocampus (i) and prefrontal cortex (j). Stars represent the statistical significance by the Wilcoxon rank test (*: adjusted p-value < 0.05 ***: adjusted p-value < 0.001). Blue stars indicate a higher fraction in Yang et al. and red stars represent a higher fraction in this study. For hippocampus, n=42 for ROSMAP data, n=17 for Yang et al. data; for PFC, n=233 for ROSMAP data, n=8 for Yang et al. data. The box starts in the first quantile (25%) and ends in the third (75%). The line inside represents the median. Two whiskers represent the maximum and minimum without outliers.
Extended Data Figure 3.
Extended Data Figure 3.. Differential gene analysis across brain regions.
a. Heatmap of the number of highly expressed brDEGs in each region and for each cell type. The intensity of the color corresponds to the quantity of brDEGs (indicated in each cell). b. Enriched Gene Ontology biological processes in each cell type. Heatmap of −log10(p-value) indicates the significance. Enrichr in R was used to perform GO enrichment (proportion test, adjusted p-value < 0.05 as cutoff, one-sided). Only regions with enriched terms were kept.
Extended Data Figure 4.
Extended Data Figure 4.. Cell-type-specific brain vasculature changes in AD.
a. The distribution of numbers of adDEGs in permutation and real analysis. The adDEGs were identified based on permuted AD classification for each individual, and the p-value was estimated by t-test. n=428 individuals for permutation analysis. The box starts in the first quantile (25%) and ends in the third (75%). The line inside represents the median. Two whiskers represent the maximum and minimum without outliers. b. Heatmaps of the consistency of adDEGs using single-cell based (MAST) and pseudo-bulk based (edgeR) methods. The fraction of overlapped genes is shown in the top heatmap. The −log10(adj.p-value) by Fisher’s exact test represents the significance and is shown in the bottom heatmap (two-sided). c. The consistency of adDEGs in cEndo using different numbers of cells by downsampling analysis (1000, 2000, 3000, 4000, 5000 and the original 6195 cEndo cells). For each panel, the x-axis represents the significance of adDEGs in the downsampling condition listed at the top of the columns. The significance was measured by log(p-value), and the sign indicates the direction of effect size in this condition. The y-axis shows the effect size in the downsampling condition listed at the right of the rows. The effect size was measured by coefficient in MAST. d. Comparison of adDEGs across brain regions in each cell type. Each heatmap shows the significant overlap of adDEGs between brain regions in one cell type. Significance represented by −log10(adj.p-value) by Fisher’s exact test (two-sided). Six cell types with enough cells to identify adDEGs in each region are included in this analysis.
Extended Data Figure 5.
Extended Data Figure 5.. Functional enrichment of adDEGs.
a. Heatmap showing the significance of GO term overlap between adDEG sets. The −log10(adj.p-value) by Fisher’s exact test represents the significance (adj.p-value < 0.05 as a cutoff). b. Top enriched Gene Ontology biological processes in up-regulated adDEGs (left) and down-regulated adDEGs (right). Enrichr in R was used to perform GO enrichment (proportion test, adjusted p-value < 0.05 as cutoff, one-sided). The full list of enriched GO terms is shown in Supplementary Table 7.
Extended Data Figure 6.
Extended Data Figure 6.. Experimental validation of adDEGs.
a. Chromogenic RNAscope for ABCC9 and SLC6A1. Prefrontal cortex brain sections (n=4 for AD and n=4 for nonAD) were sectioned at 20 μm (3 images per slide), then stored at −80°C. Sections were then prepared for RNAscope using the manufacturer’s instructions. Scale bar, 20 μm. b. Quantification of SLC6A and ABCC9 double-positive cells per image. P value was calculated by t-test. Data are presented as mean values +/− standard deviation. c. Collagen-4 and lectin-488 immunohistochemistry. Scale bar, 50 μm. d. Additional images of collagen-4 immunohistochemistry. Scale bar, 20 μm. e. Quantification of collagen-4 signal intensity. P value was calculated by t-test (n=4 for AD and n=4 for nonAD individuals). Data are presented as mean values +/− standard deviation.
Extended Data Figure 7.
Extended Data Figure 7.. Upstream regulators of adDEGs.
Regulator modules of adDEGs in 11 cell types. On the left of each heatmap, the first column shows if the regulator is significantly differentially expressed (adDEGs, labeled as DE) or just expressed (exp) in the corresponding 4 cell type. The second column shows the significance of differential expression as represented by the coefficient calculated in MAST analysis. The heatmap shows −log10(p-value) to represent the significance of overlapping targets between regulators by Fisher’s exact test (two-sided).
Extended Data Figure 8.
Extended Data Figure 8.. Dynamics of cell-cell communications between vascular cell types and neuron/glial cells in AD.
a. Computational framework to infer cell-cell communications. For each cell type, a set of genes was clustered into a number of co-expressed modules. The pairwise Pearson correlation coefficient was calculated between modules for each pair of cell types. The significantly correlated modules, functional enrichment, and ligand-receptor pairs were integrated into the prediction of cell-cell communication. The output includes the interacting cell types, ligand, ligand-involved functions, receptor, receptor-involved functions, potential targets in signal receiver cell type, and direction of cell-cell communication (as determined by the changes of ligand-receptor and their co-expressed genes in the same module) in AD. b. Barplot showing the statistical significance of the cell-cell communications, as represented by the adjusted p-value using a permutation test in each pair of interacting cell types. An adjusted p-value of 0.01 (dashed line) was used as a cutoff. The three cell pairs which had the most cell-cell communication (Ex_Per1, Astro_cEndo and cEndo_Ex) are highlighted in bold. c. Heatmap showing the up- and down-regulation of both forward and reverse cell-cell communications in AD. The purple indicates the number of forward interactions (from cell type on the left of the plot to cell type on the bottom of the plot) that were upregulated in AD (upper triangle in each square) and downregulated in AD (lower triangle in each square). The green indicates the number of reverse interactions (from the cell type on the bottom of the plot to the cell type on the left of the plot) that were upregulated in AD (upper triangle in each square) and downregulated in AD (lower triangle in each square). d. Heatmap showing the forward and reverse cell-cell communications that are both up- and down-regulated in AD. The red indicates the number of upregulated interactions in AD that are forward interactions (from cell type on the left of the plot to cell type on the bottom of the plot, lower triangle) and reverse interactions (from the cell type on the bottom of the plot to the cell type on the left of the plot, upper triangle). The blue indicates the number of downregulated interactions in AD that are forward interactions (from cell type on the left of the plot to cell type on the bottom of the plot, lower triangle) and reverse interactions (from the cell type on the bottom of the plot to the cell type on the left of the plot, upper triangle).
Extended Data Figure 9.
Extended Data Figure 9.. AD GWAS loci linked to brain vascular adDEGs.
a. Three proposed types of regulatory mechanisms to interpret the association between adDEGs and AD genetic variants: (1) SNP directly (cis) regulates adDEG; (2) SNP indirectly (trans) regulate adDEG; (3) SNP indirectly (ligand-receptor signaling) regulates adDEG. b-g. Examples of adDEGs directly regulated by AD-associated variants through linking (eQTLs, Hi-C, promoter-enhancer correlation) along with the expression changes in vascular cell types in AD shown in the boxplots on the right (n=10,272 and 12,242 nuclei in AD and control individuals). The box starts in the first quantile (25%) and ends in the third (75%). The line inside represents the median. Two whiskers represent the maximum and minimum without outliers. Likelihood ratio test is used here (two-sided, adjusted p-value < 0.05 as cutoff. P-value is shown in the barplot.). h. The number of targets regulated by three, two, or only one of the regulatory mechanisms.
Extended Data Figure 10.
Extended Data Figure 10.. APOE4-associated DEGs and cognitive decline.
a. The number of individuals with each combination of AD classification and APOE genotype: nonAD with ε33 alleles, nonAD with ε4 allele, AD with ε33 alleles, and AD with ε4 allele. b. The comparison of apoeDEGs correlation with cognitive decline between up-regulated and down-regulated apoeDEGs in the APOE4 group in each cell type.
Figure 1.
Figure 1.
Brain vasculature characterization across six brain regions. a-b. UMAP of 22,514 in silico sorted brain vascular nuclei from postmortem tissues labeled by cell type (a) and cell subtype (b), the percentage of cells in each cell type is shown. c-d. Top 5 markers for vascular cell types (c) and cell subtypes (d). The size of dots represents the percentage of cells with expression. The color of dots represents the scaled average expression level. e. Heatmap to show the enrichment of upstream regulators for cell subtype markers. Odds ratio represents the enrichment. Enrichr package in R based on three libraries including TRANSFAC and JASPAR, ChEA, and ENCODE TF ChIP-seq data was used to predict upstream regulators (proportion test, adjusted p-value <0.05 as a cut-off). Only the regulators with significantly high expression in the corresponding cell types are shown. f. UMAP of vascular nuclei for each brain region. The percentage of cells in each cell type is shown. g. Distribution of cell fraction across six brain regions in major cell types. The stars represent the significance of cell types enriched(red star)/depleted(blue star) in specific regions compared to the overall fraction by the Wilcoxon rank test adjusted p-value <0.05 (two-sided). n=409 in PFC; 47 in angular gyrus, mid-temporal cortex and thalamus; 45 in entorhinal cortex; 84 in hippocampus. The box starts in the first quantile (25%) and ends in the third (75%). The line inside represents the median. Two whiskers represent the maximum and minimum without outliers.
Figure 2.
Figure 2.
Cell-type-specific brain vasculature changes in AD. a. Overview of adDEGs in each cell type. From left to right panels, it shows the numbers of cells and expressed genes in each cell type, the number of down-regulated and up-regulated adDEGs in AD, and the heatmap with each gene in column and each cell type in row. b. The number and significance of adDEGs overlap between cell types in both directions (upper triangle: upregulated adDEGs; lower triangle: down-regulated adDEGs). The blocks with blue or red shade represent the significant overlap. More dark, more significant. c. Top5 up- and down-regulated adDEGs in AD in each cell type. The highest effect size for each gene is colored by the cell type on the left column of the heatmap. d-g. Enriched Gene Ontology biological processes in upregulated (d) and down-regulated (e) adDEGs in capillary endothelial cells (cEndo), upregulated (f) and down-regulated (g) adDEGs in Per1. Enrichr in R was used to perform GO enrichment (proportion test, adjusted p-value < 0.05 as cutoff). h-i. Representative images (h) and quantification (i) of INSR transcripts in CD31+ endothelial cells from control and AD prefrontal cortex tissues by RNA in situ hybridization (t-test, adjusted p-value < 0.05). n=4 for AD and n=4 for nonAD individuals. j-k. Representative images (j) and quantification (k) of APOD transcripts in GRM8+ pericytes from control and AD prefrontal cortex tissues by RNA in situ hybridization (t-test, adjusted p-value < 0.05). n=4 for AD and n=4 for nonAD individuals.
Figure 3.
Figure 3.
Upstream regulators of differentially expressed genes in AD. a-b. Regulator-cell type networks in upregulated (a) and down-regulated (b) adDEGs. Enrichr is used to predict regulators (proportion test, adjusted p-value < 0.05 as cut-off). The large nodes represent cell types. Triangle nodes represent cell type specific regulators. Gray nodes represent regulators with expression but not differentially expressed. Red nodes represent differentially expressed regulators. Red edges represent the corresponding differentially expressed regulators in relevant cell types. c. Overview of heatmaps to show co-regulatory tfModules for all adDEGs sets (up and down for each cell type). For each cell type, there are two heatmaps to show the tfModules (up adDEGs and down adDEGs). The size of each heatmap reflects the number of regulators. The values in the heatmap are −log10(p-value) to represent the significance of overlapping targets between regulators as (d). Fisher’s exact test is used (adjusted p-value < 0.05 as cutoff) d. Co-regulatory modules of upregulated adDEGs in capillary endothelial cells (cEndo). Seven modules are boxed in green. The values in the heatmap are the significance of overlapping targets between regulators (−log10(p-value)) as (c). On the left, column 1: the regulator is differentially expressed; 2: differential significance ; 3: the percentage of targeted adDEGs in all targets of each regulator and the percentage of targeted upregulated adDGEs in all targeted adDEGs. e. Physical protein-protein interaction networks for 5 of 7 co-regulatory modules. f. Heatmap showing the eight adDEG groups that were targeted by regulators shown in (d). Red indicates that a gene in a row is targeted by the regulator in the column. The gray shaded blocks highlight the regulation of specific co-regulatory modules on
Figure 4.
Figure 4.
Dynamics of cell-cell communications between vascular cell types and neuron/glial cells in AD. a-b. Summary of Increased (a) and decreased (b) interactions in AD mediated by ligand-receptor signaling between vascular cell types and neuron/glial/microglial cell types in AD. The arrow represents the direction of cell-cell interactions. The width of the edge reflects the number of interactions (the number of ligand-receptor pairs) between two cell types. c-d. Ligand-receptor pairs (row) in each pair of cell types (column) for increased (c) and decreased (d) interactions in AD. The signaling pathway is shown on the right of the heatmap. The star in the signaling pathway column indicates that the signaling pathway was significantly overrepresented (Fisher’s exact test, p-value < 0.01 as cutoff, two-sided). e-g. The ligand-receptor networks in three pairs of interacting cell types: cEndo-Ex (e), cEndo-Astro (f), and Per1-Ex (g). Ligand-receptor interactions with direction were shown in the network. The color of nodes represents the cell type. Red edges represent AD-increased interactions, while blue edges are for AD-decreased interactions.
Figure 5.
Figure 5.
AD GWAS loci directly linked to brain vascular adDEG. a-g. Direct (cis) regulated adDEGs by AD-associated variants. Shown are the AD GWAS loci associated with significant adDEGs. a. Gene names with the maximum effect size for a given AD GWAS loci are labeled on the plot. The color of the lines connecting the gene names in (a) and (b), and the shade of the box in the heatmap in column (b) indicate direction of regulation in AD. c. The cell-type in which the largest differential expression occurs.d. Heatmap showing differential expression across all cell types represented by effect size. e. Left column: the genomic annotation for SNPs of the adDEGs; middle column: heatmap of the distance between variant and adDEG transcription starting site (TSS) in kb; right column: the rank of adDEG among all associated genes of the specific variant in terms of proximity. f. Heatmap showing four pieces of linking evidence, values are the number of appearances in the used datasets. g. Heatmap to highlight the enriched functions of adDEGs. Rightmost column shows the SNP score represented by −log10 (p-value) of the variants in AD.
Figure 6.
Figure 6.
AD GWAS loci indirectly linked to brain vascular adDEG. a. Summary of AD-associated transcription factors: AD-variants, linking evidence, transcription factor, the number of targets in adDEGs for each cell type and summation in all cell types, and representative functions of these targets. The color scale for odds ratio in red/blue refers to the enrichment of up-/down-regulated adDEGs in the regulator’s targets. b. Summary of AD-associated ligands: AD-variants, linking evidence, ligand, receptor, signaling pathway, sender cell type, receiver cell type, differential direction in AD, and number of targeted adDEGs. The colors are matched for the columns of AD-variants, linking evidence, and ligand to show the correspondence between AD-variants and associated ligands. The colors of the sender (“Sndr”) and receiver (“Rcvr”) cell types match the cell types shown in Figure 5c–d. The columns are horizontally aligned to show the correspondence. c. The enriched biological processes of targets shown in (b) and the targets involved in the specific function. Enrichr in R was used to perform GO enrichment
Figure 7.
Figure 7.
APOE4-associated transcriptional changes and cognitive decline. a. The comparison of apoeDEGs and adDEGs for each cell type. The heatmaps show the number of up- and downregulated apoeDEGs, adDEGs and overlapping DEGs in APOE4 or AD groups. The fold enrichment and adjusted p-value (Fisher’s exact test, < 0.05 as cutoff, two-sided) are shown in the barplot. b. Enriched Gene Ontology biological processes in apoeDEGs in cEndo and Per1. Enrichr was used (proportion test, adjusted p-value < 0.05 as cutoff). The color of the heatmap for each term-gene pair represents the effect size. The last three columns show enrichment, significance of each term, and average effect size of the genes. The representative terms are bolded. c. The difference of correlation of apoeDEGs with cognitive decline between up- and down-regulated apoeDEGs in the APOE4 group. The correlation between apoeDEGs and cognitive decline was calculated. The heatmap shows the average correlation. The barplot shows the significance of higher correlation of apoeDEGs with cognitive decline.The boxplot (right) shows the distribution of correlation with cognitive decline in E4-up and E4-down genes n=428 individuals. The box starts in the first quantile (25%) and ends in the third (75%). The line inside represents the median. Two whiskers represent the maximum and minimum without outliers. T-test is used (adjusted p-value < 0.05 as cutoff). P-value is shown. d. The number of decline-up genes (left) and decline-down genes (right) in APOE4 and APOE3 individuals. The bar plot showed the ratio of cogDEGs in E4 vs. E3 in various cell types with a ratio of >1.5 fold as a cutoff. e. The number and significance of overlapping decline-up/-down regulated genes between APOE4 and APOE3

References

    1. Sweeney MD, Kisler K, Montagne A, Toga AW & Zlokovic BV The role of brain vasculature in neurodegenerative disorders. Nat. Neurosci. 21, 1318–1331 (2018). - PMC - PubMed
    1. Sweeney MD, Sagare AP & Zlokovic BV Blood-brain barrier breakdown in Alzheimer disease and other neurodegenerative disorders. Nat. Rev. Neurol. 14, 133–150 (2018). - PMC - PubMed
    1. Vanlandewijck M et al. A molecular atlas of cell types and zonation in the brain vasculature. Nature 554, 475–480 (2018). - PubMed
    1. Garcia FJ et al. Single-cell dissection of the human brain vasculature. Nature 603, 893–899 (2022). - PMC - PubMed
    1. Yang AC et al. A human brain vascular atlas reveals diverse mediators of Alzheimer’s risk. Nature 603, 885–892 (2022). - PMC - PubMed

Publication types