. 2023 Jul;25(7):1033-1046.
doi: 10.1038/s41556-023-01162-4. Epub 2023 Jun 1.

Lipid droplet-associated lncRNA LIPTER preserves cardiac lipid metabolism

Affiliations

Lipid droplet-associated lncRNA LIPTER preserves cardiac lipid metabolism

Lei Han et al. Nat Cell Biol. 2023 Jul.

Abstract

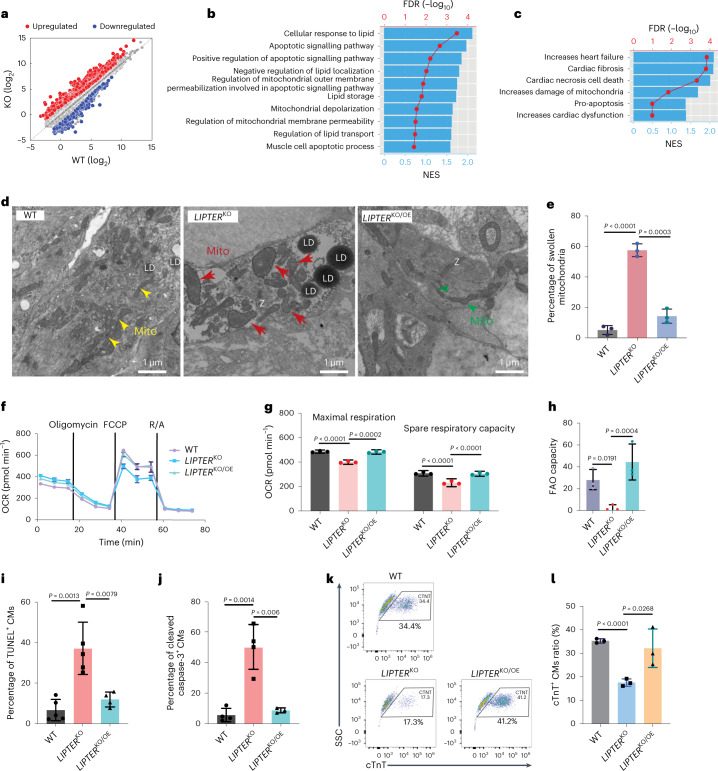
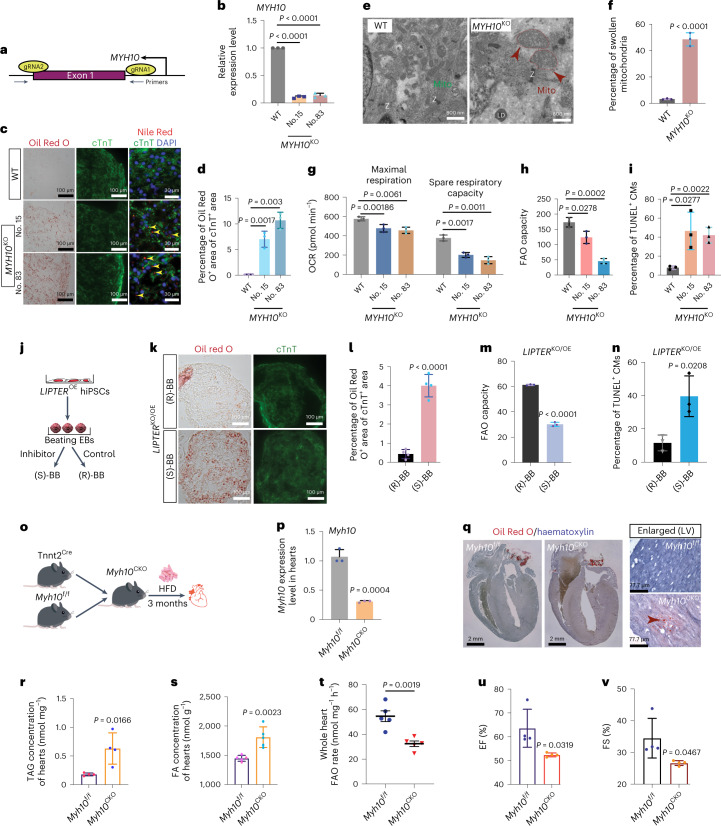
Lipid droplets (LDs) are cellular organelles critical for lipid homeostasis, with intramyocyte LD accumulation implicated in metabolic disorder-associated heart diseases. Here we identify a human long non-coding RNA, Lipid-Droplet Transporter (LIPTER), essential for LD transport in human cardiomyocytes. LIPTER binds phosphatidic acid and phosphatidylinositol 4-phosphate on LD surface membranes and the MYH10 protein, connecting LDs to the MYH10-ACTIN cytoskeleton and facilitating LD transport. LIPTER and MYH10 deficiencies impair LD trafficking, mitochondrial function and survival of human induced pluripotent stem cell-derived cardiomyocytes. Conditional Myh10 deletion in mouse cardiomyocytes leads to LD accumulation, reduced fatty acid oxidation and compromised cardiac function. We identify NKX2.5 as the primary regulator of cardiomyocyte-specific LIPTER transcription. Notably, LIPTER transgenic expression mitigates cardiac lipotoxicity, preserves cardiac function and alleviates cardiomyopathies in high-fat-diet-fed and Leprdb/db mice. Our findings unveil a molecular connector role of LIPTER in intramyocyte LD transport, crucial for lipid metabolism of the human heart, and hold significant clinical implications for treating metabolic syndrome-associated heart diseases.


Conflict of interest statement

A provisional patent application from L.Y. is under preparation. The other authors declare no competing interests.

Figures

Fig. 1
Fig. 1. Identification of a human CM-specific lncRNA LIPTER (LINC00881).
a, A schematic diagram shows the integrated transcriptomic analyses of data from human heart tissues and human embryonic stem cell (hESC)-derived cardiovascular cells. NF, non-failure. b, RT–qPCR detection of LINC00881 expression in hiPSC-derived cardiovascular cell types (n = 3 independent experiments). c, RT–qPCR results of LINC00881 expressions in all collected human hearts. NF (n = 18 samples), NF + T2DM (n = 4 samples), DCM (n = 12 samples), DCM + T2DM (n = 6 samples). d, LINC00881 expression profile across human organs from the NIH Genotype-Tissue Expression (GTEx) project database. TPM, transcripts per million. Whiskers show the minimum to maximum values, and bounds of boxes represent first and third quantiles and the centre line indicates the median. e, The scRNA-seq data from a human foetal heart reveal CM-specific LINC00881 expression. f, Violin plots showing LINC00881 (n = 439 cells), NKX2.5 (n = 647 cells), MYH6 (n = 417 cells), CTNT (n = 718 cells) and MYH7 (n = 582 cells) expression in CMs by analysing scRNA-seq data from e. Whiskers show the minimum to maximum values, and bounds of boxes represent first and third quantiles and the centre line indicates the median. g, Interspecies conservation analysis of LINC00881 sequence. h, A scheme of CM differentiation from hiPSCs by forming EBs. i, Expression dynamics of LIPTER and NKX2.5 during CM differentiation. Dots are presented as mean ± s.e.m. Unpaired two-tailed t-test is used for comparison (n = 3 independent experiments). j, Dual gRNAs were designed to completely knock out LIPTER in hiPSCs using CRISPR/Cas-9. k, LIPTER expression in WT and LIPTERKO hiPSC-derived EBs at day 20 (n = 4 independent experiments). l, Ratios of cTnT+ CMs in day 40 hiPSC-EBs (n = 4 independent experiments). In b, c, k and l, bars are represented as mean ± s.e.m. Unpaired two-tailed t-test is used for comparison. Source numerical data are available in source data. Source data
Fig. 2
Fig. 2. LIPTER deficiency disrupts LD balance of hiPSC-CMs.
a, Heat map showing top changed metabolites in LIPTERKO versus WT hiPSC-CMs at day 40 of differentiation. b, Oil Red O lipid staining and cTnT immunostaining (first two columns); Nile Red and cTnT co-staining (third column); LIPTER RNA FISH and Lipid Deep Red co-staining (fourth column) in WT, LIPTERKO and LIPTERKO/OE hiPSC-CMs. c, Quantification of the ratios of Oil Red O+ areas to cTnT+ CM areas (n = 4 independent experiments). d, Schematic of lipid uptake and LD mobilization analysis in palmitic acid (palmitate)-treated WT and LIPTERKO hiPSC-CMs. e, Uptake of Rhodamine B-palmitic acid by whole hiPSC-CMs (n = 3 independent experiments). f,g, Representative fluorescence images of LD accumulation/distribution in WT and LIPTERKO hiPSC-CMs treated with 200 μM palmitate for 6 h (f), followed by palmitate depletion for an additional 12 h (g). h, Quantification of relative LD densities in whole CMs, and in 1/2 cytosolic and 1/2 nucleus surrounding areas in CMs (n = 4 independent experiments). i, Measurement of Rhodamine B fluorescence levels in mitochondria isolated from hiPSC-CMs post treatment with Rhodamine B-palmitic acid for 2 h (n = 4 independent experiments). In c, e, h and i, bars are presented as mean ± s.e.m. Unpaired two-tailed t-test is used for comparison. Source numerical data are available in source data. Source data
Fig. 3
Fig. 3. LIPTER deficiency results in global injuries of hiPSC-CMs.
a, Whole mRNA-seq analysis showing differential gene expression profiles in LIPTERKO versus WT hiPSC-CMs (for details, see Supplementary Table 2). b, Significantly changed genes upon LIPTERKO are enriched in GO biological processes identified by GSEA analysis. NES, normalized enrichment scores. c, Significantly changed genes in LIPTERKO versus WT hiPSC-CMs are enriched in cell toxicity categories. d, TEM images of mitochondrial morphologies in WT, LIPTERKO and LIPTERKO/OE hiPSC-CMs. Yellow and green arrows indicate normal mitochondria; red arrows indicate swollen mitochondria; Z, Z-band. LIPTERKO/OE, rescued LIPTER overexpression in LIPTERKO. The experiment was carried out three times with similar outcomes. e, Quantification of swollen mitochondria ratios from d (n = 3 independent experiments). f, Mitochondrial OCR measurement in hiPSC-CMs. g, Analyses of maximum respiratory capacity and spare respiratory capacity in OCR, normalized to total protein content of each well (n = 3 independent experiments). h, Quantification of FAO rates. i, Ratios of TUNEL+ CMs in day 40 hiPSC-EBs (n = 5 in the first 2 groups and n = 4 in the last group of independent experiments). j, Ratios of cleaved caspase-3+ CMs in day 40 hiPSC-EBs (n = 4 in the first 2 groups and n = 3 in the last group of independent experiments). k, FACS analysis of cTnT+ CM ratios in day 50 hiPSC-EBs, with statistical results in l (n = 3 independent experiments). In e, gj and l, bars are presented as mean ± s.e.m. Unpaired two-tailed t-test is used for comparison. Source numerical data are available in source data. Source data
Fig. 4
Fig. 4. NKX2.5 controls CM-specific LIPTER transcription and its downregulation in diabetic hearts.
a, RNA FISH detecting LIPTER in human heart tissues. NF, non-failure; NF + T2DM, non-failure with T2DM. b, Oil Red O staining to detect LDs in human heart tissues. c, Quantification of Oil Red O+ areas in cTnT+ areas. NF (n = 5 samples), NF + T2DM (n = 4 samples). d, PROMO, UCSC Genome Browser and TFBIND algorithms predict TF binding sites on the LIPTER promotor region. e, Dual luciferase reporter assay measuring relative LIPTER promoter activities driven by TFs, normalized to Renilla luciferase activity (n = 3 independent experiments). f, RT–qPCR detection of LIPTER and NKX2.5 expressions in WT hiPSC-CMs infected with AAV9-shControl or AAV9-shRNAs against NKX2.5 for 2 weeks (n = 5 independent experiments). g, Representative images of Oil Red O and NKX2.5 staining of hiPSC-CMs infected with AAV9-shControl or AAV9-shRNA against NKX2.5 under high-glucose (22 mM) conditions. h, Quantification of Oil Red O+ areas in cTnT+ CM areas (n = 4 independent experiments). i,j, RT–qPCR results of LIPTER (i, n = 3 independent experiments) and NKX2.5 (j, n = 5 independent experiments) expression in WT hiPSC-CMs treated with high-glucose conditions for 2 weeks. k, Representative immunofluorescent images of NKX2.5 staining in WT hiPSC-CMs treated with 0 and 22 mM glucose for 2 weeks. l, RT–qPCR results of NKX2.5 mRNA levels in human left ventricle tissues. NF (n = 9 samples), NF + T2DM (n = 4 samples), DCM (n = 14 samples), DCM + T2DM (n = 6 samples). m, Representative fluorescence images of NKX2.5 staining in human left ventricle tissues from three samples per condition. In c, e, f, hj and l, bars are presented as mean ± s.e.m. Unpaired two-tailed t-test is used for comparison. Source numerical data are available in source data. Source data
Fig. 5
Fig. 5. LIPTER selectively binds PA and PI4P on LDs and MYH10 protein.
a, RNA FISH detecting cytosolic co-localization of LIPTER with LDs stained by Oil Red O staining. WT and LIPTERKO hiPSC-CMs were treated with palmitic acid (200 μM) for 6 h to induce LD formation. b, Quantification of LIPTER co-localization with LDs in WT hiPSC-CMs (n = 6 independent experiments). c, RT–qPCR detection of LIPTER and ACTB RNA enrichments in total lipids isolated from WT hiPSC-CMs (n = 3 independent experiments). d, RNA–lipid overlay assay showing selective interaction of LIPTER with PA and PI4P. AS-LIPTER is control. PS, phosphatidylserine; PE, phosphatidylethanolamine; DAG, diacylglycerol; cholesterol; PC, phosphatidylcholine; sphingomyelin; PG, phosphatidylglycerol. e, Interactions between giant lipid vesicles formed with TopFluor-labelled PA/PI4P and Alexa594-labelled LIPTER/AS-LIPTER. f,g, MST quantifying PA (f) and PI4P (g) interactions with LIPTER or AS-LIPTER. h, Schematic of the MS2-BioTRAP system for LIPTER binding protein pulldown and live cell LIPTER tracing. i, Top: MS2YFP protein binds MS2-tagged LIPTER to form particles (purple arrows), co-localizing with Rhodamine B-palmitic acid-labelled LDs (red arrows) in WT hiPSC-CMs (yellow arrows). Bottom: WT hiPSC-CMs expressing MS2YFP protein and empty MS2-tag vector show evenly distributed YFP without formation of particles. j, Western blot showing MYH10 pulldown by anti-GFP antibody in hiPSC-CMs expressing MS2-LIPTER/-AS-LIPTER and MS2YFP, representative of three independent experiments. k, LIPTER enrichment by anti-MYH10 antibody in WT hiPSC-CMs (n = 3 independent experiments). l, Schematic of truncated LIPTER fragments. m, RNA–lipid overlay assay detecting interactions of truncated LIPTER with PA and PI4P. n,o, Images showing interactions of giant lipid vesicles formed by TopFluor-PA (n) and TopFluor-PI4P (o) with Alexa594-labelled exon 1 + 2 and exon 3 of LIPTER. p, Western blot of MYH10 pulldown in HEK293T cells transfected with MS2-tagged LIPTER fragments and MS2FLAG. q, Confocal fluorescence images showing co-localizations of LIPTER-MS2YFP, MYH10 and LDs in WT hiPSC-CMs. r, Model of human intramyocyte LD transport system via LIPTER and MYH10-ACTIN cytoskeleton. In b, c and k, bars are presented as mean ± s.e.m. Unpaired two-tailed t-test is used for comparison. Source numerical data and unprocessed blots are available in source data. Source data
Fig. 6
Fig. 6. Loss-of-MYH10 phenocopies LIPTER deficiency in CMs.
a, CRISPR/Cas-9-mediated deletion of MYH10 exon 1 in hiPSCs. b, RT–qPCR detection of MYH10 expressions in WT and MYH10KO hiPSC-CMs (n = 3 independent experiments). c, Representative images of Oil Red O staining and cTnT immunostaining (first two columns), and Nile Red for LDs and cTnT co-staining (third column) on MYH10KO and WT hiPSC-EB sections. d, Quantification of Oil Red O+ areas in cTnT+ areas in c (n = 3 independent experiments). e, TEM showing mitochondrial morphologies in WT and MYH10KO hiPSC-CMs. Normal (green arrows) and swollen (red arrowheads) mitochondria indicated. f, Quantification of swollen mitochondria ratios in e (n = 3 independent experiments). g,h, Statistical results of maximum respiratory capacity and spare respiratory capacity (n = 3 independent experiments) (g), and FAO capacities (n = 3 independent experiments) in WT and MYH10KO hiPSC-CMs (h). i, Quantification of TUNEL+ CMs ratios in MYH10KO and WT hiPSC-EBs (n = 3 independent experiments). j, Scheme of inhibiting MYH10 function in LIPTER-overexpressing hiPSC-CMs. k, Representative images of Oil Red O staining and cTnT immunostaining in LIPTERKO/OE hiPSC-CMs after treatment with (S)-(−)-Blebbistatin ((S)-BB) or control (R)-(−)-Blebbistatin ((R)-BB) for 10 days. l, Ratios of Oil Red O+ areas in cTnT+ CM areas in k (n = 4 independent experiments). m, FAO capacities of LIPTERKO/OE hiPSC-CMs after treating with (S)-BB or (R)-BB for 10 days (n = 3 independent experiments). n, Ratios of TUNEL+ CM in LIPTERKO/OE hiPSC-CMs after same treatment in m (n = 3 independent experiments). o, Scheme for HFD feeding of mice with conditional Myh10 knockout in CMs. p, RT–qPCR detecting Myh10 expression levels in mouse hearts. qs, Representative images of Oil Red O lipid staining of mouse hearts (q), and quantifications of TAG (r) and FA (s) concentrations in mouse hearts after 3 months of HFD feeding (n = 4 mice). t, FAO rates of whole Myh10f/f and Myh10CKO mouse hearts post HDF feeding (n = 5 mice). u,v, Cardiac EF (u) and FS (v) measurements of Myh10f/f and Myh10CKO mice post HFD feeding (n = 4 mice). In b, f, di, ln and rv, bars are presented as mean ± s.e.m. Unpaired two-tailed t-test is used for comparison. Source numerical data are available in source data. Source data
Fig. 7
Fig. 7. LIPTER transgene mitigates cardiomyopathies and cardiac dysfunctions in HFD-fed and Leprdb/db mice.
a, Scheme of CM lipotoxicity assay with 400 μM palmitic acid treatment on hiPSC-CMs for 4 days. b,c, Cleaved caspase3+ CM ratios (b) and TUNEL+ CM ratios (c) in control and LIPTEROE hiPSC-CMs after PA treatment (b,c, n = 3 independent experiments). d, Schematic of investigating LIPTER(Tg) effects on cardiac abnormalities in HFD‐fed mice. e, Oil Red O and haematoxylin staining of mouse hearts after 7 month HFD feeding. f,g, FA (f, n = 5 mice each group) and TAG (g, n = 7 mice each group) concentrations were next measured. h, FAO rates of whole WT and LIPTER(Tg) mouse hearts at 3 months of age (n = 5 mice each group). i, GO biological processes significantly enriched in the upregulated genes in LIPTER (Tg) versus WT mouse hearts. j, Picrosirius Red and Fast Green co-staining of mouse hearts after 10 month HFD feeding. k, Quantification of relative red fibrotic areas in whole hearts (n = 3 mice each group). l,m, EF (l) and FS (m) measurements of WT and LIPTER(Tg) mice fed on HFD or NC for 10 months. n = 5 mice (WT + NC), n = 6 mice (WT + HFD), n = 7 mice (Tg + HFD). n, RIP-seq reads plot showing LIPTER pulldown by anti-Myh10 antibody in LIPTER (Tg) mouse heart. Red arrow indicates the reads enrichment on LIPTER exon 3. The experiment was carried out in two mice, each genotype with similar outcomes. o, A scheme for delivering LIPTER and controls (GFP, AS-LIPTER) into Leprdb/db mouse CMs using AAV9 virus. p, RT–qPCR detecting LIPTER expressions in Leprdb/db mouse hearts 6 weeks post AAV9 injection (n = 5 mice per group, except n = 4 mice in the GFP group). q, Oil Red O staining of Leprdb/db mouse hearts 6 weeks post AAV9 injection. r, FAO rates of Leprdb/db mouse hearts 6 weeks post AAV9 injection (n = 5 mice per group, except n = 4 mice in the No AAV group). s, CM size analysis using WGA staining 6 weeks post AAV9 injection (n = 5 mice per group, except n = 4 mice in the GFP group). t,u, EF (t) and FS (u) measurements in WT and Leprdb/db mice 6 weeks post AAV9 injection (n = 5 mice per group, except n = 4 mice in the GFP group). In b, c, fh, km, p and ru, bars are presented as mean ± s.e.m. Unpaired two-tailed t-test is used for comparison. Source numerical data are available in source data. Source data
Extended Data Fig. 1
Extended Data Fig. 1. Identification of human CM-specific lncRNA LIPTER (LINC00881).
a, RT-qPCR detection of pluripotency marker OCT4, cardiac progenitor marker PDGFRA, cardiomyocyte marker TNNT2, endothelial cell marker CD31, smooth muscle cell marker SM22, as well as lncRNAs NAV2-AS2, TTN-AS1 and SLC8A1-AS1 expressions in enriched cardiovascular cell types differentiated from human iPS cells. (n = 2 independent experiments). b, RT-qPCR detection of lncRNAs NAV2-AS2, TTN-AS1 and SLC8A1-AS1 expression levels in left ventricle tissues from NF (n = 10 samples), NF+T2DM (n = 4 samples), DCM (n = 12 samples) and DCM+T2DM (n = 5 samples) individuals. All bars are presented as mean ± s.e.m. Unpaired two-tailed t-test is used for comparison. c, Histogram of LINC00881 expressions in the human hearts during fetal development. RPKM, Reads Per Kilobase of transcript (RPKM). Bars are presented as mean ± sd. Data were analyzed from GSE64283. d, Histogram of LINC00881 expressions across 20 human tissues. Data were analyzed from NCBI Accession PRJNA280600. e, Histogram of LINC00881 expressions across 16 human tissues. Data were analyzed from GSE30611 (Illumina Human Body Map 2.0 Project). Source numerical data are available in source data. Source data
Extended Data Fig. 2
Extended Data Fig. 2. LINC00881 contains no coding potential.
a, ORFs predicted in LINC00881, showing predicted peptide sequence of each ORF. A FLAG tag was inserted right after each ORF. b, Western blotting detection of peptide expressions in HEK293T cells transfected with positive control, vector, and FLAG tagged ORF1, ORF2 or ORF3. Positive control is an irrelevant FLAG tagged protein coding gene. The experiment was carried out 2 times with similar outcomes. c, Immunofluorescent staining to detect expressions of FLAG tagged peptides in HEK293T cells transfected with positive control, vector, and FLAG tagged ORF1, ORF2 or ORF3. d, RT-qPCR detecting LINC00881 RNA expression levels in HEK293T cells transfected with positive control, vector, and FLAG tagged ORF1, ORF2 or ORF3. Bars are presented as mean ± s.e.m. Unpaired two-tailed t-test is used for comparison. **p < 0.01, ***p < 0.001, (n = 3 independent experiments). Source numerical data and unprocessed blots are available in source data. Source data
Extended Data Fig. 3
Extended Data Fig. 3. LIPTER deficiency impairs survival of long-term cultured hiPSC-CMs.
a, LIPTER was knocked out in hiPSCs using CRISPR /Cas-9. Dual gRNAs were designed to completely ablate LIPTER. Genotyping was carried out in individual hiPSC clones using PCR primer sets for detecting long deletions. b, Ratios of beating EBs during CM differentiation from WT and two LIPTERKO hiPSC lines. Dots represent mean values ± s.e.m. Unpaired two-tailed t-test is used for comparison. No significance detected. (n = 3 independent experiments). c, Representative FACS results of cTnT+ cells ratios at day 20 differentiation of WT and LIPTERKO hiPSC lines. d, Quantification of cTnT+ cell ratios at day 20 of differentiation. Bars represent mean values, (n = 2 independent experiments). e, RT-qPCR detecting expressions of CMs markers CTNT, MYH6 and MYH7 in WT and LIPTERKO hiPSC-EBs at day 20 of differentiation. Bars represent mean values, (n = 2 independent experiments). f, Representative FACS results of cTnT+ CM ratios in WT and LIPTERKO hiPSC-EBs at day 40 of differentiation. g, Nile Red and cTnT co-staining in WT, LIPTERKO and LIPTERKO/OE hiPSC-derived EB sections. h, Quantification of Nile Red positive areas in cTnT+ CM areas. Bars represent mean values ± s.e.m. Unpaired two-tailed t-test is used for comparison. ***p < 0.001. (n = 4 independent experiments). i, RT-qPCR detection of LIPTER overexpression levels in LIPTERKO/OE hiPSC-CMs treated with various concentrations of doxycycline for 4 days. Bars represent mean values ± s.e.m. Unpaired two-tailed t-test is used for comparison. ****p < 0.0001, **p < 0.01, n.s (no significance). (n = 3 independent experiments). Source numerical data are available in source data. Source data
Extended Data Fig. 4
Extended Data Fig. 4. LIPTER deficiency compromises mitochondrial function and induces apoptosis of human iPSC-CMs.
a, Comparing the expression levels of CD36, TG synthesis/lipolysis related genes and PLIN5 in enriched WT and LIPTERKO hiPSC-CMs at day 40 of differentiation using RT-qPCR. Bars represent mean values ± s.e.m. Unpaired two-tailed t-test is used for comparison. ****p < 0.0001, **p < 0.01. ns. no significance. (n = 4 independent experiments). b, Western blotting detection of GPAM, PLIN5 and ATGL1 protein expressions in enriched WT and LIPTERKO hiPSC-CMs at day 40 of differentiation. c, Statistical analysis of Western blotting results in b. Bars represent mean values ± s.e.m. Unpaired two-tailed t-test is used for comparison. **p < 0.01, *p < 0.05. (n = 3 times of independent experiments in the 1st and 3rd groups; n = 4 independent experiments in the 2nd group). d, WT and LIPTERKO hiPSC-derived embryoid bodies were treated with 200 µM palmitic acid for 4 days, followed by immunostaining for PLIN5 and Neil Red lipid staining on EB sections. Arrows indicate condensed PLIN5. The experiment was carried out 3 times with similar outcomes. e, Live cell images showing the fusion of Rhodamine B-palmitic acid (red) labeled-LDs with mitochondria (green) and subsequent diminishment in WT hiPSC-CMs over 45 min, while no apparent LD-mitochondria fusion was observed in LIPTERKO, and MYH10KO hiPSC-CMs. Images were from the continuous live cell imaging during 45 min of cultured hiPSC-CMs. The experiment was carried out 3 times with similar outcomes with statistical results in (f). f, Quantification of the ratios of LD fused with mitochondria in e. Bars represent mean values ± s.e.m. Unpaired two-tailed t-test is used for comparison. *p < 0.05. (n = 3 independent experiments). g, Analyses of the maximal oxygen consumption values with Palmitate:BSA between conditions without and with Etomoxir (Eto) to compare relative fatty acid oxidation (FAO) capabilities (yellow zone) in WT, LIPTER KO and LIPTER KO/OE hiPSC-CMs. The experiment was carried out 4 times with similar outcomes. h, Representative immunofluorescent images of TUNEL and cTnT co-staining on day 40 hiPSC-EB sections. The experiment was carried out 5 times with similar outcomes. i, Representative immunofluorescent images of Cleaved Caspase-3 and cTnT co-staining on day 40 hiPSC-EB sections. The experiment was carried out 4 times with similar outcomes. Source numerical data and unprocessed blots are available in source data. Source data
Extended Data Fig. 5
Extended Data Fig. 5. NKX2.5 deficiency reduces LIPTER expression and phenocopies LIPTERKO hiPSC-CMs.
a, RT-qPCR analysis of cTnT, LIPTER, MYH10 and NKX2.5 expressions in WT hiPSC-CMs after infection with AAV9 virus carrying scramble control shRNA or two NKX2.5-shRNAs. (n = 5 independent experiments). b, Representative images of Oil Red O lipid staining for LD accumulation, and NKX2.5, cTnT, DAPI immunostaining in WT, LIPTER KO and LIPTER KO/OE hiPSC-CMs treated with control shRNA or NKX2.5-shRNA under low (5.5 mM) or high glucose (22 mM) conditions. The experiment was carried out 4 times with similar outcomes. c, Quantification of the ratios of Oil Red O positive areas in cTnT+ CM areas in b. (n = 4 independent experiments). d, Representative immunofluorescent images of TUNEL, NKX2.5, cTnT and DAPI staining in WT, LIPTER KO and LIPTER KO/OE hiPSC-CMs treated with control or NKX2.5 shRNA under high glucose conditions (22 mM). The experiment was carried out 4 times with similar outcomes. e, Quantification of the ratios of TUNEL+ CMs in cTnT+ CMs of (d). (n = 4 independent experiments). In a,c,e, bars represent mean values ± s.e.m. Unpaired two-tailed t-test is used for comparison. ****p < 0.0001, ***p < 0.001, **p < 0.01, *p < 0.05. Source numerical data are available in source data. Source data
Extended Data Fig. 6
Extended Data Fig. 6. Transcriptional control of LIPTER in human CMs.
a, RT-qPCR analysis of RXRA and CEBPB expressions in WT hiPSC-CMs treated with high glucose for 2 weeks. (n = 4 independent experiments). b, Representative immunofluorescent images of RXRA and CEBPB staining in WT hiPSC-CMs treated with or without high glucose for 2 weeks. The experiment was carried out 3 times with similar outcomes. c, RT-qPCR detection of RXRA and CEBPB mRNA levels in human left ventricle tissues. NF (n = 9 samples), NF+T2DM (n = 4 samples), DCM (n = 12 samples) and DCM+T2DM (n = 7 samples). d, Representative immunofluorescent images of RXRA and CEBPB staining in human left ventricle tissues. The experiment was carried out with 3 samples per group with similar outcomes. In a,c, bars represent mean values ± s.e.m. Unpaired two-tailed t-test is used for comparison. ****p < 0.0001, **p < 0.01, *p < 0.05. Source numerical data are available in source data. Source data
Extended Data Fig. 7
Extended Data Fig. 7. Selective binding of LIPTER with PA/PI4P and MYH10.
a, RT-qPCR analysis of LIPTER, U6 (nuclear RNA) and GAPDH (cytosolic RNA) expression levels in fractionated nuclei and cytoplasm of hiPSC-CMs. Bars represent mean values ± s.e.m. (n = 3 independent experiments). b, Representative images showing no detectable interactions of giant lipid vesicles generated by TopFluor-PI with Alexa594-labeled LIPTER or Antisense-LIPTER (AS-LIPTER). The experiment was carried out 3 times with similar outcomes. c, A specific protein band only pulled down by LIPTER-MS2 in HEK293T cells and visualized in SDS PAGE gel by silver staining. MS2 binding protein was FLAG-tagged. The experiment was carried out 2 times with similar outcomes. d, Western blotting confirming MYH10 pulldown by LIPTER in HEK293T cells. The experiment was carried out 2 times with similar outcomes. e, 3D confocal immunofluorescent images showing colocalization of LIPTERYFP-MS2, MYH10, and LD in WT hiPSC-CMs (also see Supplementary Video 1). The lower right graph indicates the view of merged images. The experiment was carried out 3 times with similar outcomes. f, Immunofluorescent images showing MYH10-ACTIN cytoskeleton in WT hiPSC-CMs. The experiment was carried out 3 times with similar outcomes. Source numerical data and unprocessed blots are available in source data. Source data
Extended Data Fig. 8
Extended Data Fig. 8. MYH10 deficiency phenocopies LIPTERKO in CMs.
a, PCR detection of MYH10 null hiPSC clones confirms successful knockout of MYH10. b, Mitochondria stress assay results collected from a Seahorse XF96 Analyzer showing the differences of maximal oxygen consumption values with Palmitate:BSA between conditions without and with Etomoxir (Eto). The yellow zone in panels represent FAO capabilities of WT and MYH10KO hiPSC-CMs. c, Representative immunofluorescent images for TUNEL and cTnT co-staining in WT and MYH10 KO hiPSC-EB sections. d, Representative images showing LD accumulation and cytosolic distribution in WT and MYH10KO hiPSC-CMs treated with 200 μM palmitic acid for 6 h. The experiment was carried out 4 times with similar outcomes. d', Quantification of relative LD density in the 1/2 cytosolic areas of CMs in d. (n = 4 independent experiments). e, Quantification of fluorescence levels in mitochondria isolated from WT and MYH10KO hiPSC-CMs after Rhodamine B-palmitic acid treatment for 2 h. (n = 3 independent experiments). f, Representative images of Oil Red O lipid staining (first two columns); Nile Red and cTnT co-staining (3 rd column) in WT hiPSC-EBs treated with (S)-(-)-Blebbistatin or (R)-(-)-Blebbistatin for 10 days. g, Representative images of TUNEL and cTnT co-staining in WT hiPSC-EBs treated with (S)-(-)-Blebbistatin or (R)-(-)-Blebbistatin for 10 days. h, Quantification of TUNEL+ CM ratios in WT hiPSC-CMs treated with (S)-(-)-Blebbistatin or (R)-(-)-Blebbistatin for 10 days. (n = 5 independent experiments). i, Immunofluorescent images showing Myh10 deficiency in Myh10CKO mouse heart. In d', e, h, bars represent mean values ± s.e.m. Unpaired two-tailed t-test is used for comparison. ***p < 0.001, **p < 0.01, *p < 0.05. Source numerical data are available in source data. Source data
Extended Data Fig. 9
Extended Data Fig. 9. LIPTER transgene displays cardiac protective effects in HFD-fed mice.
a, Representative FACS results showing cleaved-Caspase-3/cTnT double positive cell ratios in control and LIPTEROE hiPSC-CMs treated with or without 400 μM palmitic acid for 4 days. The experiment was carried out 3 times with similar outcomes. b, Representative Immunofluorescent images of TUNEL and cTnT co-staining in control and LIPTEROE hiPSC-EBs treated with 400 μM palmitic acid for 4 days. The experiment was carried out 3 times with similar outcomes. c, Schematic of LIPTER(Tg) mouse generation using CRISPR/Cas-9, with the Rosa26 locus targeted by a single gRNA. d, RT-qPCR examining LIPTER expression levels in WT and LIPTER(Tg) mouse hearts. (n = 5 mice per group). e, Representative images of WT and LIPTER (Tg) mouse hearts after 7 months of HFD feeding. The heart weight/tibia length ratio was calculated. (n = 5 mice in WT, and n = 6 in Tg). f, Representative immunofluorescent images of TUNEL and cTnT co-staining in mouse heart sections after 7 months of HFD feeding. The experiment was carried out 4 times with similar outcomes. g, Quantification of TUNEL+ CM ratios in (f). (n = 4 mice per group). h, RIP-seq results showing LIPTER pulldown in LIPTER (Tg) mouse heart using anti-Myh10 antibody, with the red arrow indicating enriched signals on exon 3 of transgenic LIPTER. Control Actb and Gapdh RNAs were not pulled down by anti-Myh10 antibody. The experiment was carried out in 2 mice each genotype with similar outcomes. In d, e, g, bars represent mean values ± s.e.m. Unpaired two-tailed t-test is used for comparison. ***p < 0.001, *p < 0.05, (n.s), no significance. Source numerical data are available in source data. Source data
Extended Data Fig. 10
Extended Data Fig. 10. CM-targeted LIPTER transgene exhibits cardiac protective effects in Leprdb/db mice.
a, Heart images of WT and db/db mice 6 weeks after injection of AAV9-cTnT-GFP, AAV9-cTnT-AS-LIPTER or AAV9-cTnT-LIPTER, with fluorescent images showing robust GFP expression post AAV9-cTnT-GFP injection. The experiment was carried out 4 times with similar outcomes. b, Representative images showing GFP expression in CMs of db/db mouse heart 6 weeks after AAV9-cTnT-GFP injection. The experiment was carried out 4 times with similar outcomes. c, RT-qPCR examining GFP expression levels in WT and db/db mouse hearts 6 weeks after AAV9 injection. (n = 5 mice per group, except n = 4 mice in the GFP group). d, Representative images of WGA staining in WT or db/db mouse hearts 6 weeks after AAV9 injection. The experiment was carried out 5 times with similar outcomes. e, Blood glucose levels of WT and db/db mice 6 weeks after AAV9 injection. WT mice without AAV9 injection also serve as control. (n = 5 mice per group, except n = 4 mice in the GFP group). f, EMSA results showing no direct interaction between LIPTER and TFG protein. The experiment was carried out 2 times with similar outcomes. In c and e, bars represent mean values ± s.e.m. Unpaired two-tailed t-test is used for comparison. ***p < 0.001, **p < 0.01. Source numerical data are available in source data. Source data

References

    1. Olzmann JA, Carvalho P. Dynamics and functions of lipid droplets. Nat. Rev. Mol. Cell Biol. 2019;20:137–155. doi: 10.1038/s41580-018-0085-z. - DOI - PMC - PubMed
    1. Goldberg IJ, et al. Deciphering the role of lipid droplets in cardiovascular disease: a report From the 2017 National Heart, Lung, and Blood Institute Workshop. Circulation. 2018;138:305–315. doi: 10.1161/CIRCULATIONAHA.118.033704. - DOI - PMC - PubMed
    1. Jacob S. Lipid droplet accumulation in the heart during fasting. Acta Histochem. 1987;82:149–152. doi: 10.1016/S0065-1281(87)80020-X. - DOI - PubMed
    1. Listenberger LL, et al. Triglyceride accumulation protects against fatty acid-induced lipotoxicity. Proc. Natl Acad. Sci. USA. 2003;100:3077–3082. doi: 10.1073/pnas.0630588100. - DOI - PMC - PubMed
    1. Sharma S, et al. Intramyocardial lipid accumulation in the failing human heart resembles the lipotoxic rat heart. FASEB J. 2004;18:1692–1700. doi: 10.1096/fj.04-2263com. - DOI - PubMed

Publication types