

Molecular characterization of human peripheral nerves using desorption electrospray ionization mass spectrometry imaging
- PMID: 37264225
- PMCID: PMC10557387
- DOI: 10.1111/joa.13909
Molecular characterization of human peripheral nerves using desorption electrospray ionization mass spectrometry imaging
Abstract
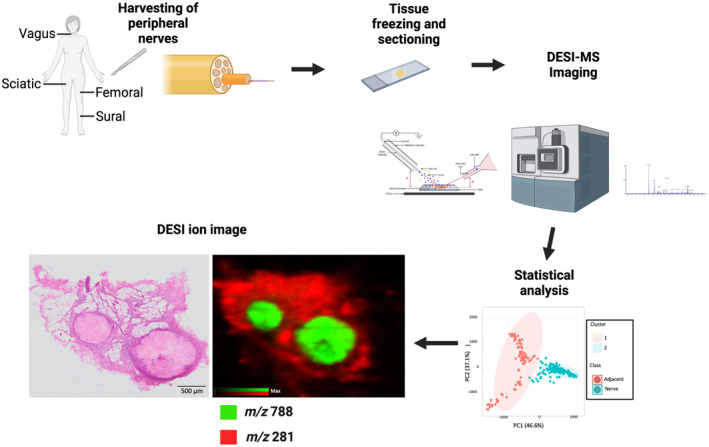
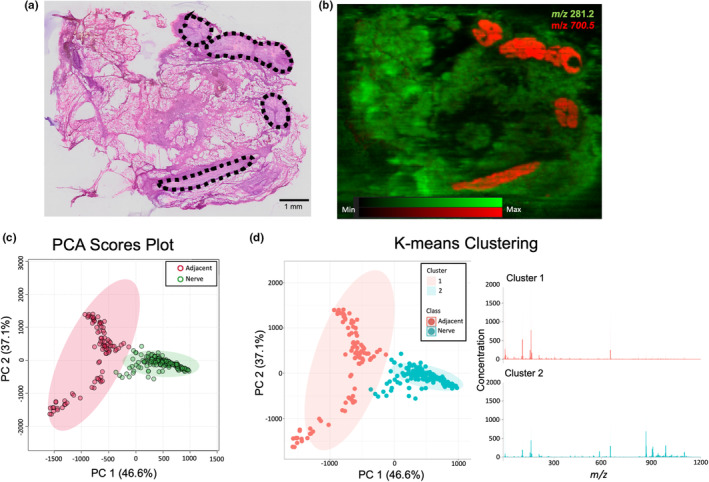
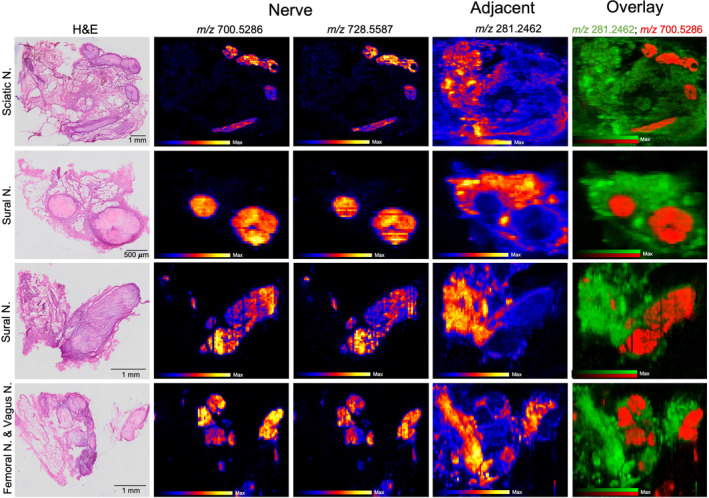
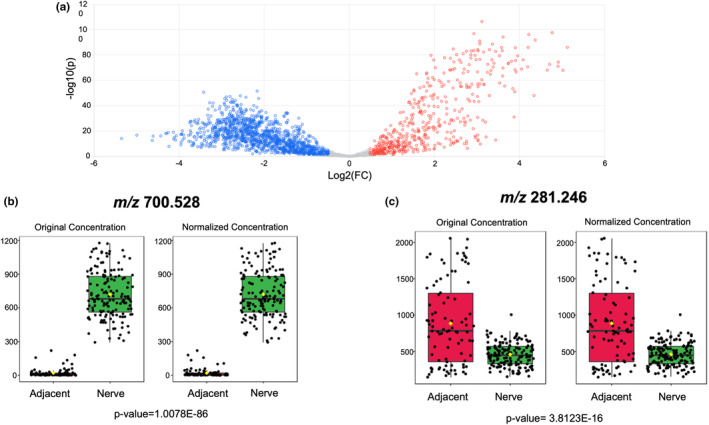
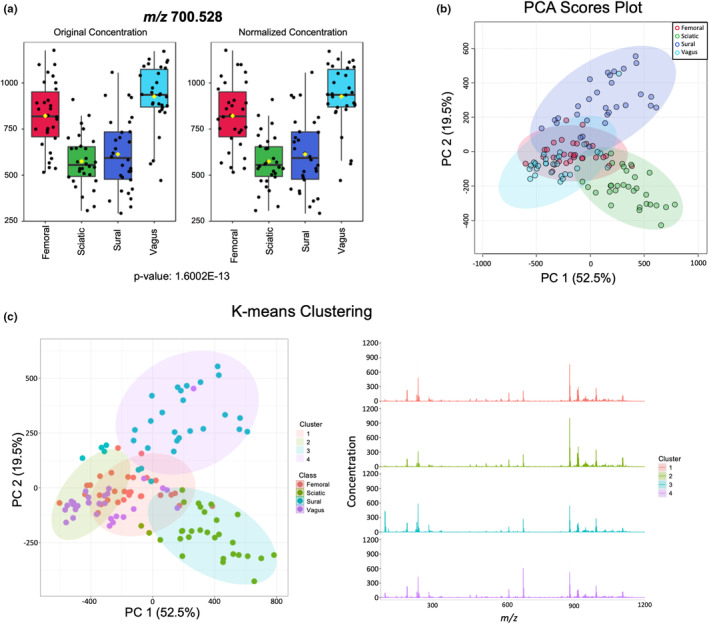
Desorption electrospray ionization mass spectrometry imaging (DESI-MSI) is a molecular imaging method that can be used to elucidate the small-molecule composition of tissues and map their spatial information using two-dimensional ion images. This technique has been used to investigate the molecular profiles of variety of tissues, including within the central nervous system, specifically the brain and spinal cord. To our knowledge, this technique has yet to be applied to tissues of the peripheral nervous system (PNS). Data generated from such analyses are expected to advance the characterization of these structures. The study aimed to: (i) establish whether DESI-MSI can discriminate the molecular characteristics of peripheral nerves and distinguish them from surrounding tissues and (ii) assess whether different peripheral nerve subtypes are characterized by unique molecular profiles. Four different nerves for which are known to carry various nerve fiber types were harvested from a fresh cadaveric donor: mixed, motor and sensory (sciatic and femoral); cutaneous, sensory (sural); and autonomic (vagus). Tissue samples were harvested to include the nerve bundles in addition to surrounding connective tissue. Samples were flash-frozen, embedded in optimal cutting temperature compound in cross-section, and sectioned at 14 μm. Following DESI-MSI analysis, identical tissue sections were stained with hematoxylin and eosin. In this proof-of-concept study, a combination of multivariate and univariate statistical methods was used to evaluate molecular differences between the nerve and adjacent tissue and between nerve subtypes. The acquired mass spectral profiles of the peripheral nerve samples presented trends in ion abundances that seemed to be characteristic of nerve tissue and spatially corresponded to the associated histology of the tissue sections. Principal component analysis (PCA) supported the separation of the samples into distinct nerve and adjacent tissue classes. This classification was further supported by the K-means clustering analysis, which showed separation of the nerve and background ions. Differences in ion expression were confirmed using ANOVA which identified statistically significant differences in ion expression between the nerve subtypes. The PCA plot suggested some separation of the nerve subtypes into four classes which corresponded with the nerve types. This was supported by the K-means clustering. Some overlap in classes was noted in these two clustering analyses. This study provides emerging evidence that DESI-MSI is an effective tool for metabolomic profiling of peripheral nerves. Our results suggest that peripheral nerves have molecular profiles that are distinct from the surrounding connective tissues and that DESI-MSI may be able to discriminate between nerve subtypes. DESI-MSI of peripheral nerves may be a valuable technique that could be used to improve our understanding of peripheral nerve anatomy and physiology. The ability to utilize ambient mass spectrometry techniques in real time could also provide an unprecedented advantage for surgical decision making, including in nerve-sparing procedures in the future.
Keywords: DESI-MSI; anatomy; innervation; mass spectrometry imaging; peripheral nerve.
© 2023 The Authors. Journal of Anatomy published by John Wiley & Sons Ltd on behalf of Anatomical Society.
Figures
References
-
- Adam, S. , Martin‐Diener, E. , Camey, B. , Egger Hayoz, C. , Konzelmann, I. , Mohsen Mousavi, S. et al. (2020) Health‐related quality of life in long‐term prostate cancer survivors after nerve‐sparing and non‐nerve‐sparing radical prostatectomy—results from the multiregional PROCAS study. Cancer Medicine, 9(15), 5416–5424. - PMC - PubMed
-
- Amend, B. , Hennenlotter, J. , Kuehs, U. , Laible, I. , Anastasiadis, A. , Schilling, D. et al. (2013) Prostatic peripheral nerve distribution may impact the functional outcome of nerve‐sparing prostatectomy. World Journal of Urology, 31(2), 377–382. - PubMed
-
- Banerjee, S. , Zare, R.N. , Tibshirani, R.J. , Kunder, C.A. , Nolley, R. , Fan, R. et al. (2017) Diagnosis of prostate cancer by desorption electrospray ionization mass spectrometric imaging of small metabolites and lipids. Proceedings of the National Academy of Sciences of the United States of America, 114(13), 3334–3339. - PMC - PubMed
-
- Calligaris, D. , Caragacianu, D. , Liu, X. , Norton, I. , Thompson, C.J. , Richardson, A.L. et al. (2014) Application of desorption electrospray ionization mass spectrometry imaging in breast cancer margin analysis. Proceedings of the National Academy of Sciences of the United States of America, 111(42), 15184–15189. - PMC - PubMed
MeSH terms
LinkOut - more resources
Full Text Sources
