. 2023 Jul;24(7):1087-1097.
doi: 10.1038/s41590-023-01523-z. Epub 2023 Jun 1.

HLA class I signal peptide polymorphism determines the level of CD94/NKG2-HLA-E-mediated regulation of effector cell responses

Affiliations

HLA class I signal peptide polymorphism determines the level of CD94/NKG2-HLA-E-mediated regulation of effector cell responses

Zhansong Lin et al. Nat Immunol. 2023 Jul.

Abstract

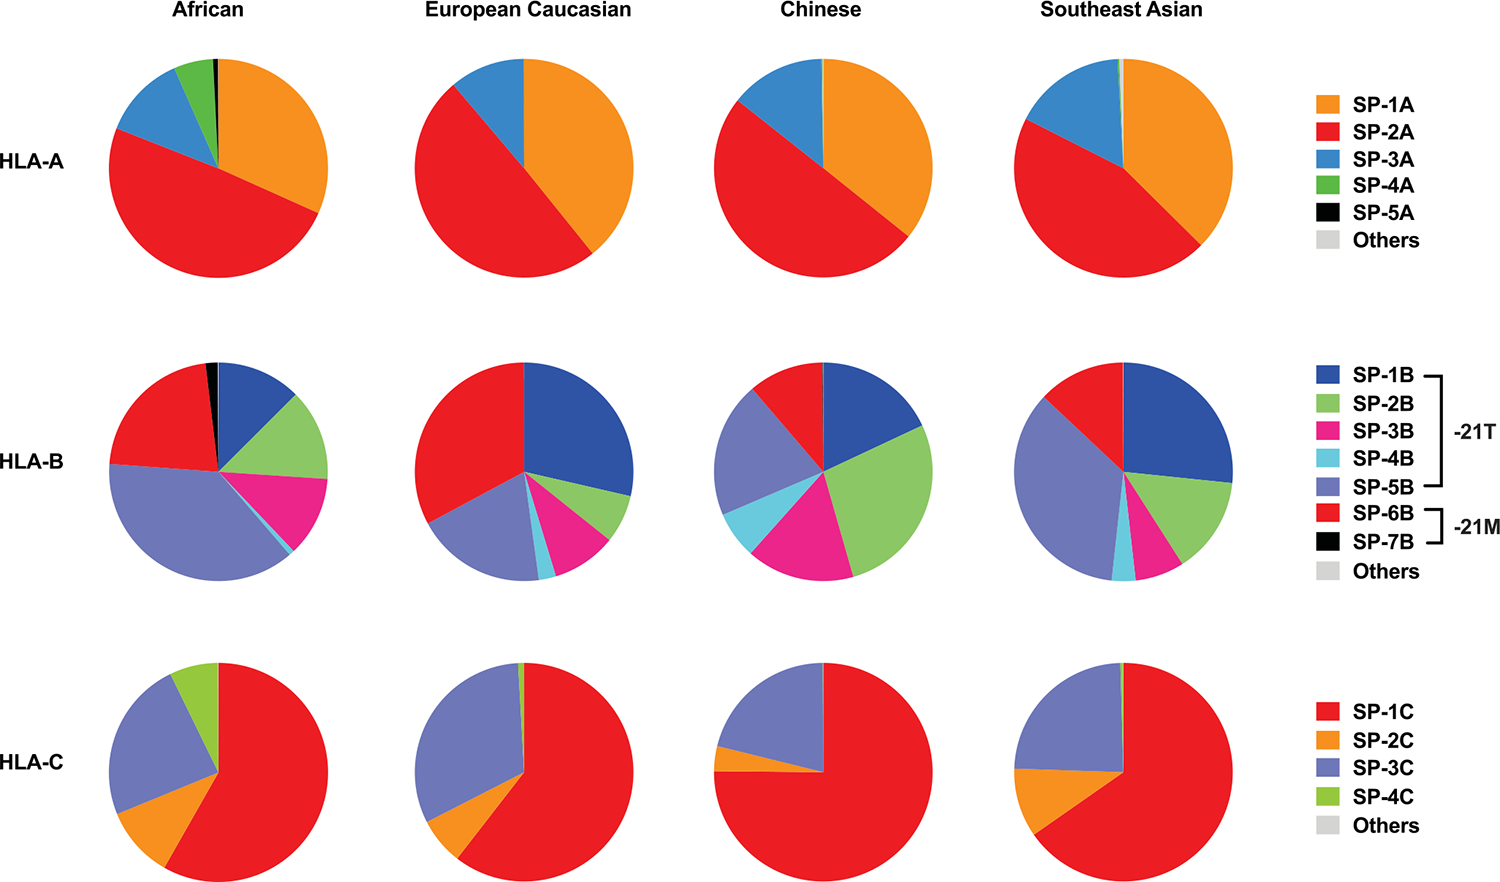
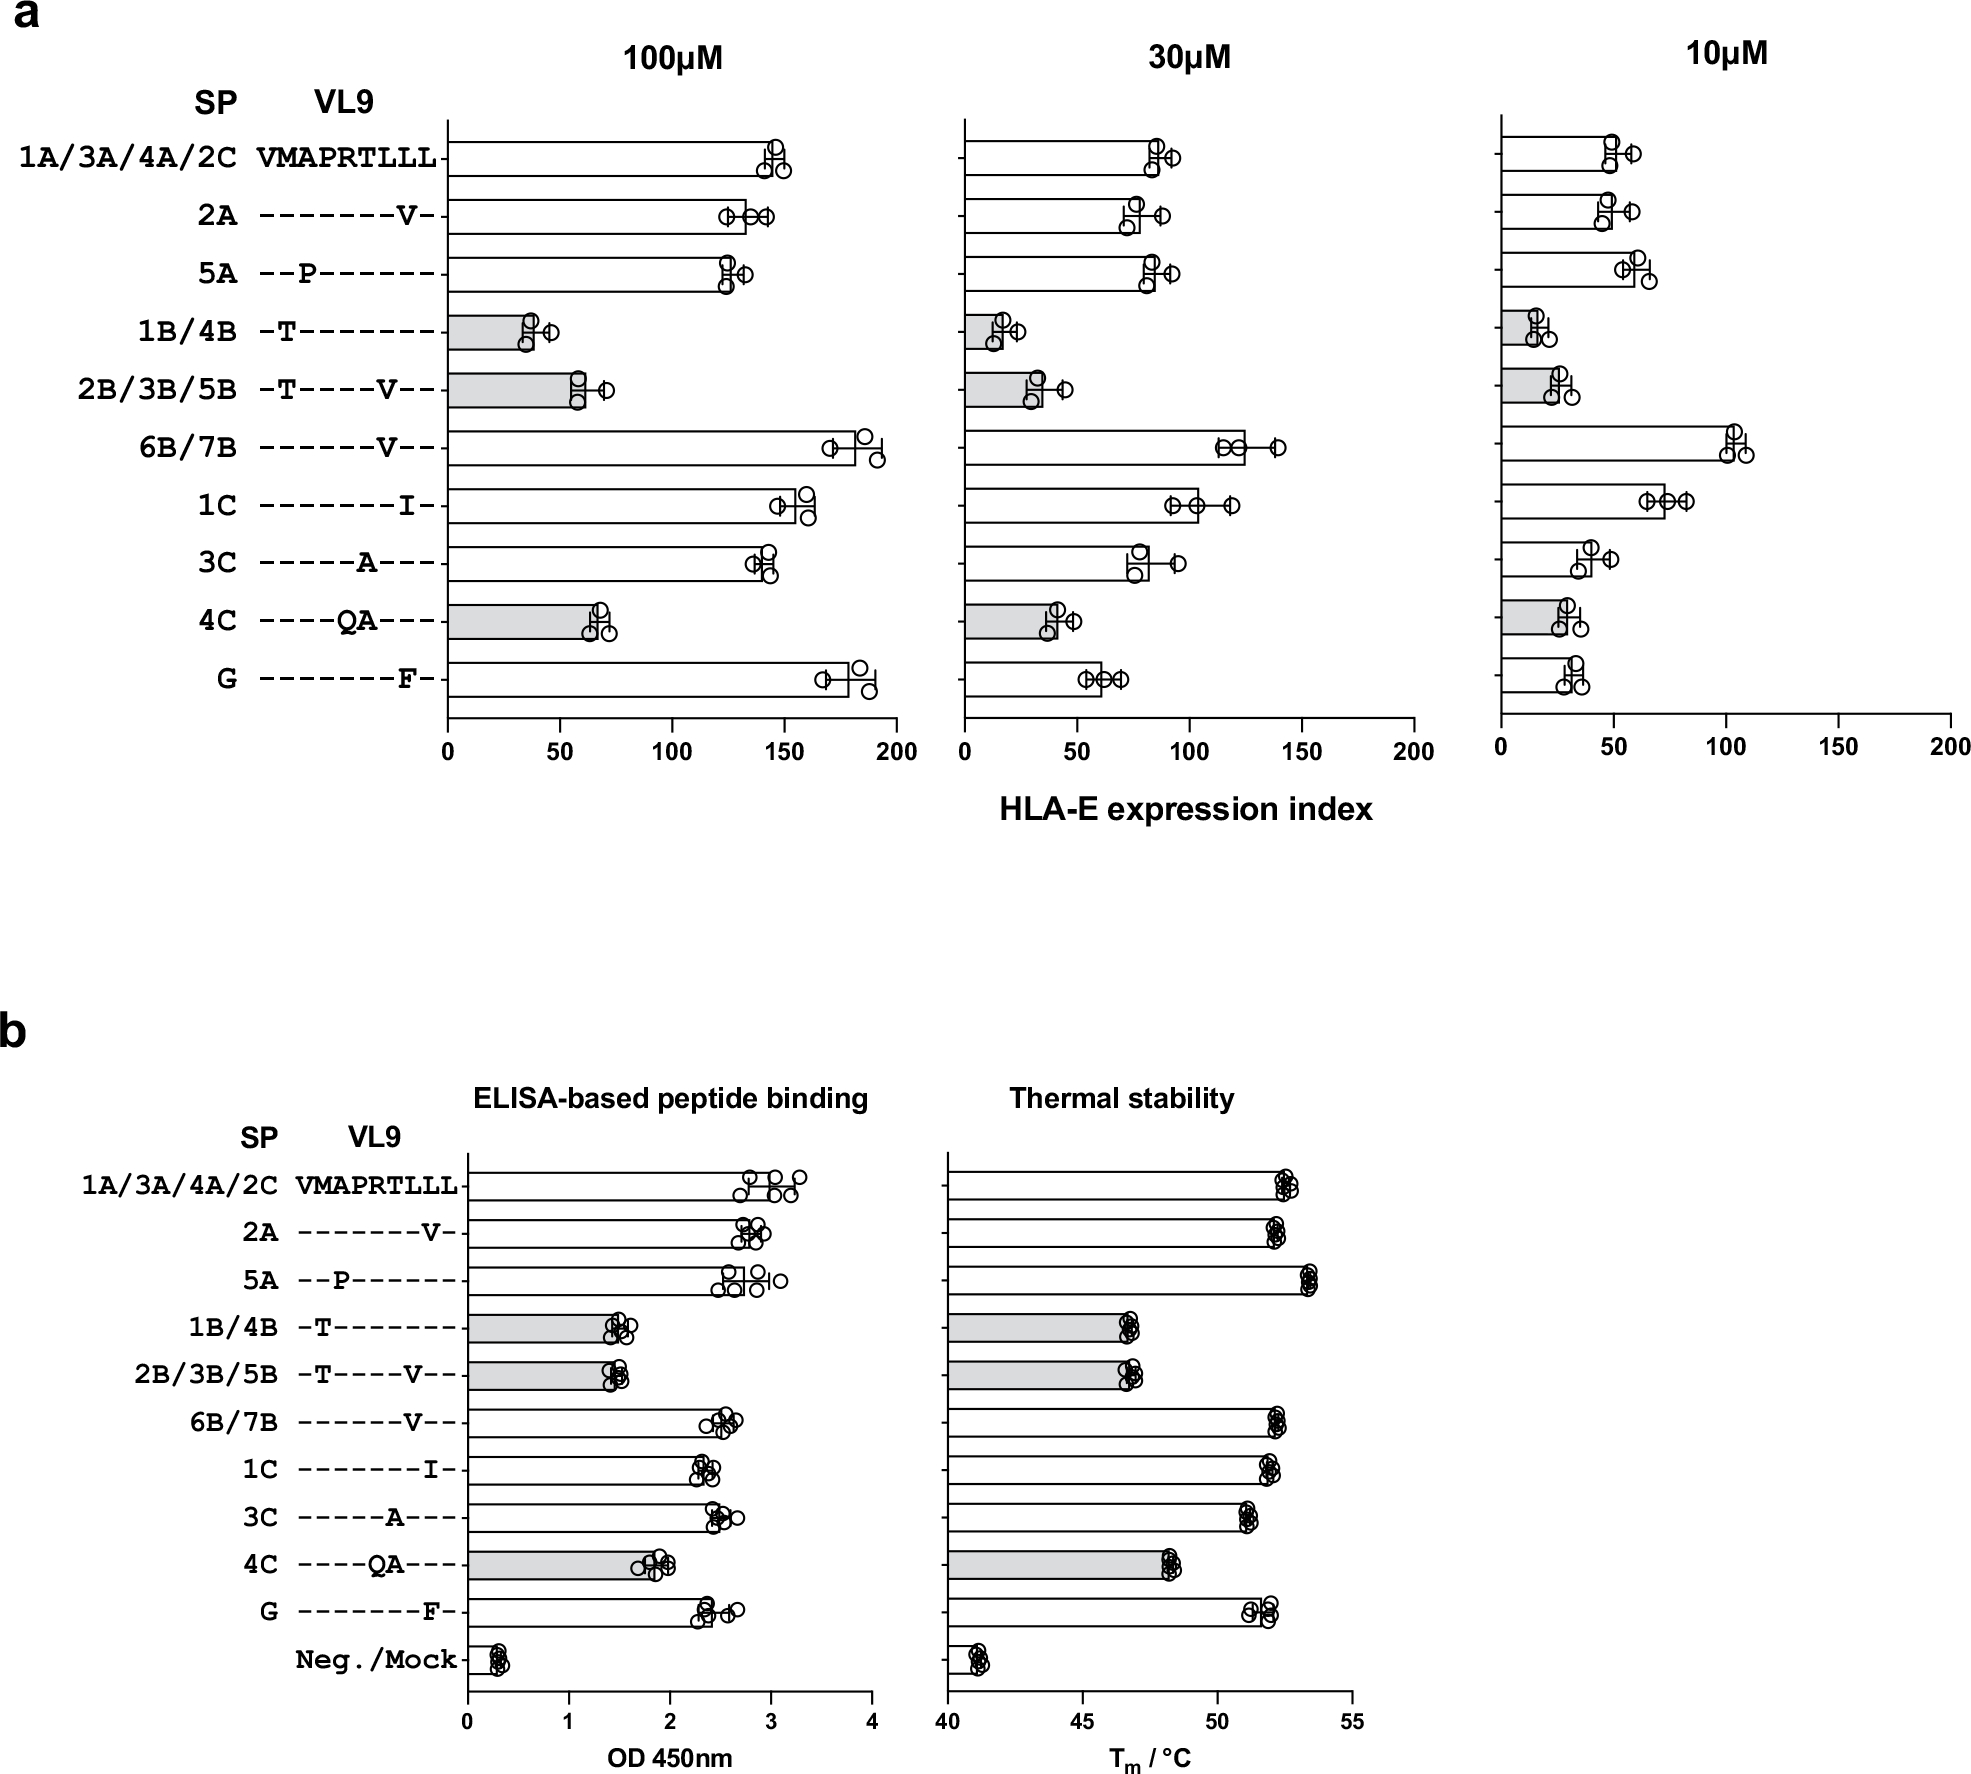
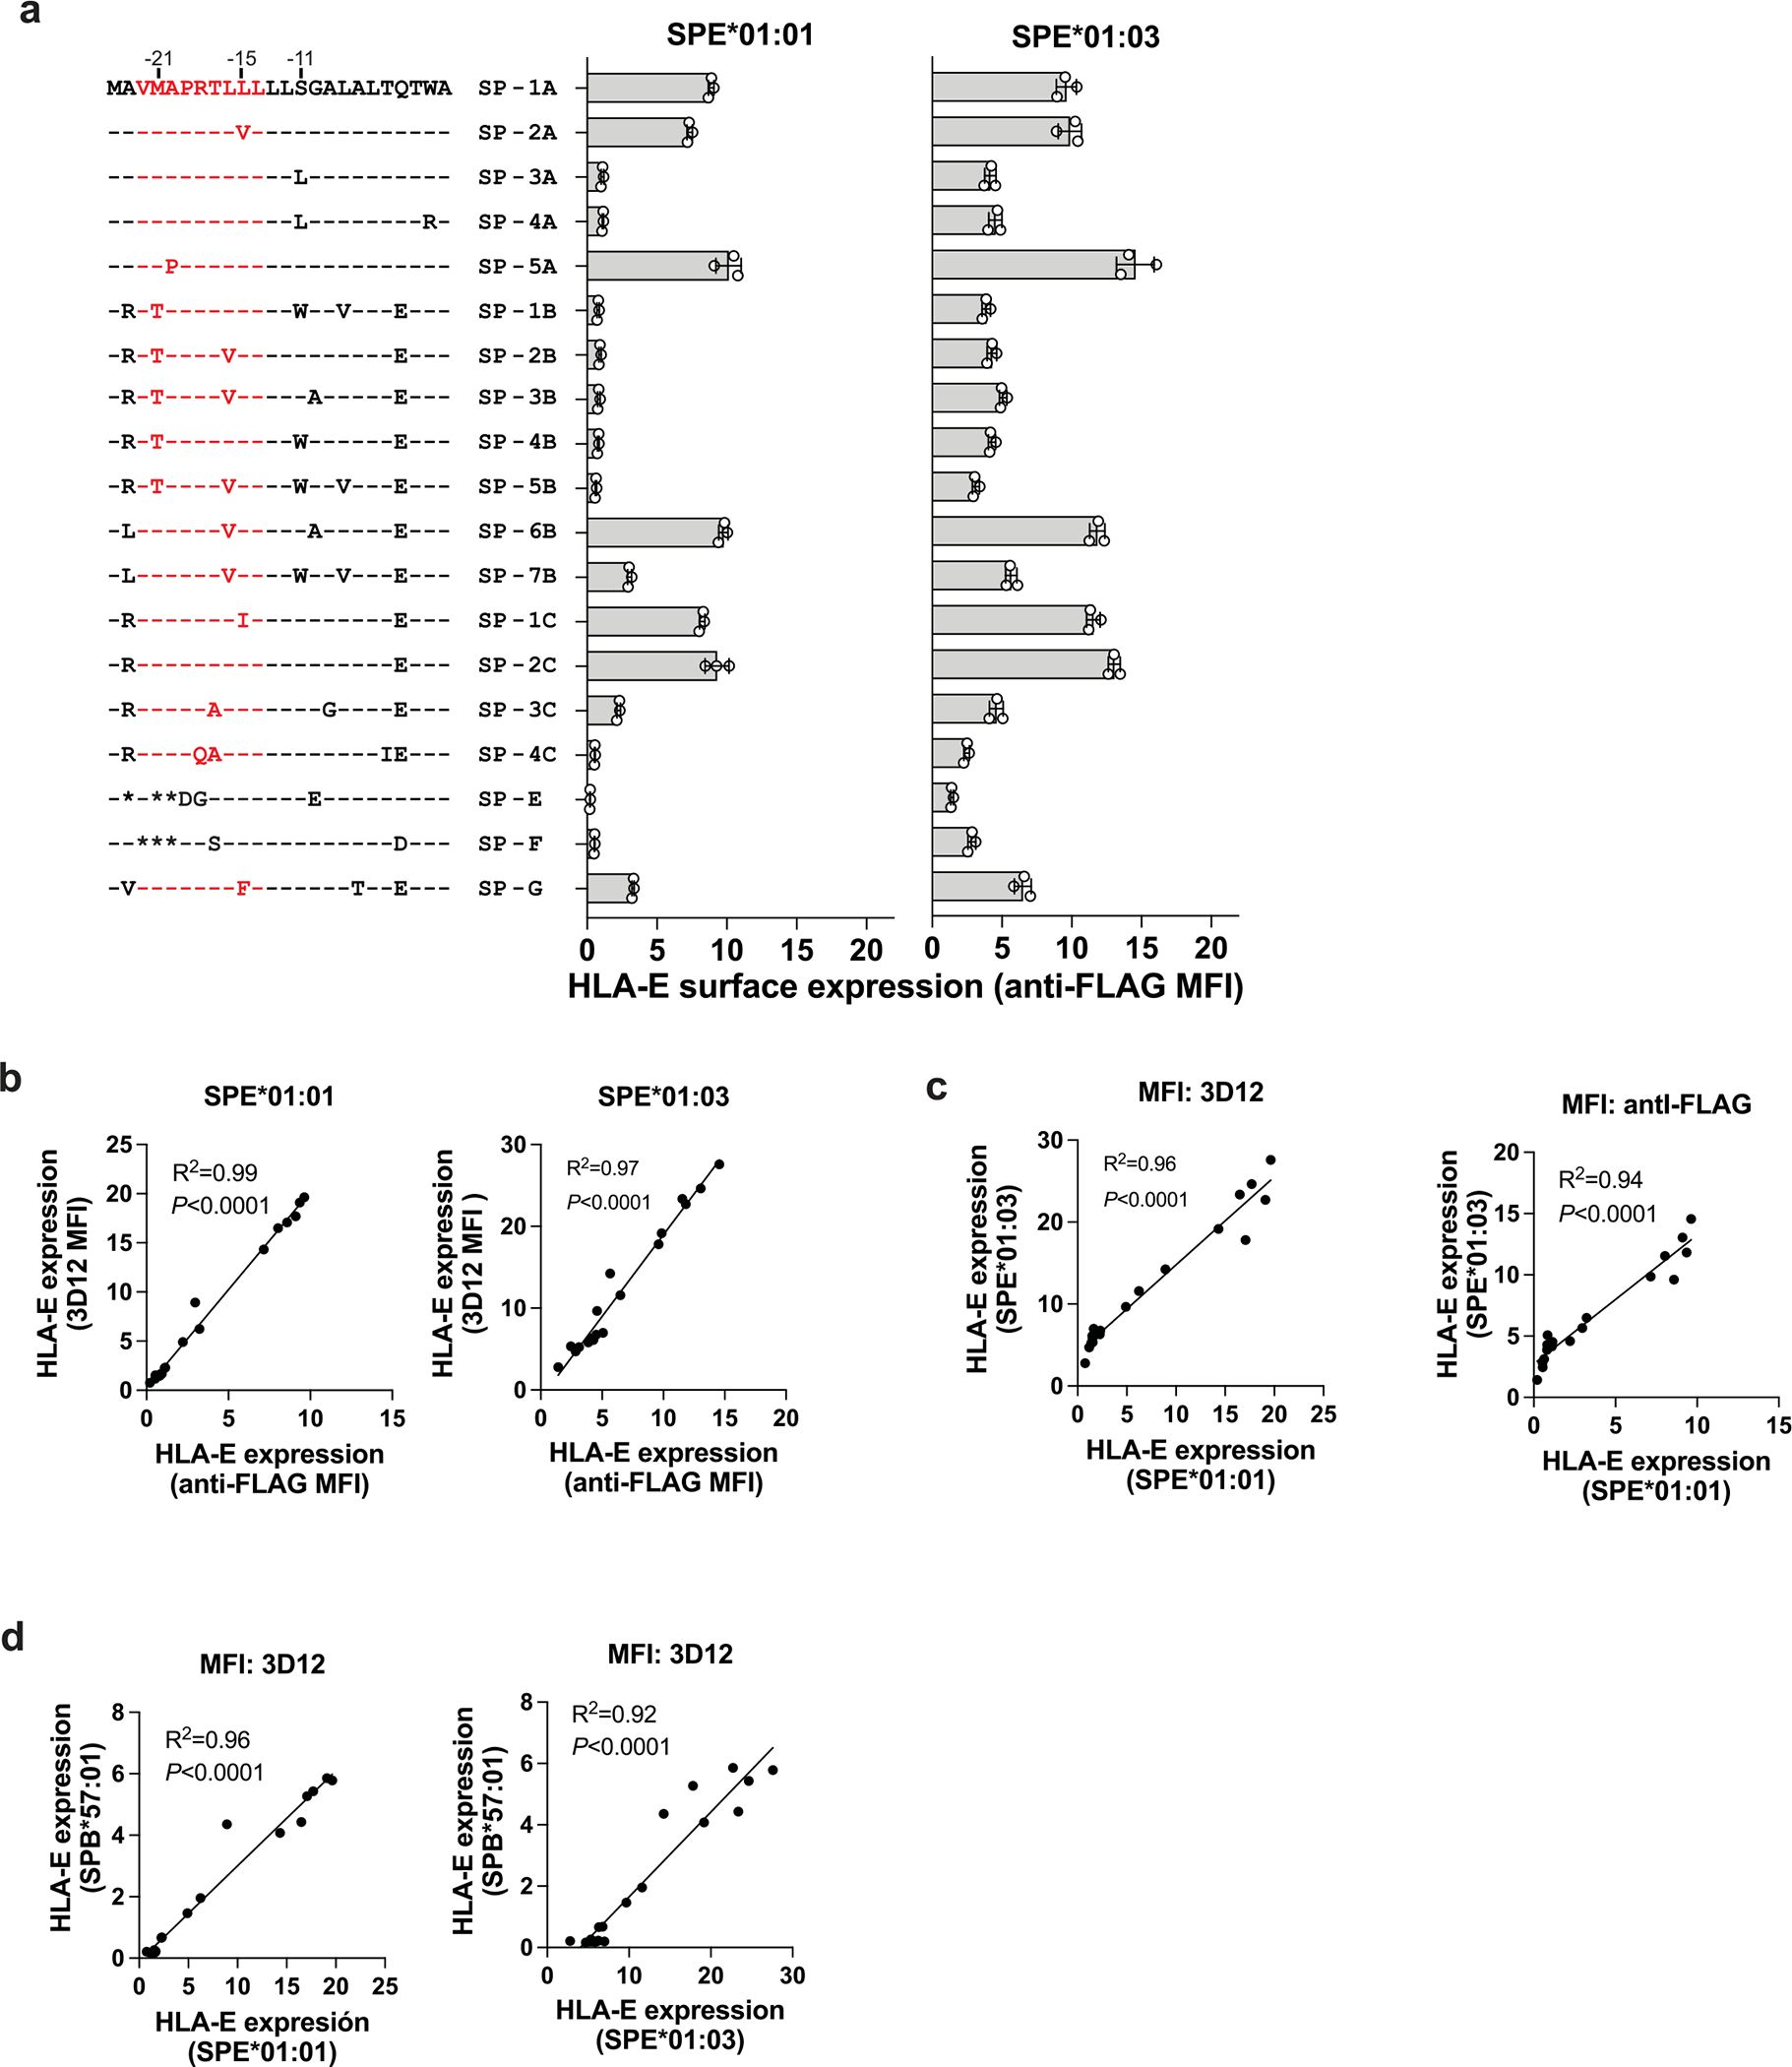
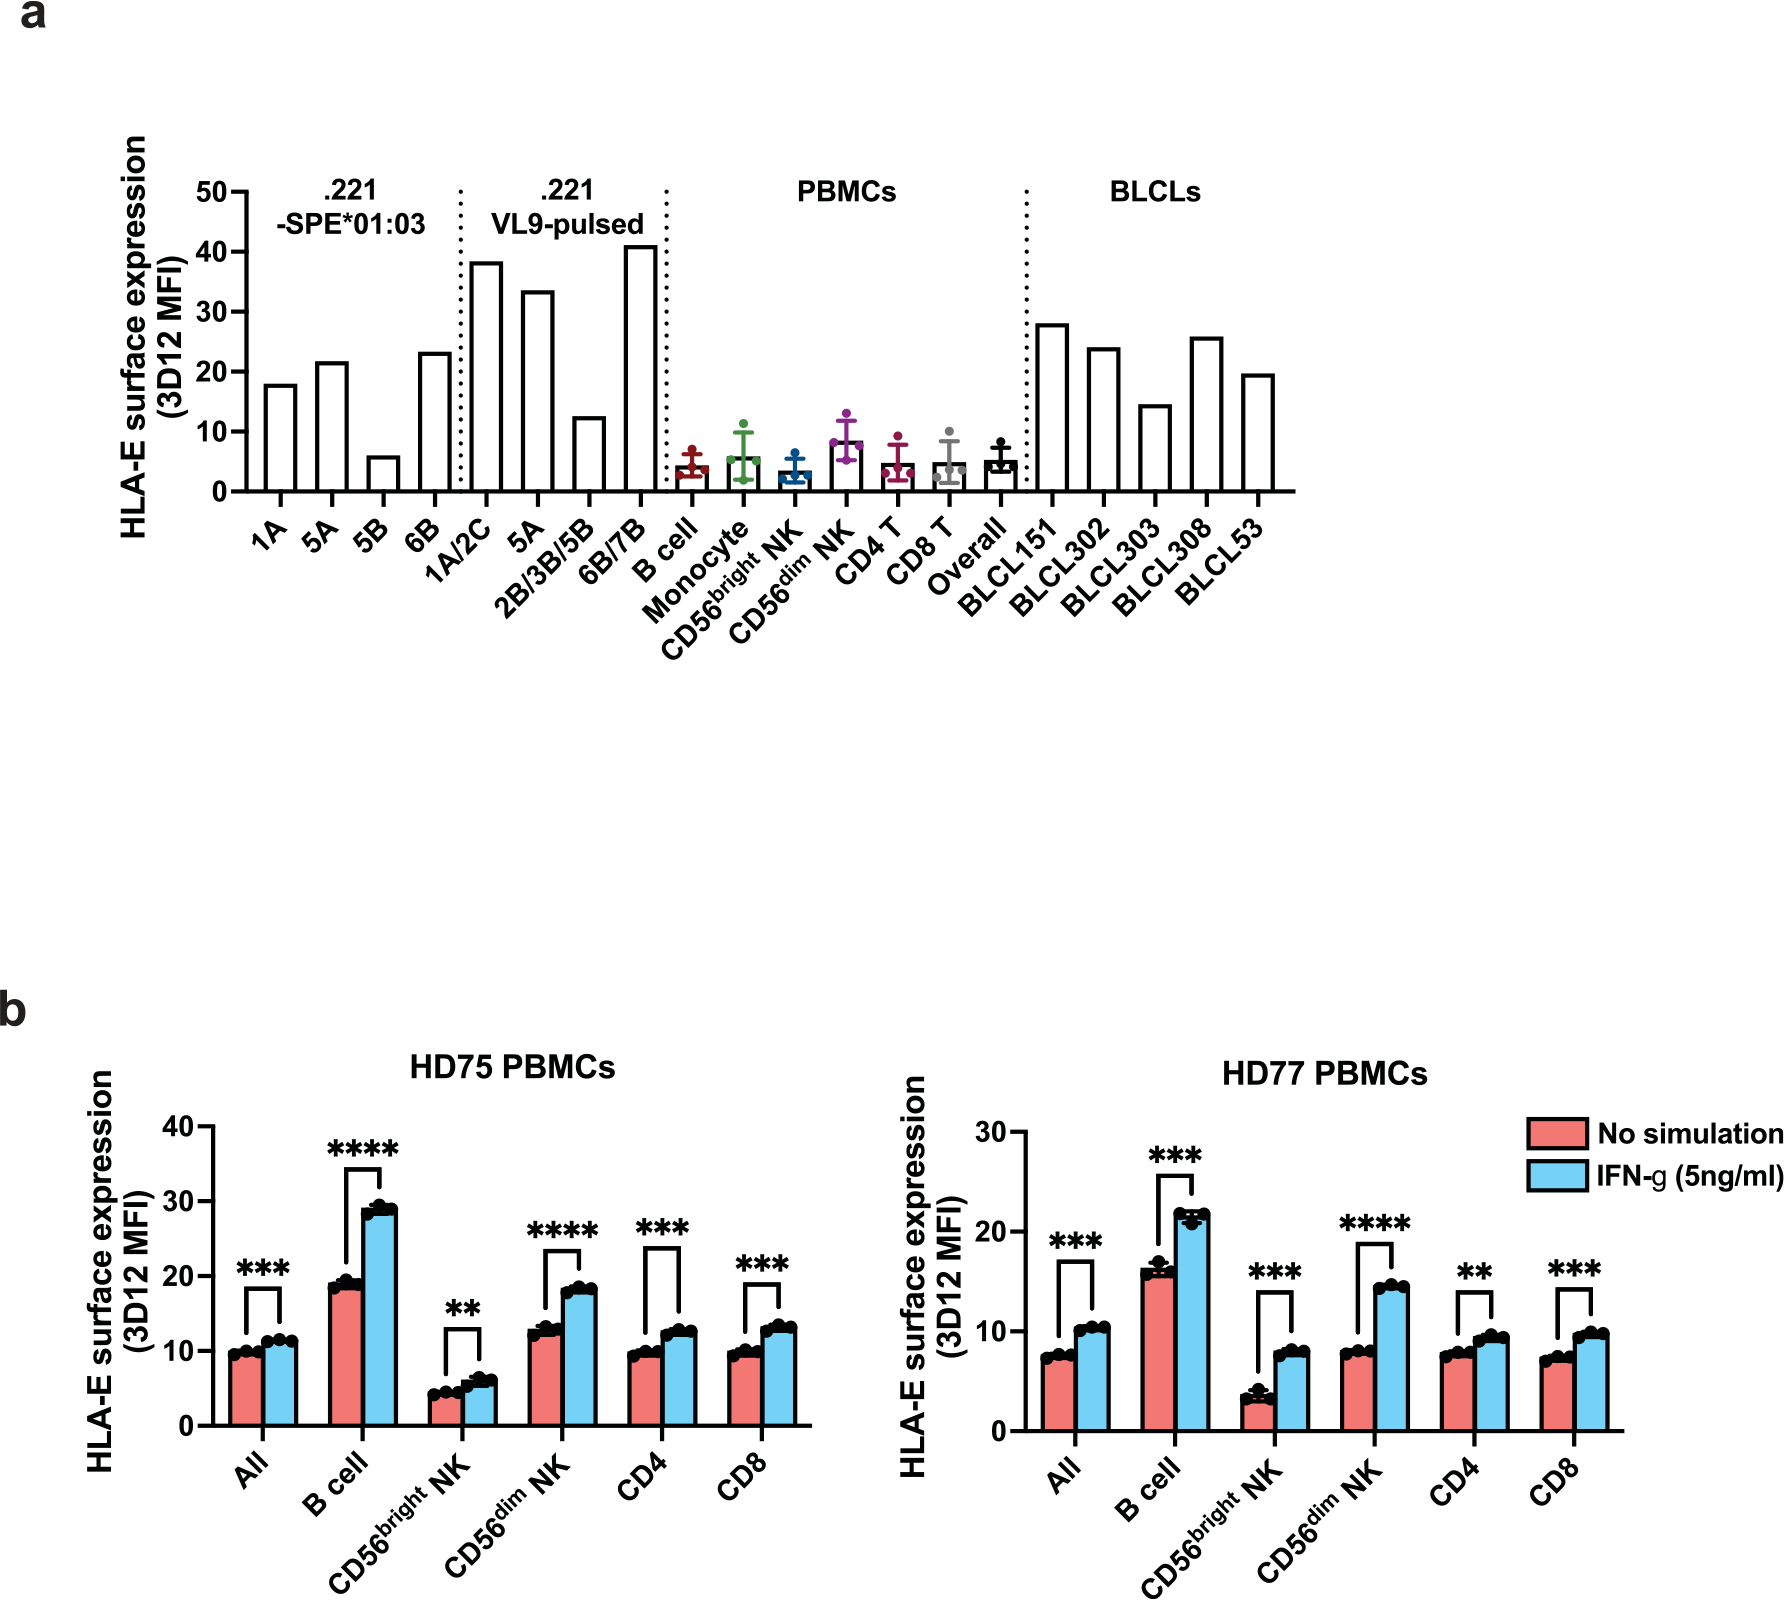
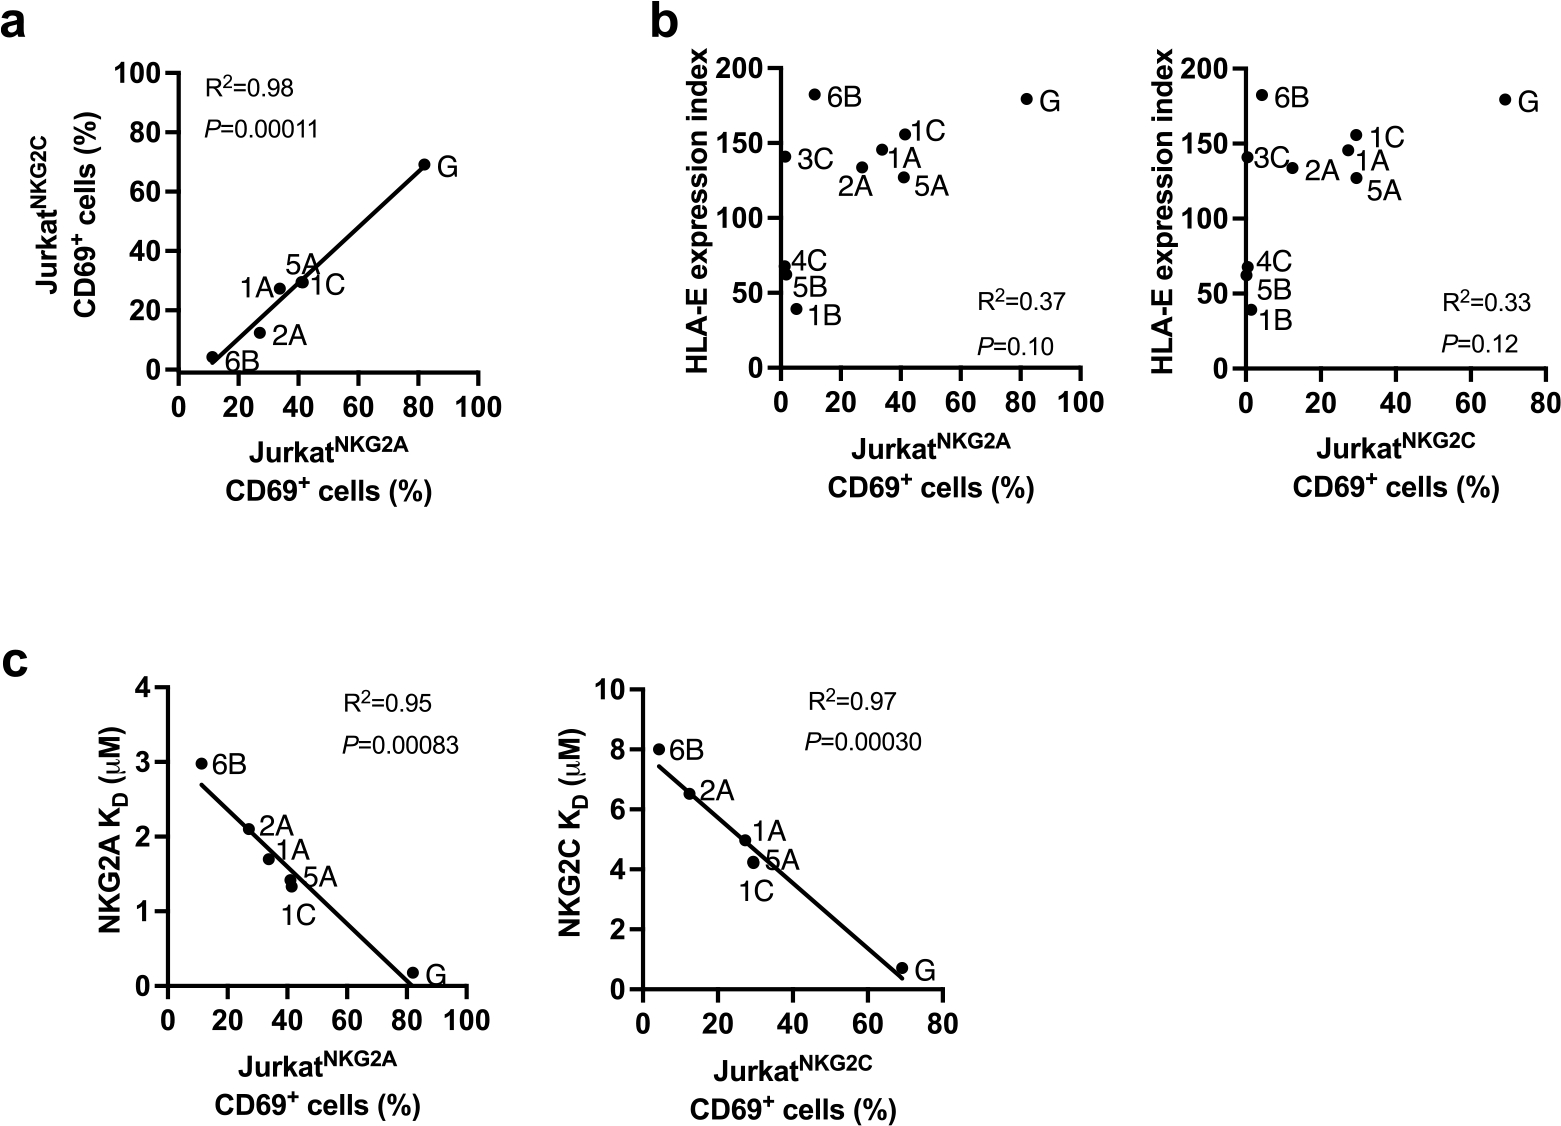
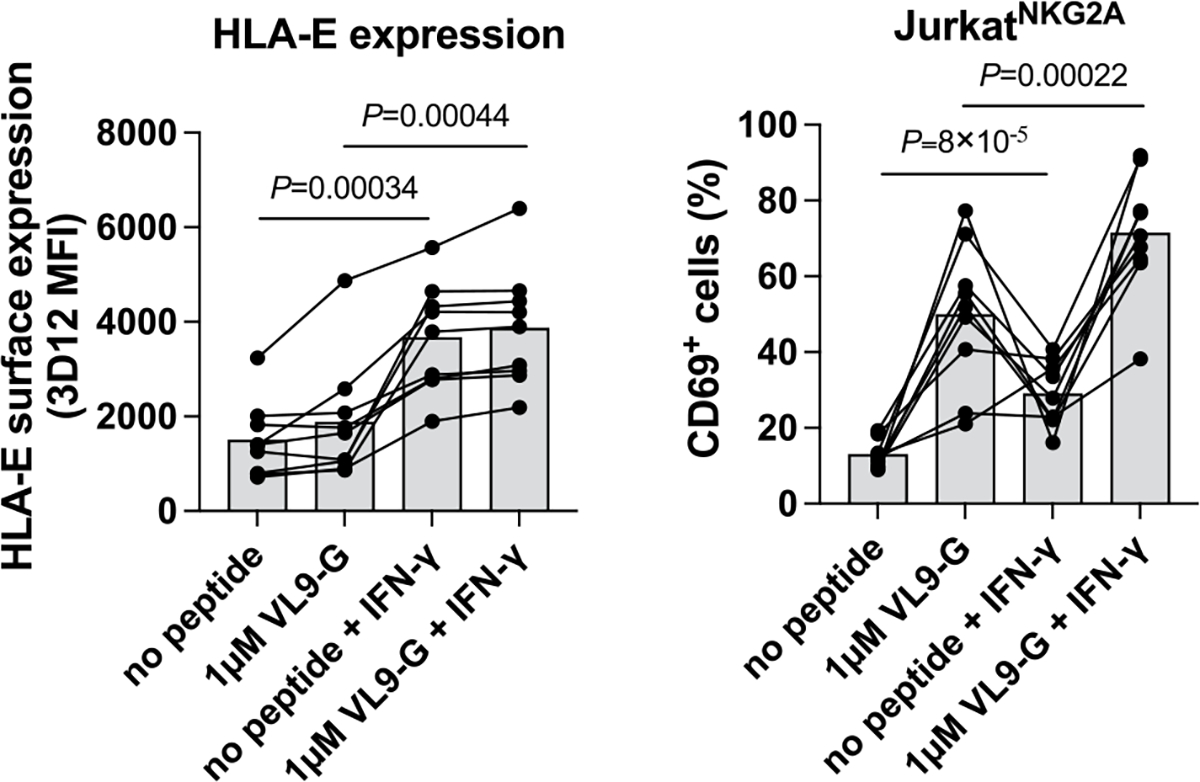
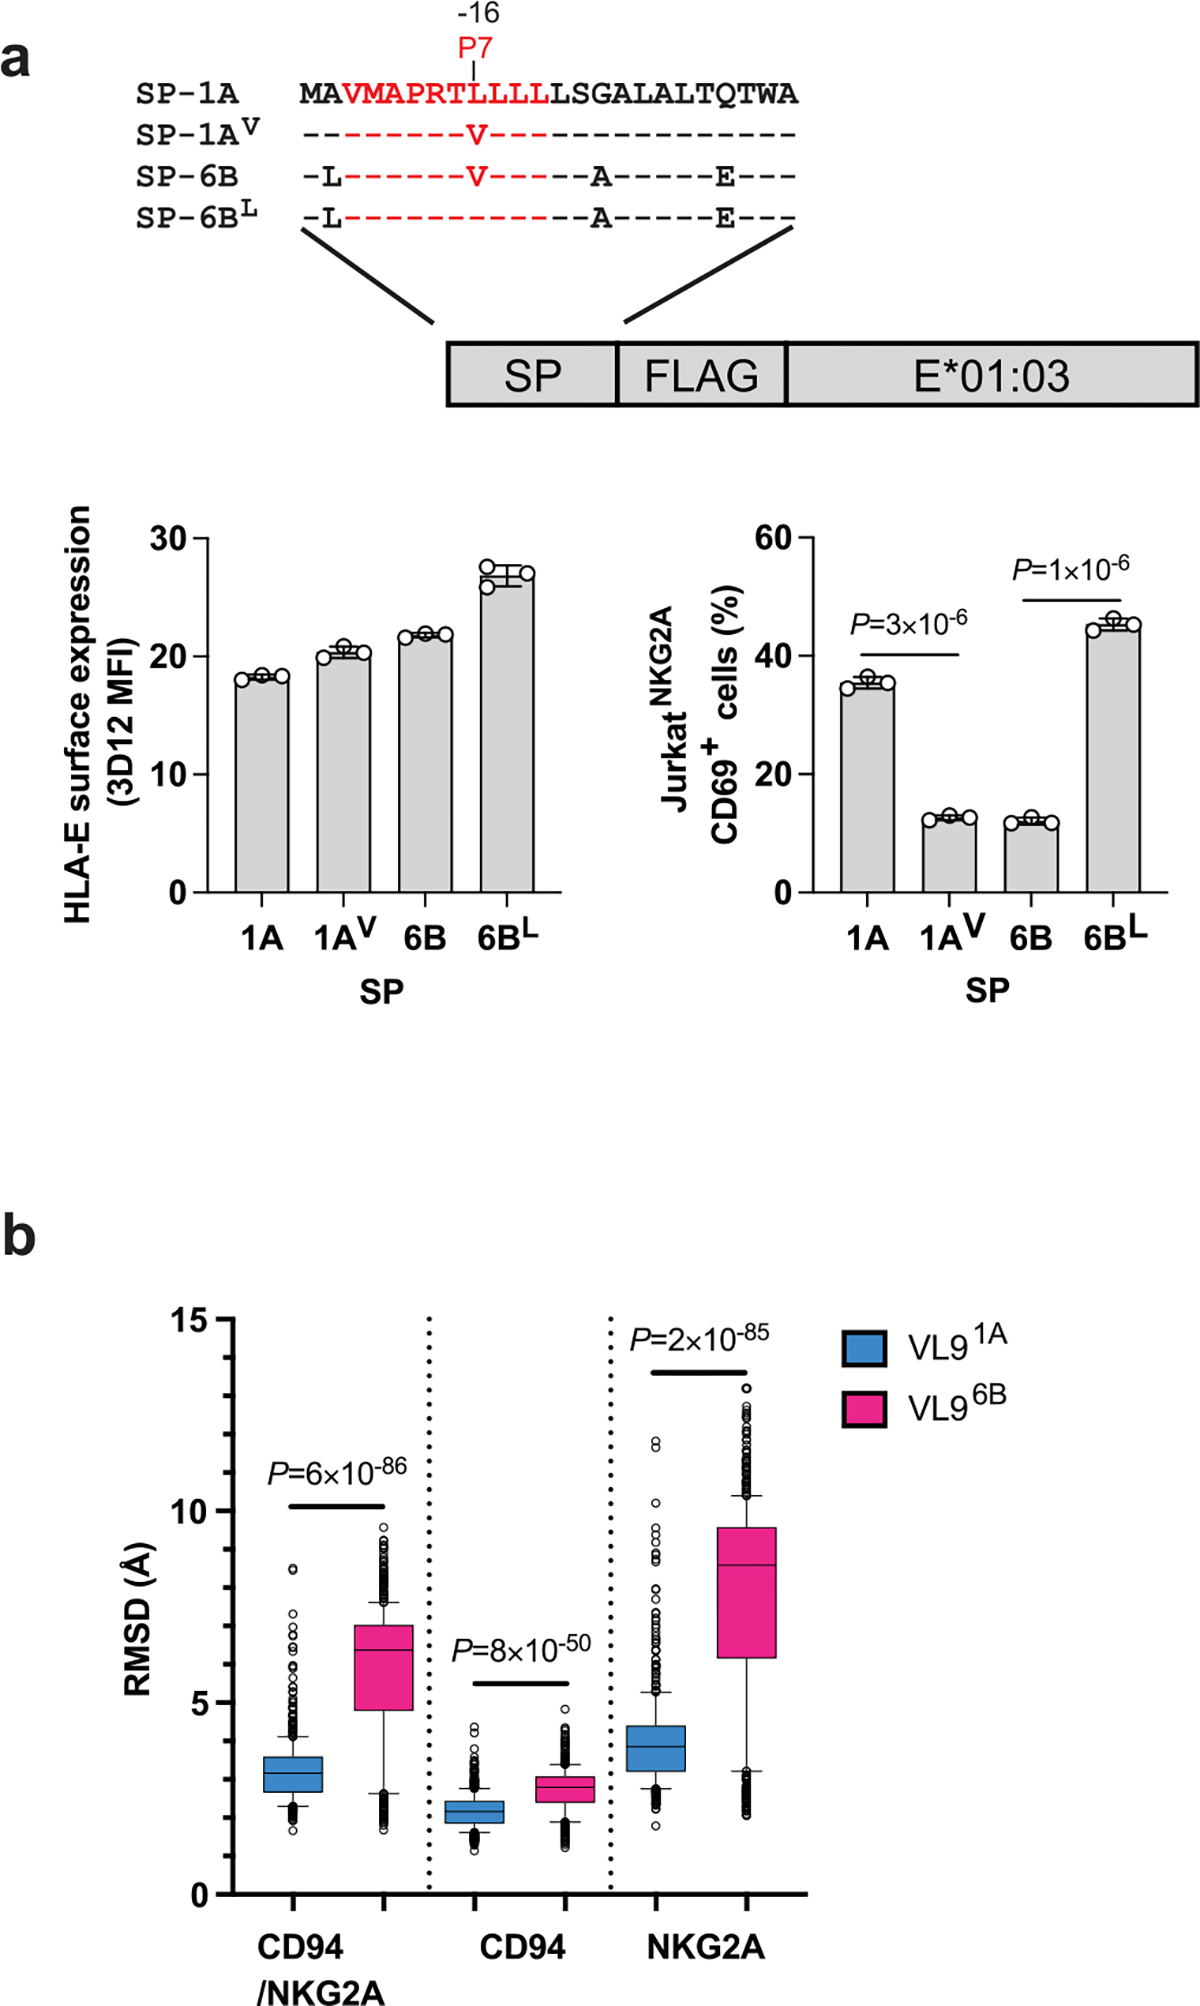
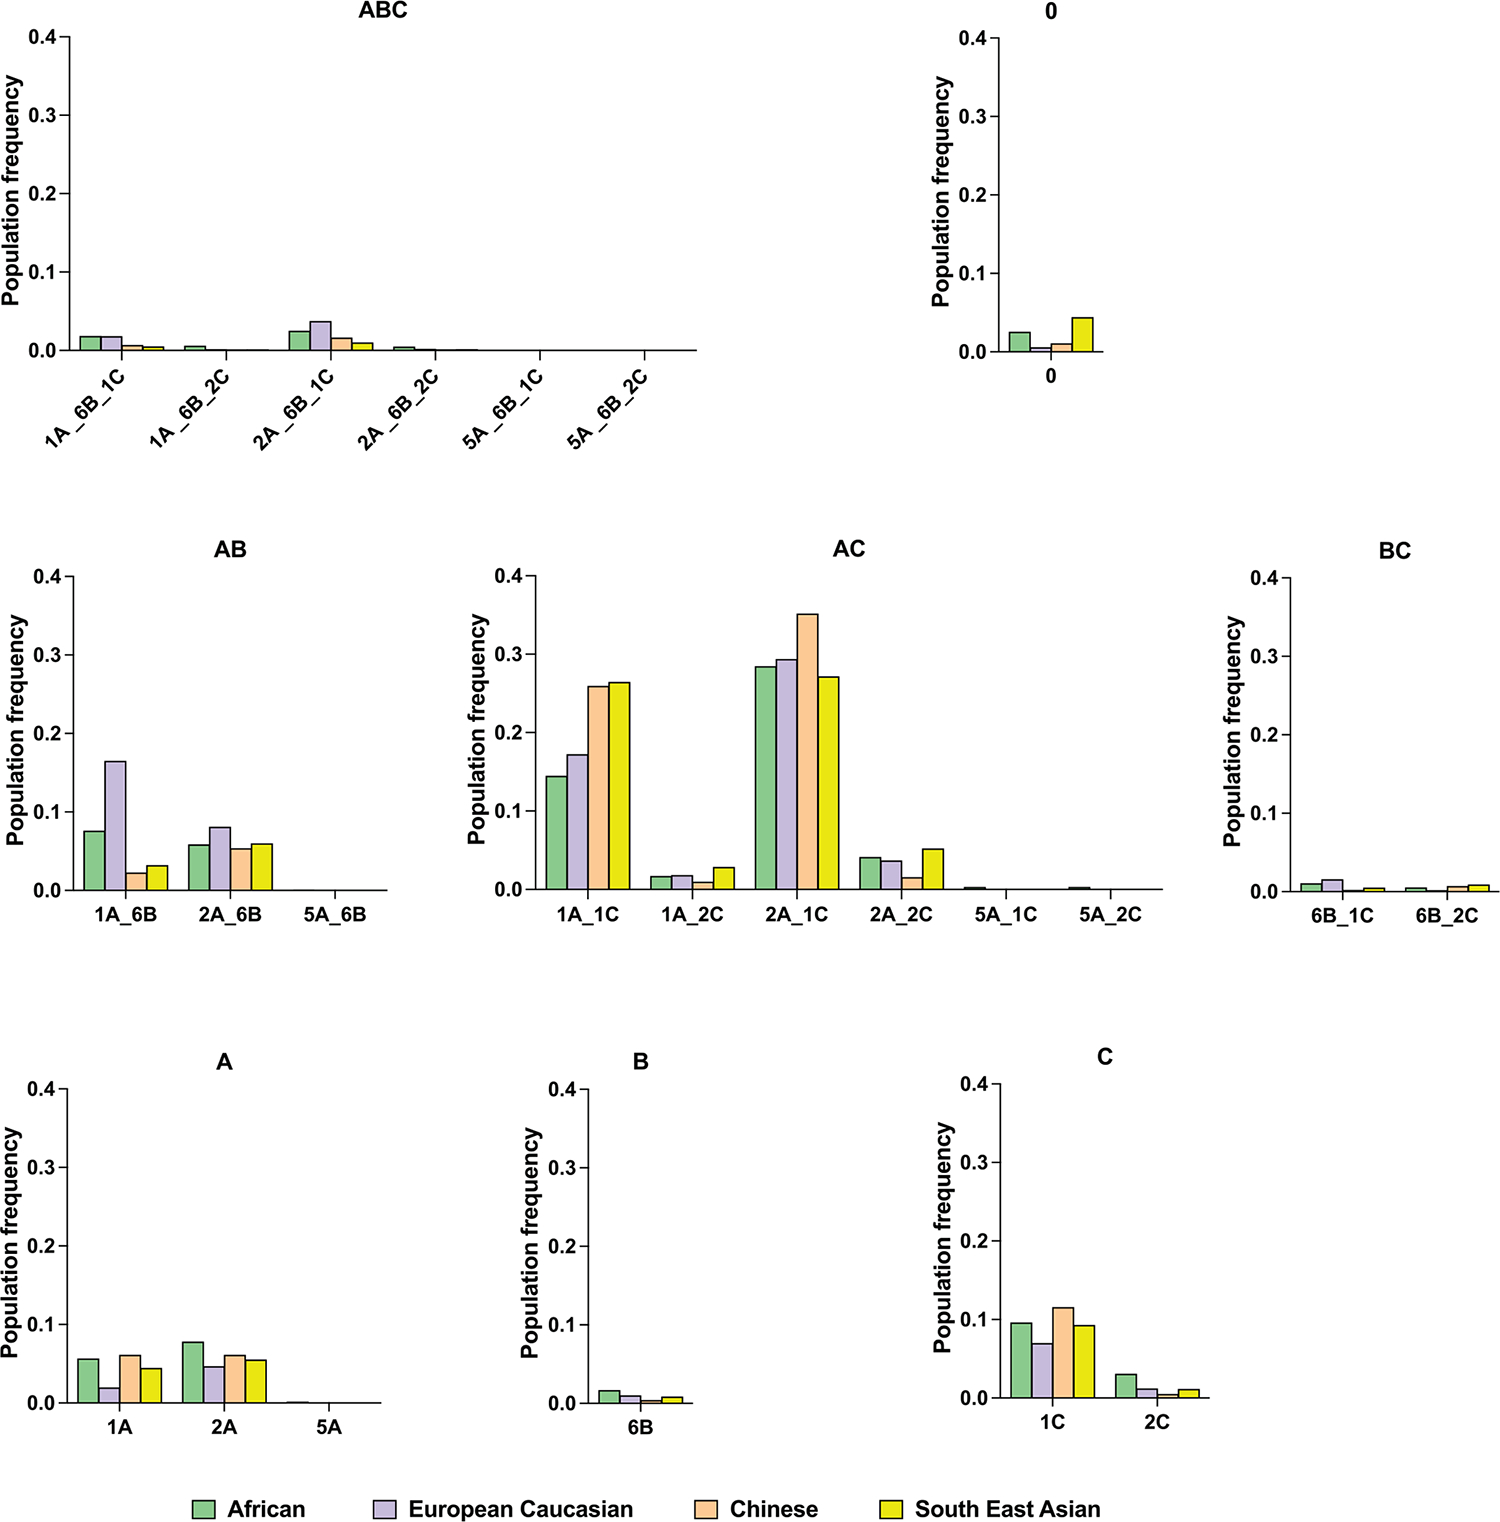
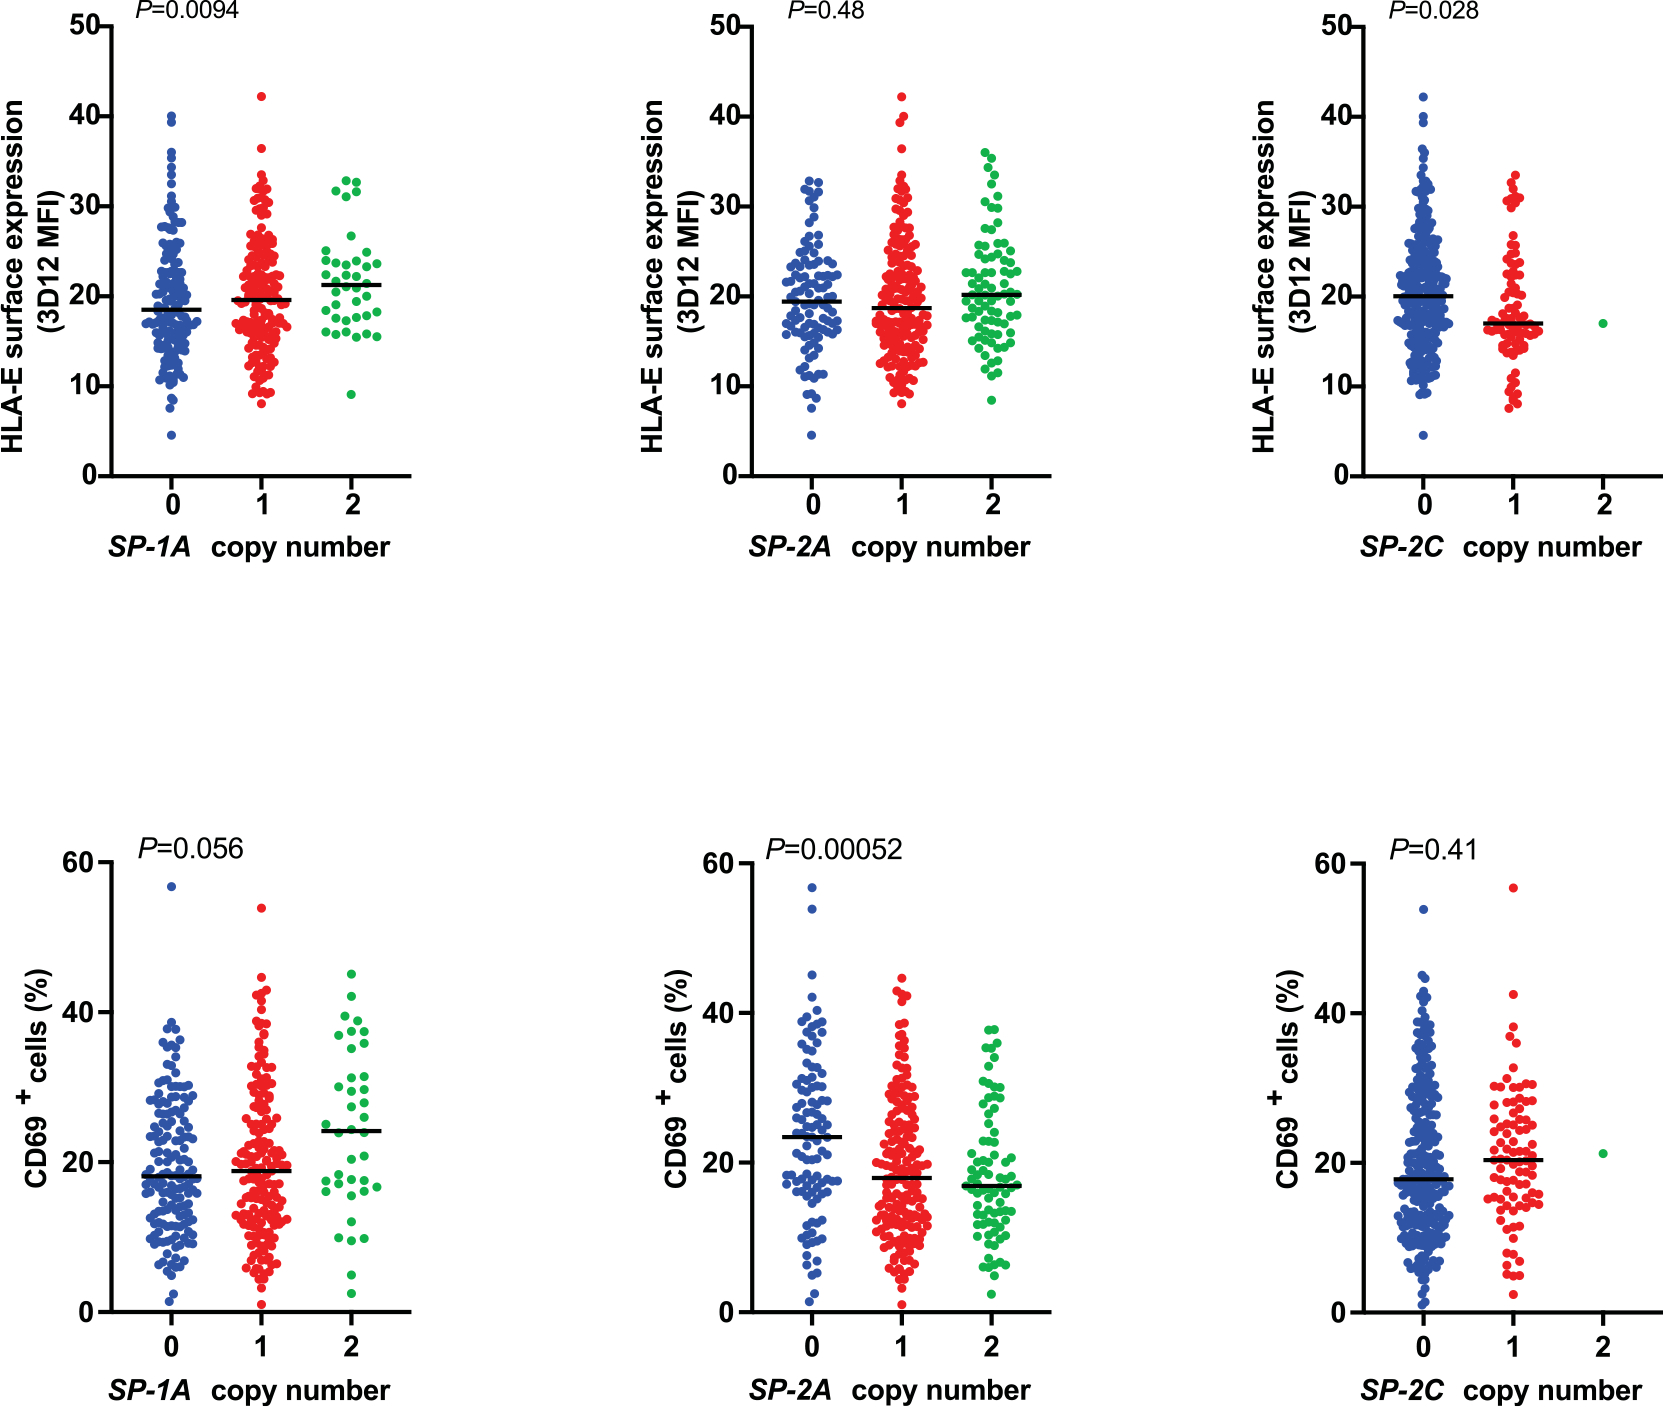
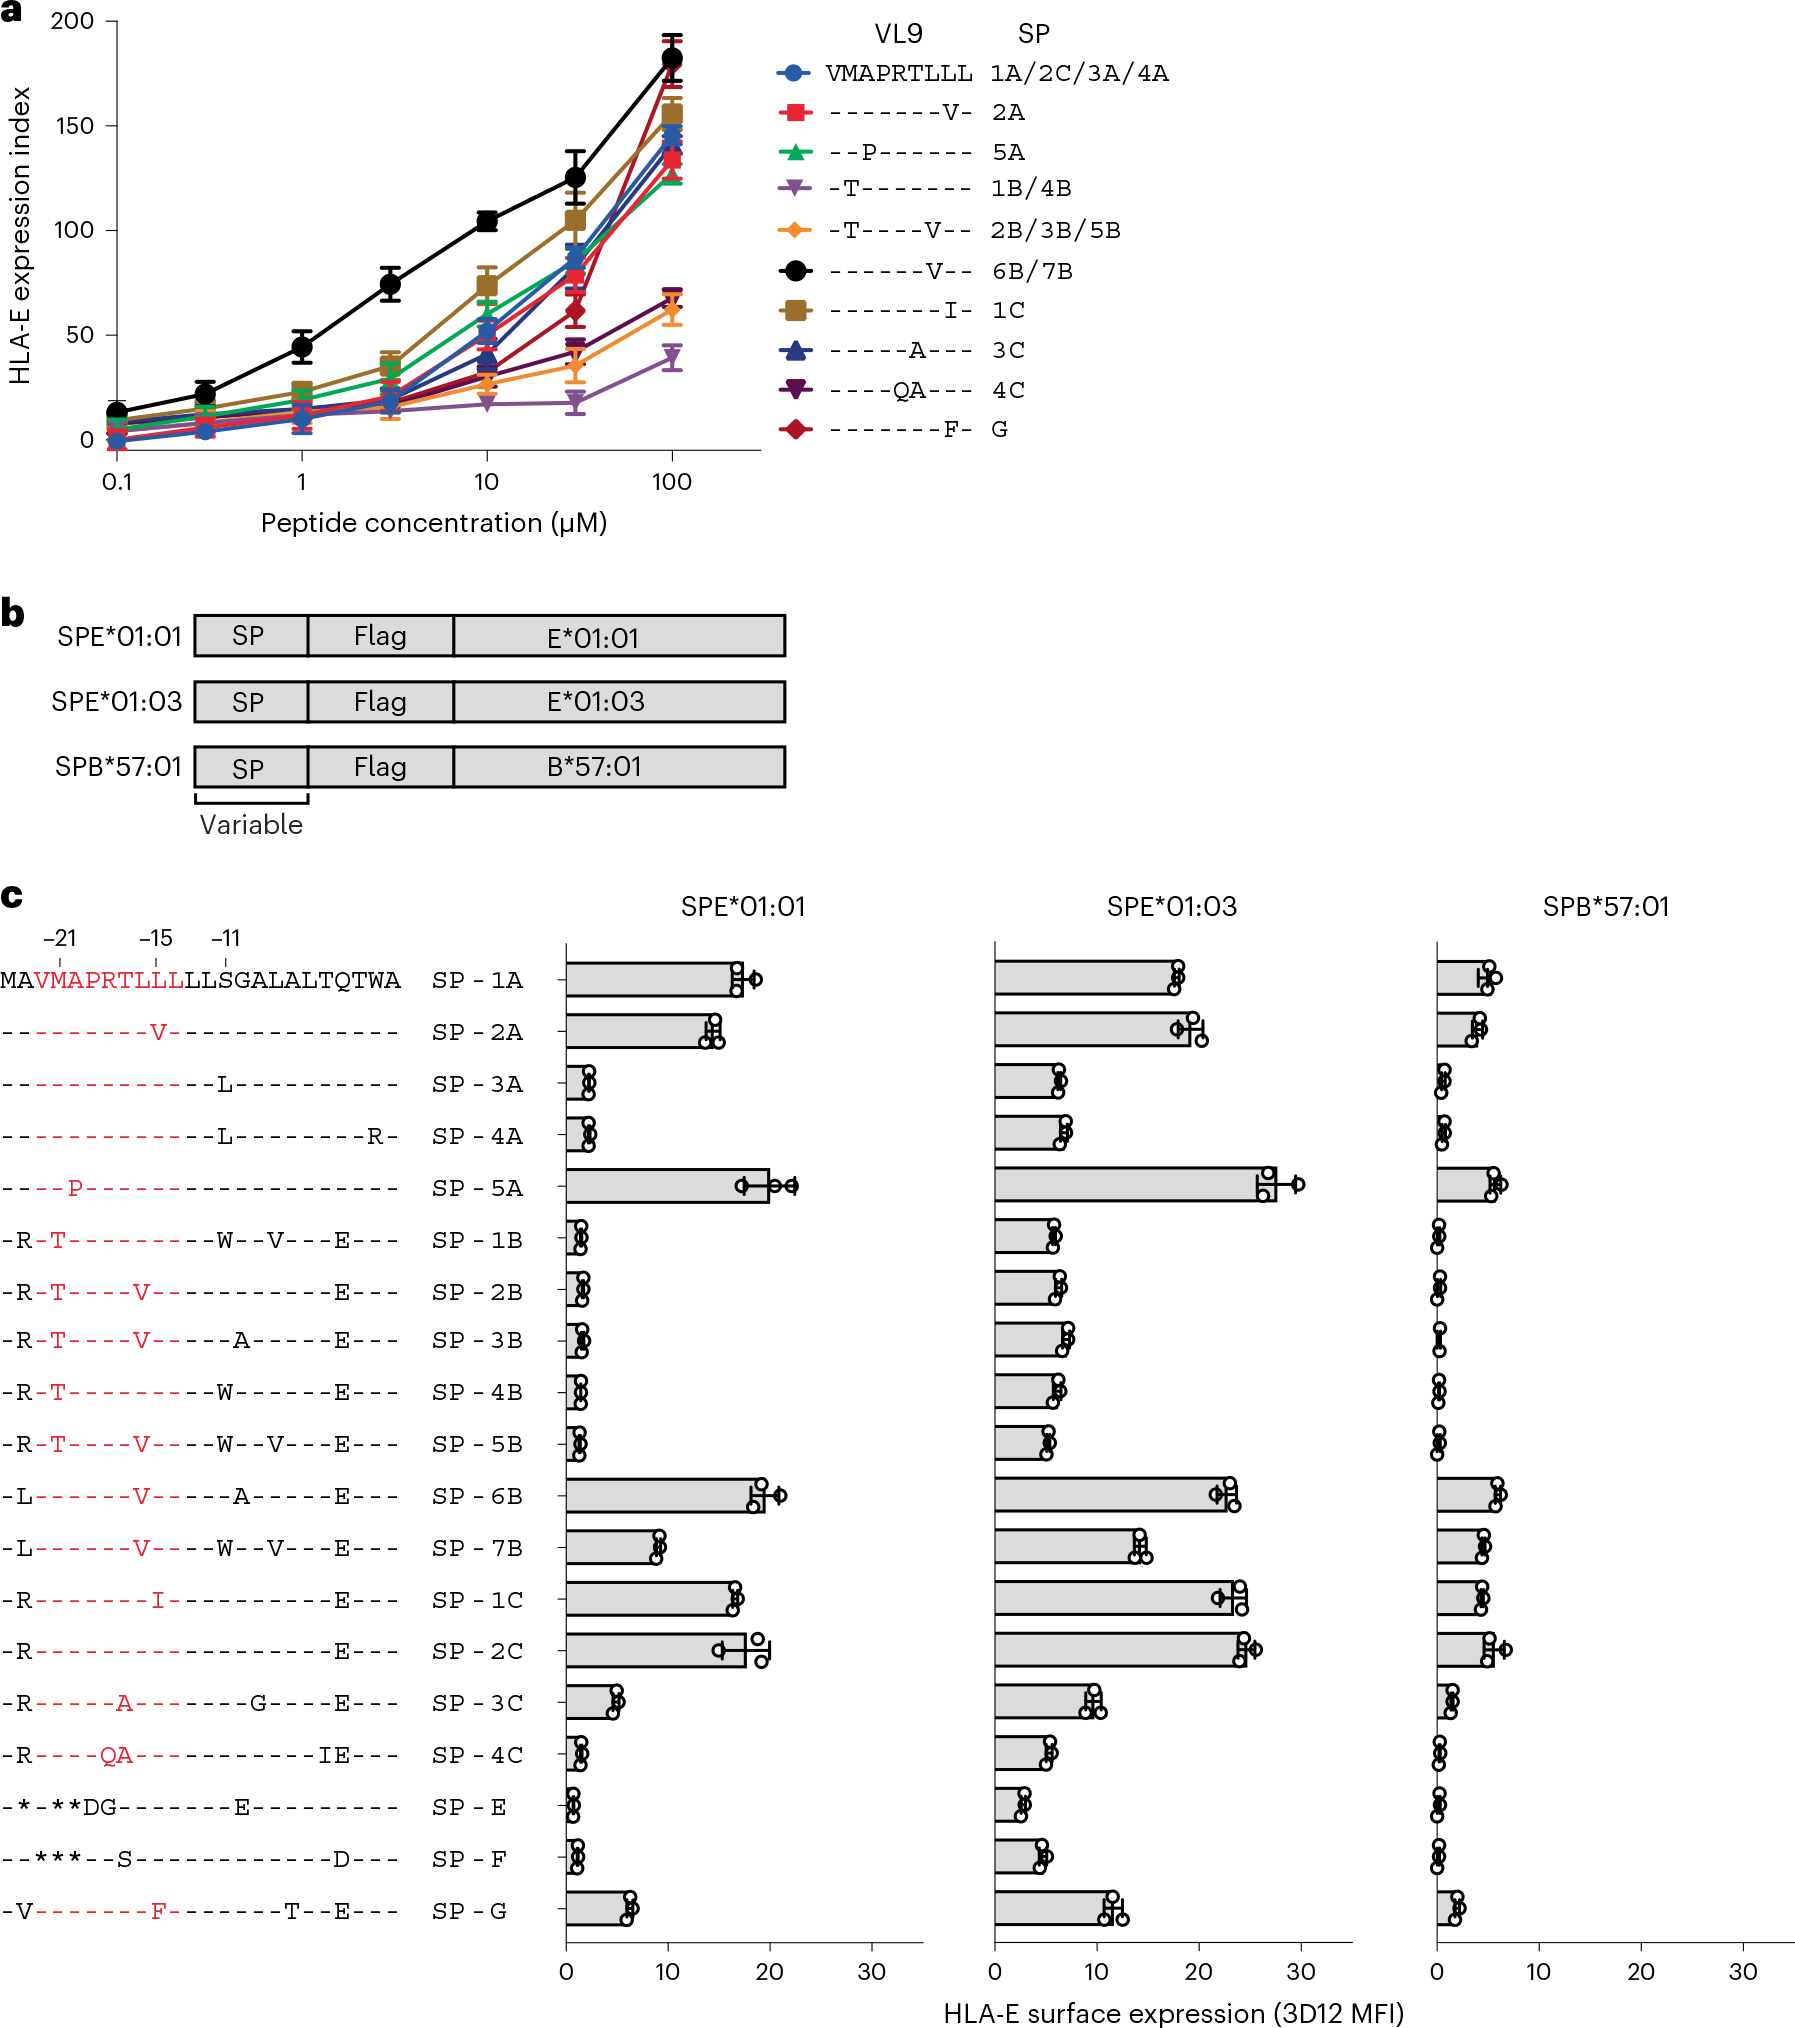
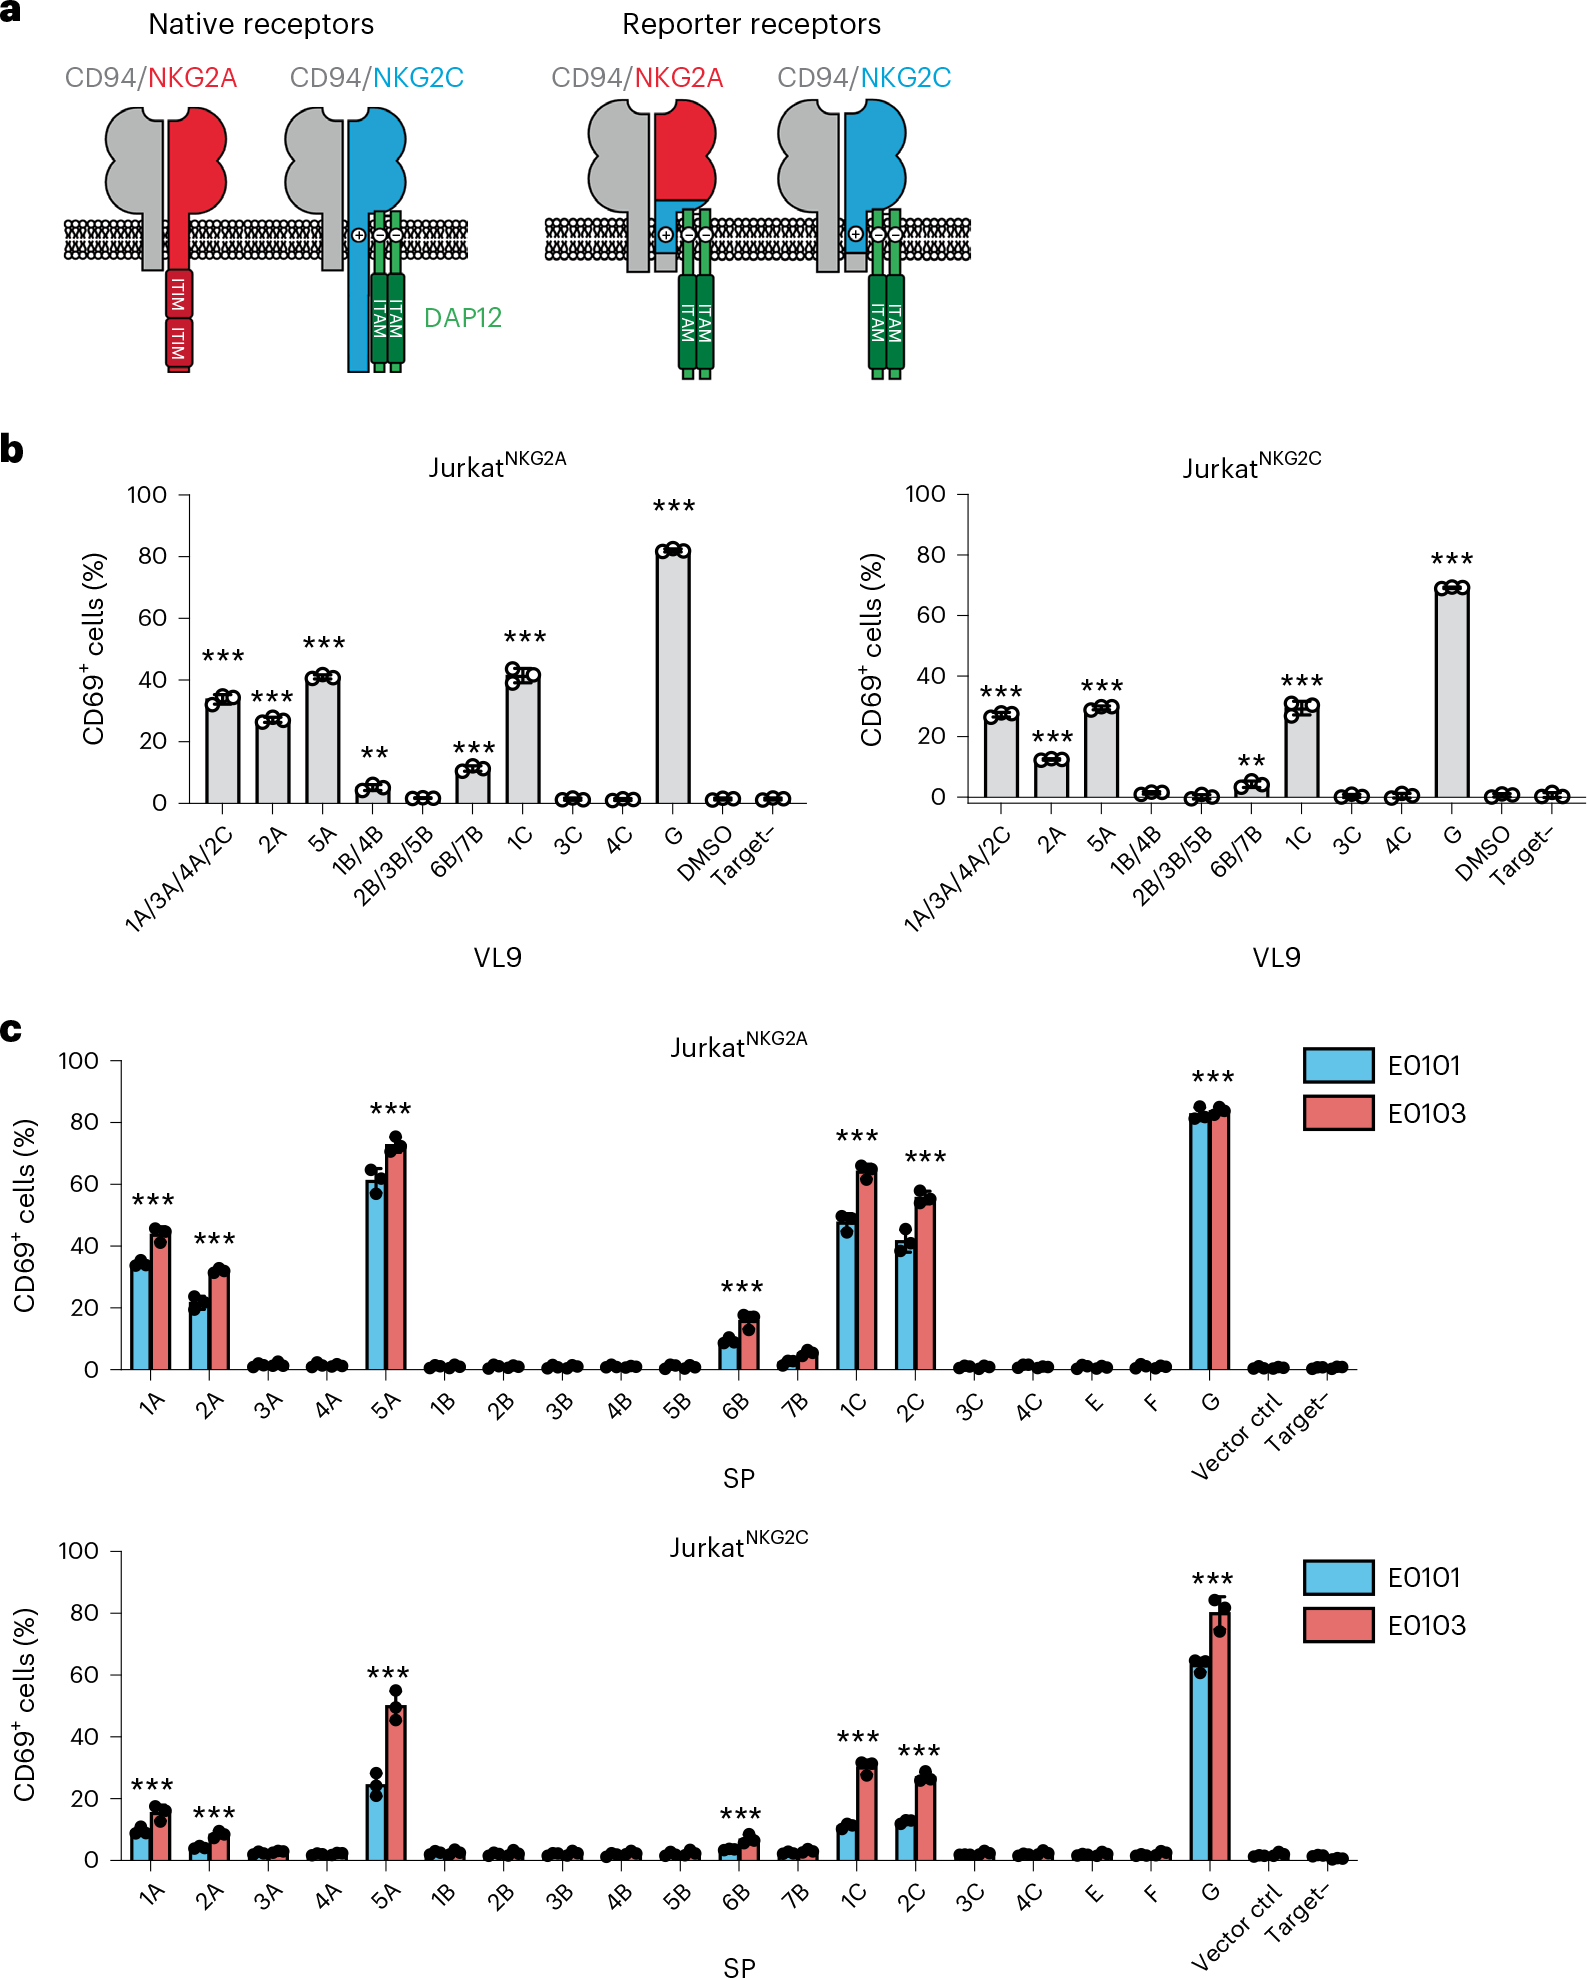
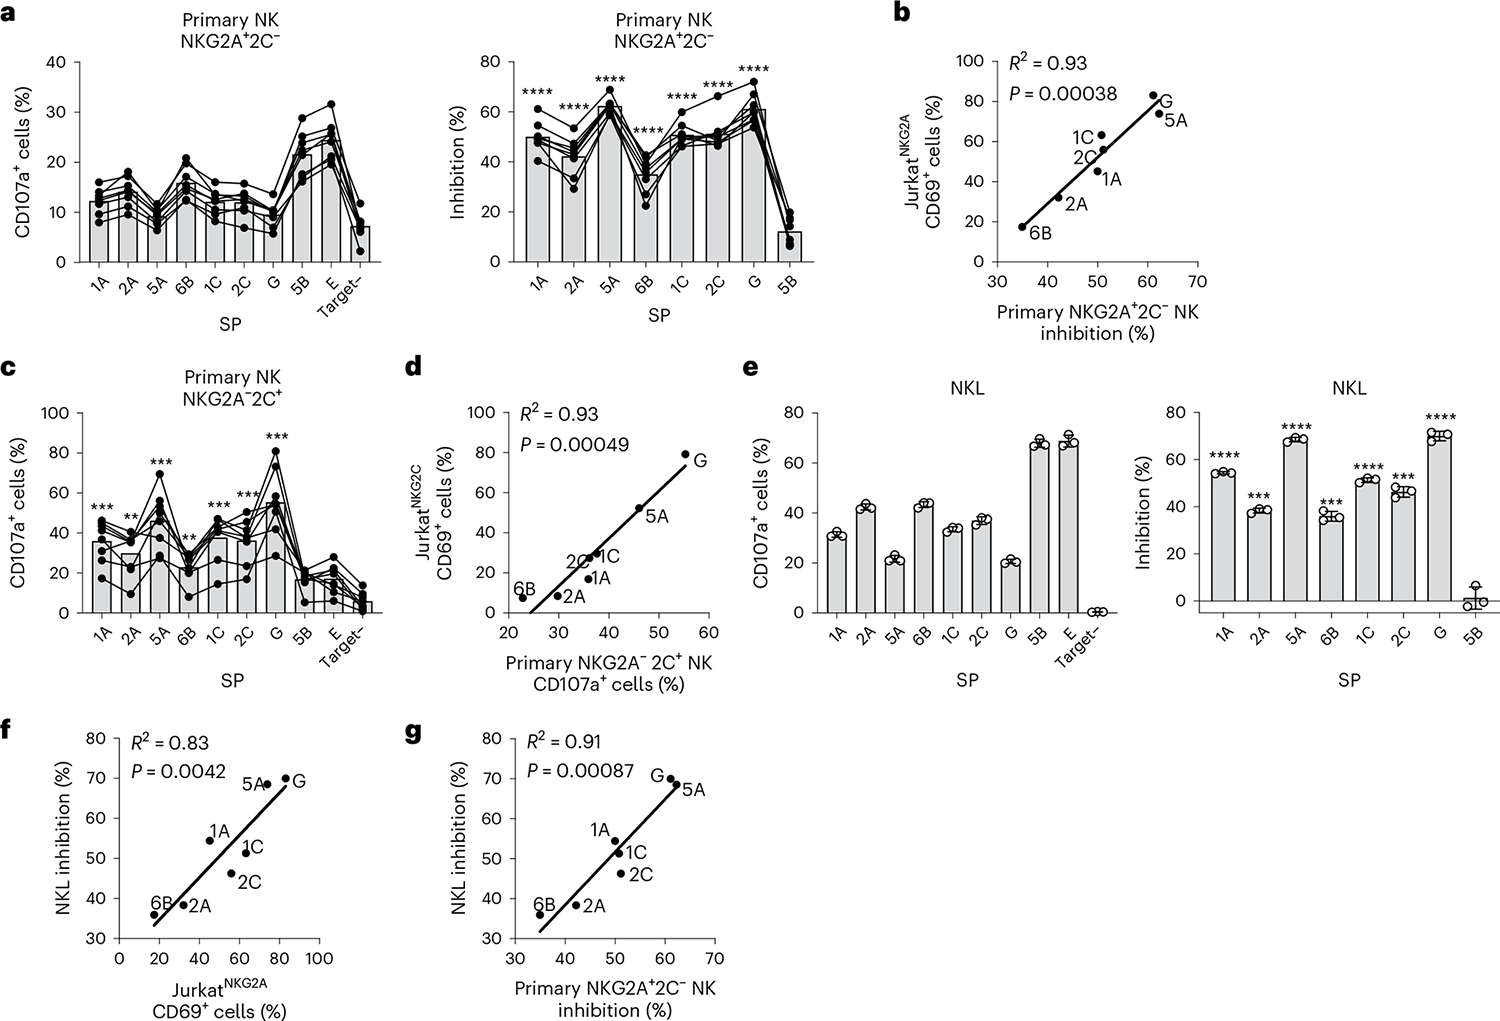
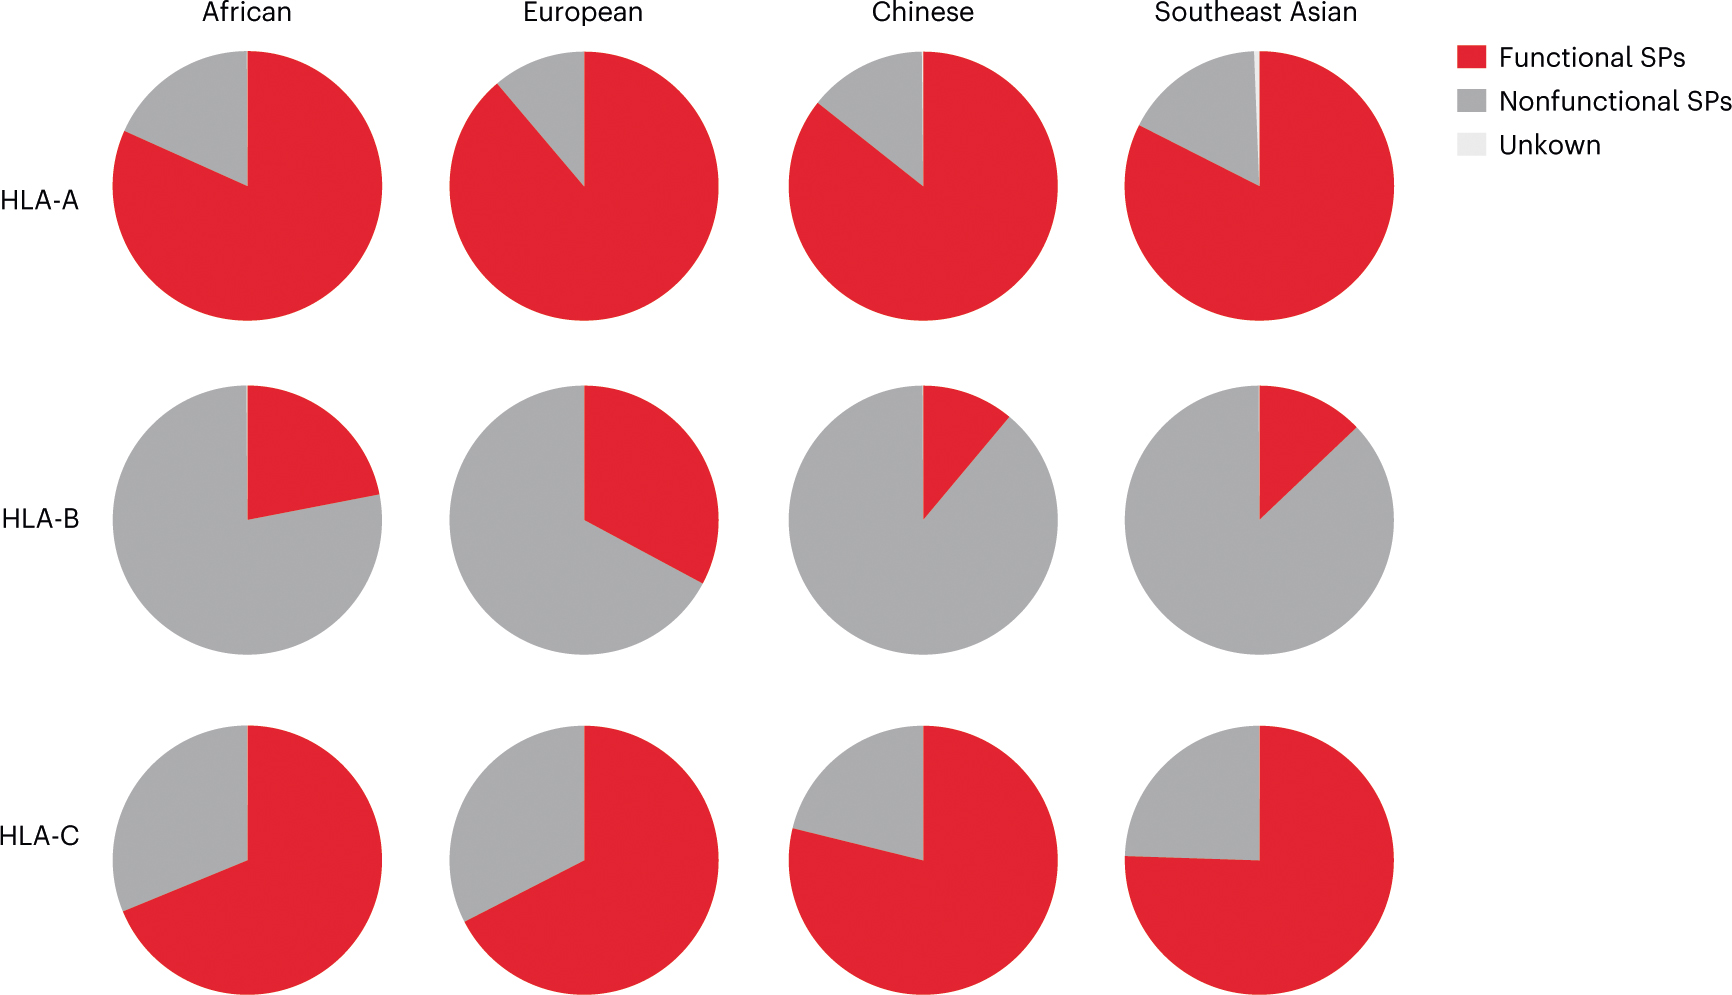
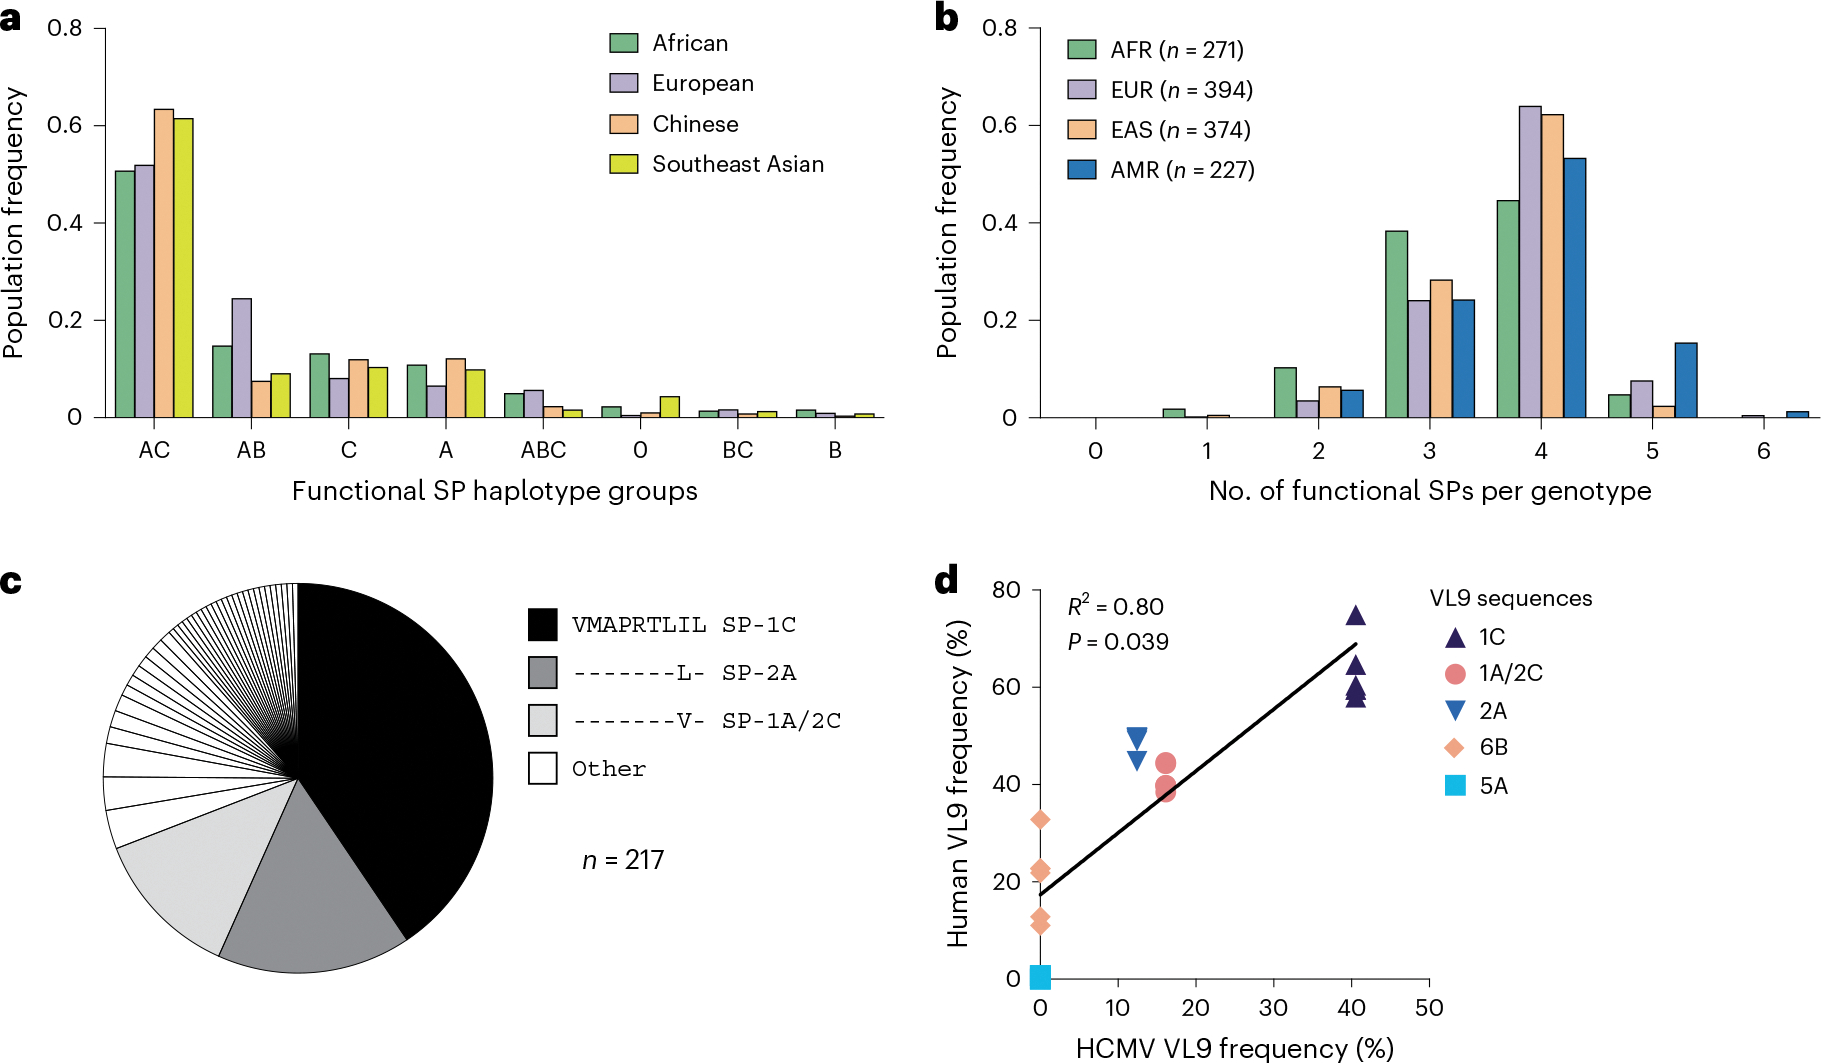
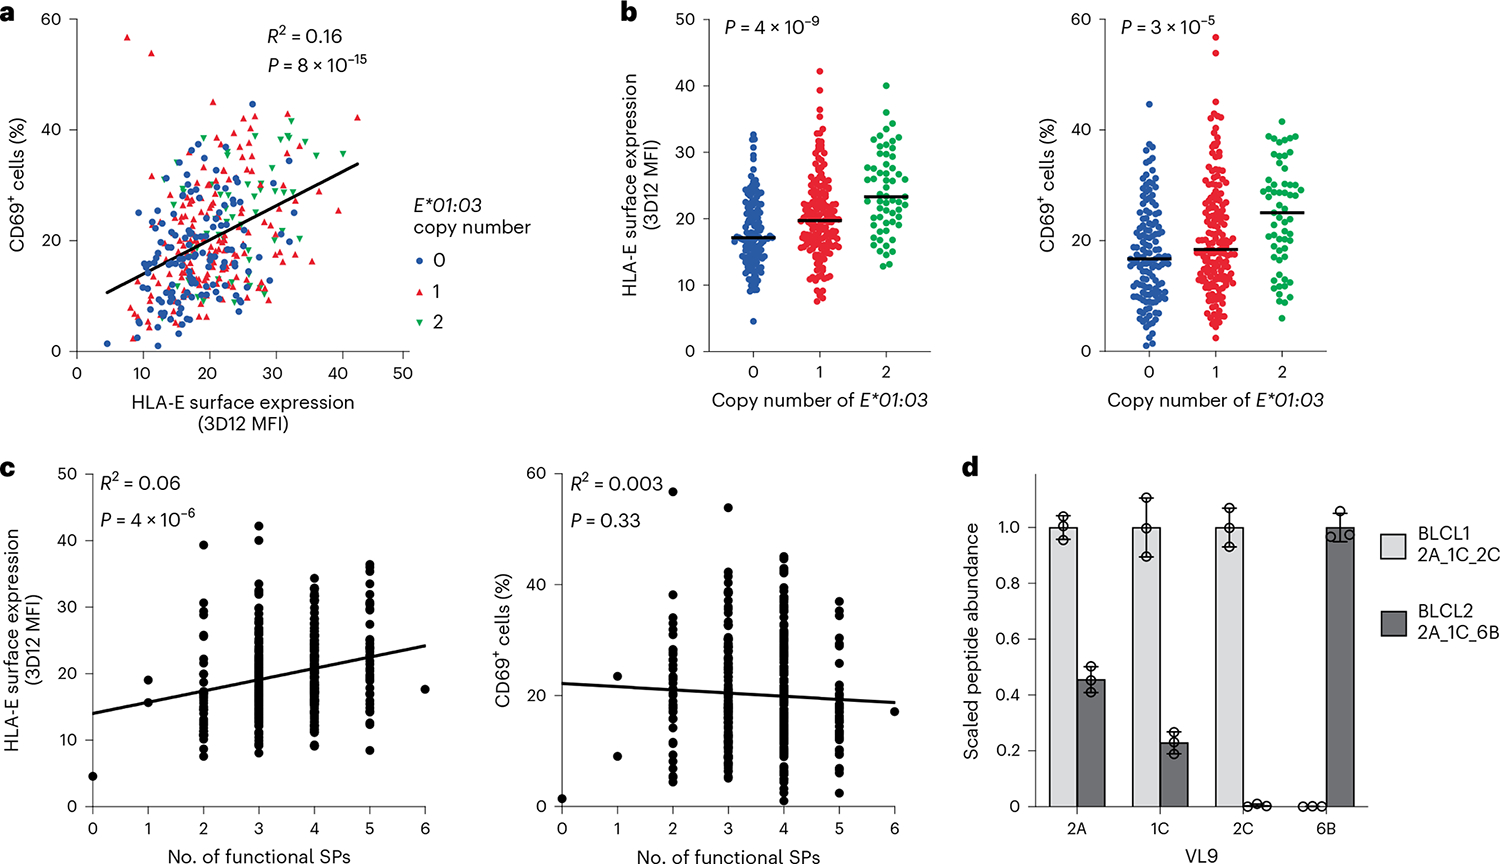
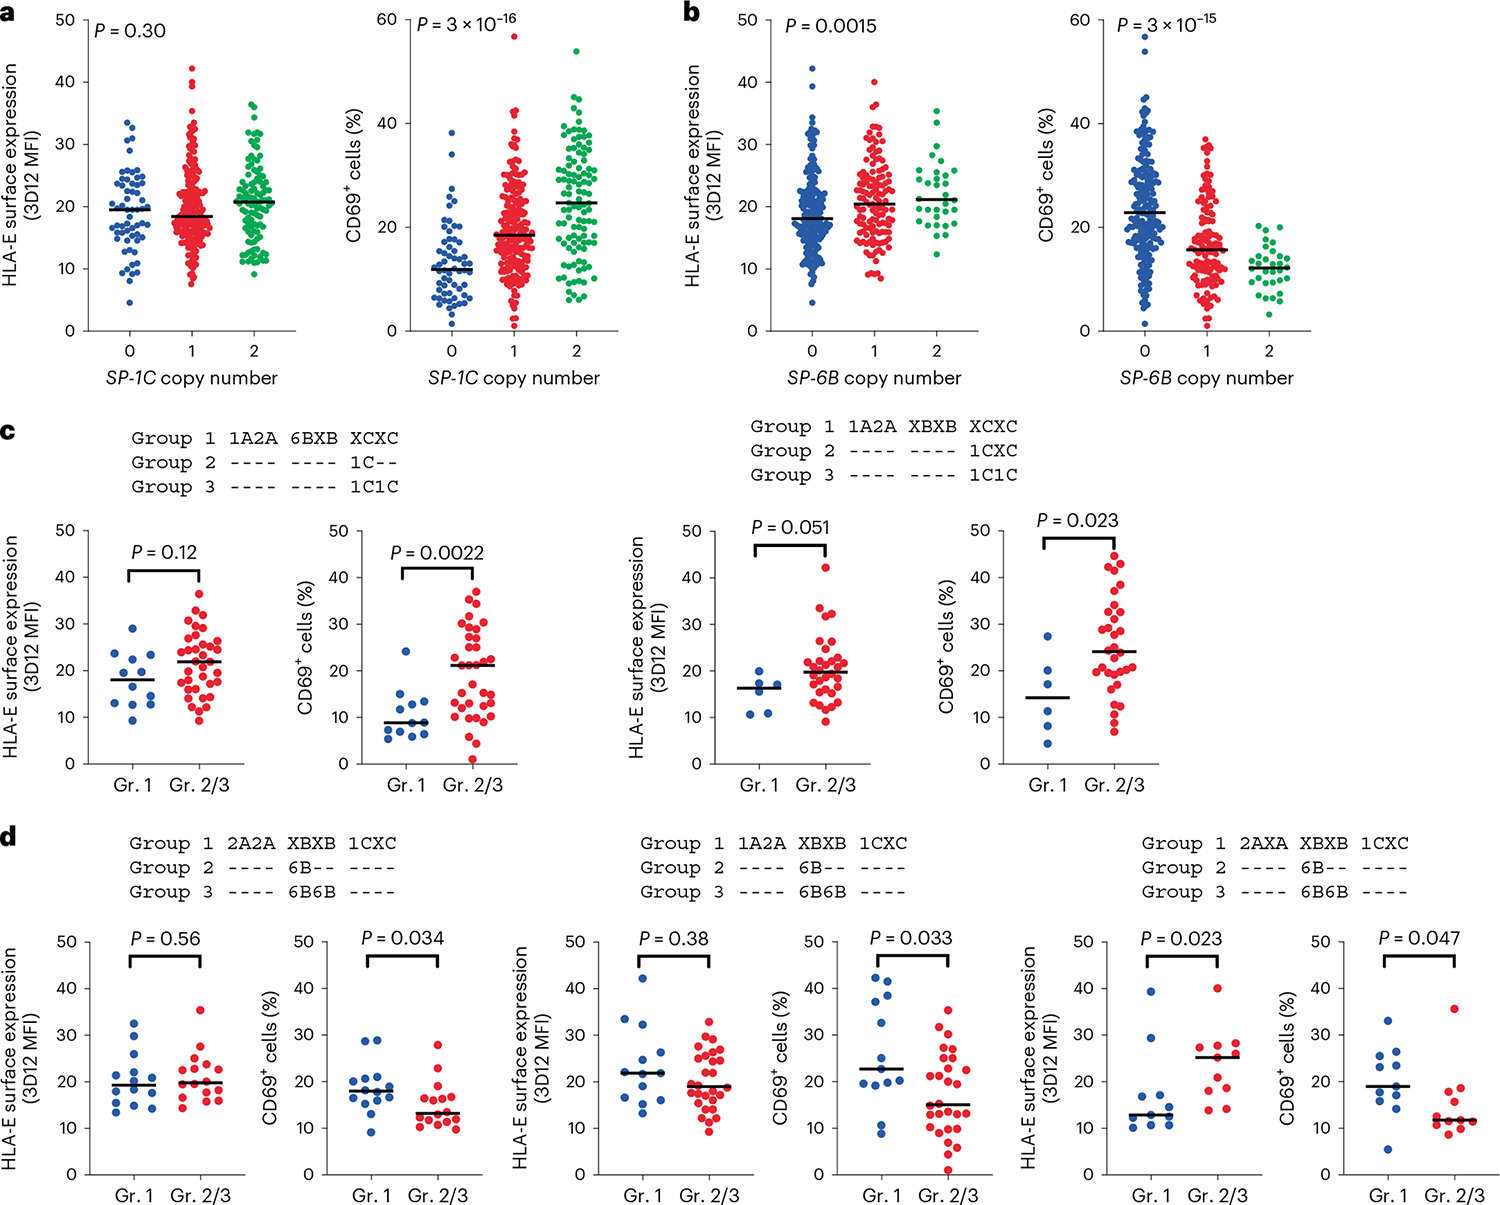
Human leukocyte antigen (HLA)-E binds epitopes derived from HLA-A, HLA-B, HLA-C and HLA-G signal peptides (SPs) and serves as a ligand for CD94/NKG2A and CD94/NKG2C receptors expressed on natural killer and T cell subsets. We show that among 16 common classical HLA class I SP variants, only 6 can be efficiently processed to generate epitopes that enable CD94/NKG2 engagement, which we term 'functional SPs'. The single functional HLA-B SP, known as HLA-B/-21M, induced high HLA-E expression, but conferred the lowest receptor recognition. Consequently, HLA-B/-21M SP competes with other SPs for providing epitope to HLA-E and reduces overall recognition of target cells by CD94/NKG2A, calling for reassessment of previous disease models involving HLA-B/-21M. Genetic population data indicate a positive correlation between frequencies of functional SPs in humans and corresponding cytomegalovirus mimics, suggesting a means for viral escape from host responses. The systematic, quantitative approach described herein will facilitate development of prediction algorithms for accurately measuring the impact of CD94/NKG2-HLA-E interactions in disease resistance/susceptibility.


Conflict of interest statement

Competing interests

The authors declare no competing interests.

Figures

Extended Data Fig. 1 |
Extended Data Fig. 1 |. HLA class I SP frequencies in human populations.
Allelic frequencies of SP variants were determined based on HLA class I allele frequencies obtained from www.allelefrequencies.net for four USA NMDP populations, including African (n = 28,557), European (n = 1,242,890), Chinese (n = 99,672), and Southeast Asian (n = 27,978). SP sequences and corresponding HLA class I alleles are shown in Table 1.
Extended Data Fig. 2 |
Extended Data Fig. 2 |. Differential binding of VL9 peptides to HLA-E.
a, HLA-E surface expression level on VL9-pulsed .221 cells measured by flow cytometry using 3D12 antibody. Cells were pulsed with peptides at 100, 30, and 10 μM concentrations. Peptide sequence alignments labeled with the corresponding SP variants are shown on the left. The expression index was calculated using 3D12 MFI as follows: ((sample − neg_ctrl) ÷ (pos_ctrl − neg_ctrl)) × 100, where neg_ctrl represents unpulsed .221 cells mixed with DMSO and pos_ctrl represents unpulsed .221 cells incubated constantly at 26 °C. Data represent triplicate experiments and reflect endogenous HLA-E*01:01 expression. b, VL9 binding to HLA-E*01:03 estimated using ELISA-based peptide binding and thermal stability assays. Bar charts represent absorbance signals at 450 nm reflecting the degree of VL9HLA-E complex recovery in the sandwich ELISA assay and thermal melting temperatures of VL9HLA-E determined using differential scanning fluorimetry. Data represent six experiments. a, b, Light gray bars depict the three peptides that showed the lowest binding levels consistently across experiments. Error bars represent the mean ± SD.
Extended Data Fig. 3 |
Extended Data Fig. 3 |. Differential HLA-E expression on the surface of .221-SPE cells and correlations of HLA-E expression levels between pairs of distinct measurements.
a, Cell surface expression levels of HLA-E on .221-SPE*01:01 and .221-SPE*01:03 cells measured by flow cytometry using anti-FLAG antibody. Data represent measurements on different days (n = 3). Error bars represent the mean ± SD. Amino acid sequence alignments of corresponding SP variants are shown on the left. VL9 peptide is shown in red. b, Correlations between HLA-E expression levels measured using anti-FLAG antibody and those measured using 3D12 antibody on the surface of .221-SPE*01:01 or .221-SPE*01:03 cells. c, Correlations between HLA-E expression levels on .221-SPE*01:01 cells and those on .221-SPE*01:03 cells measured using 3D12 or anti-FLAG antibodies. d, Correlations of HLA-E expression levels on .221-SPB*57:01 and those on .221-SPE*01:01 or .221-SPE*01:03. b-d, R2 was determined by Spearman correlation analysis and is shown with a two-tailed P value.
Extended Data Fig. 4 |
Extended Data Fig. 4 |. HLA-E expression levels on various cell types.
a, HLA-E expression levels on .221-SPE*01:03 cells, .221 cells pulsed with 100 μM VL9 peptides, PBMCs, and BLCLs. Error bars for PBMCs reflect variation across four donors (mean ± SD). The Y axis represents MFI obtained by 3D12 antibody staining minus MFI obtained by isotype control staining for each cell type. b, HLA-E expression levels on PBMCs and cell type subsets after 48 hours in culture with or without IFN-γ treatment. Data for two healthy donors (HD) are shown (HD75 and HD77) and represent triplicate experiments. Error bars represent the mean ± SD. P values for comparison between IFN-γ-treated and untreated cells were determined by a two-sided unpaired t-test: * - P < 0.05, ** - P < 0.01, *** - P < 0.001, **** - P < 0.0001.
Extended Data Fig. 5 |
Extended Data Fig. 5 |. JurkatNKG2A and JurkatNKG2C reporter activity against VL9-pulsed .221 cells.
a, Correlations between JurkatNKG2A and JurkatNKG2C reporter activity against VL9-pulsed (100uM) .221 expressing endogenous HLA-E*01:01 (shown in Fig. 2b). b, Absence of a correlation between HLA-E expression level on VL9-pulsed (100uM) .221 cells (shown in Fig. 1a) and Jurkat reporter cell activity against these cells (shown in Fig. 2b). Peptides are labeled with representative SPs. c, Correlations between Jurkat reporter cell activity against VL9-pulsed (100uM) .221 cells and KD values for HLA-E*01:03/VL9 binding to CD94/NKG2 determined by SPR analysis (Supplementary Table 1). a-c, R2 was determined by Spearman correlation analysis and is shown with a two-tailed P value.
Extended Data Fig. 6 |
Extended Data Fig. 6 |. Increase of HLA-E surface expression on monocyte-derived macrophages and enhanced JurkatNKG2A activity against these cells after IFN-γ treatment.
Monocytes were isolated from nine healthy donors and differentiated to monocyte-derived macrophages that were exposed to IFN-γ overnight (both unpulsed and VL9G-pulsed). Peptide pulsing was performed at 37°C for one hour prior to co-culture with reporter cells. P values for comparison between IFN-γ-treated and untreated cells were determined by a two-sided paired t-test.
Extended Data Fig. 7 |
Extended Data Fig. 7 |. Influence of valine at P7 of VL96B on CD94/NKG2A recognition.
a, Mutation analysis of P7 using JurkatNKG2A reporter cell response to .221-SPE*01:03 cells. Schematic representation of hybrid swap constructs transduced into .221 cells is shown on top. HLA-E expression level on .221-SPE*01:03 cells expressing wild-type (1A, 6B) and mutant (1AV, 6BL) SPs, and JurkatNKG2A activity against these cells are shown below. Data represent triplicate experiments. Error bars represent the mean ± SD. P values for comparisons between wild type and mutant SPs were determined by a two-sided unpaired t-test. b, Molecular dynamics simulation analysis of CD94/NKG2A–HLA-E*01:03 complexes in the presence of VL91A and VL96B peptides. Box plots show the root-mean-square deviations (RMSDs) of the full receptor, CD94, or NKG2A depending on the presence of the two distinct VL9 peptides in the binding groove during a 5 μs simulation (n = 500). Box boundaries span the 25–75 percentiles with the median marked in the middle; the whiskers extend to 10 and 90 percentiles, and the remaining data points are shown as gray circles. The RMSD box plots demonstrate higher receptor motions in VL96B-loaded complexes P values for comparisons between VL91A and VL96B were determined by a two-sided Mann-Whitney test.
Extended Data Fig. 8 |
Extended Data Fig. 8 |. NKG2A surface expression levels on different effector cells.
Jurkat reporter cells, primary NK cells from four healthy donors (HD), and NKL cells were stained with anti-NKG2A antibody (clone REA110). Flow cytometry histograms are shown on top, and graphical representation of the corresponding MFI data is shown below. The vertical line on the REA110 histogram separates NKG2A from NKG2A+ populations. NKG2A expression levels are determined as MFI values of NKG2A+ cells obtained by REA110 staining minus MFI values obtained by isotype control staining for each cell type. (−) represents untransduced parental Jurkat cells.
Extended Data Fig. 9 |
Extended Data Fig. 9 |. Distribution of specific functional SP haplotype groups present in NMDP samples.
Each SP haplotype group presented in Fig. 5a (main text) was further stratified by specific SP variants encoded by HLA-A, -B, -C haplotypes. Haplotype groupings are labeled according to the encoded functional SP variants.
Extended Data Fig. 10 |
Extended Data Fig. 10 |. HLA-E surface expression on BLCLs and reporter cell recognition of BLCLs stratified by copy number of alleles encoding SP-1A, SP-2A, or SP-2C.
HLA-E surface expression levels on BLCLs measured by flow cytometry using 3D12 antibody is shown on top and the corresponding JurkatNKG2A reporter cell activity (% of CD69+ cells) is shown below (n = 360). Lines in each group represent the median. P values for multi-group comparisons were determined by the Kruskal-Wallis test.
Fig. 1 |
Fig. 1 |. HLA class I signal peptide polymorphism influences HLA-E expression.
a, HLA-E surface expression levels on .221 cells pulsed with synthetic peptides at different concentrations measured by flow cytometry using the HLA-E-specific 3D12 antibody. VL9 peptide sequence alignment and corresponding SP variants are shown on the right. The expression index was calculated using 3D12 median fluorescence intensities (MFIs) as follows: ((sample − neg_ctrl)/(pos_ctrl − neg_ctrl)) × 100, where neg_ctrl represents unpulsed .221 cells mixed with dimethylsulfoxide (DMSO) and pos_ctrl represents unpulsed .221 cells incubated constantly at 26 °C. Data represent triplicate experiments and reflect endogenous HLA-E*01:01 expression. b, Schematic representation of fragments encoding SP/HLA hybrids cloned in a lentiviral expression vector. c, HLA-E surface expression on .221 cells transduced with SPE*01:01, SPE*01:03 and SPB*57:01 measured by flow cytometry using the 3D12 antibody on different days (n = 3). Amino acid sequence alignments of SP variants are shown on the left. VL9 epitope sequences are shown in red. Data in a and c are mean ± s.d.
Fig. 2 |
Fig. 2 |. JurkatNKG2 reporter cells respond differentially to VL9-pulsed .221 and .221-SPE cells.
a, Schematic of the chimeric receptor design for expression in Jurkat reporter cells. Native receptors are shown on the left and chimeric reporter receptors are shown on the right. b, Reporter activity (percentage of CD69+ cells) of JurkatNKG2A and JurkatNKG2C cells after incubation with VL9-pulsed (100 μM peptide) or unpulsed (DMSO) .221 cells expressing endogenous E*01:01. c, Reporter activity of JurkatNKG2A and JurkatNKG2C cells after incubation with .221 target cells transduced with SPE*01:01, SPE*01:03 or vector control (vector ctrl). b,c, Data represent triplicate experiments. Data are mean ± s.d. ‘Target–’ designates reporter cell activity in the absence of target cells. P values were determined in comparison with DMSO (b) or vector control (c) using two-sided unpaired t-tests and labeled with asterisks if reporter activity showed a significant difference (P < 0.05) for VL9-pulsed (b) or both SPE*01:01- and SPE*01:03-transduced target cells (c). **P < 0.01, ***P < 0.001.
Fig. 3 |
Fig. 3 |. 221-SPE*01:03 cells differentially stimulate primary NK and NKL cells.
a, Degranulation (percentage of CD107a+ cells) of primary NKG2A+NKG2C NK cells (denoted as NKG2A+C) after incubation with .221-SPE*01:03 target cells measured for healthy blood donors (n = 8) and the corresponding inhibition of degranulation. Inhibition of degranulation was calculated using the percentage of CD107a+ data as: (1 − (sample − neg_ctrl)/(pos_ctr − neg_ctrl)) × 100, where neg_ctrl represents NK cells incubated without target cells (Target–), and pos_ctrl represents NK cells incubated with .221 cells expressing transgenic HLA-E*01:03 with its own SP. b, Correlation between JurkatNKG2A activity (Fig. 2c) and primary NKG2A+NKG2C NK cell inhibition (a) after incubation with .221-SPE*01:03 cells. c, Degranulation of primary NKG2ANKG2C+ NK cells (denoted as NKG2AC+) after incubation with .221-SPE*01:03 target cells measured for the same donors (n = 8) as in a. d, Correlation between JurkatNKG2C activity (Fig. 2c) and primary NKG2ANKG2C+ NK cell activity (c) after incubation with .221-SPE*01:03 cells. e, NKL cell degranulation after incubation with .221-SPE*01:03 target cells and the corresponding inhibition of degranulation calculated based on the percentage of CD107a+ cells data. Data are mean ± s.d. from triplicate experiments. f, Correlation between NKL cell inhibition (e) and JurkatNKG2A activity after incubation with .221-SPE*01:03 cells (Fig. 2c). g, Correlation between NKL cell inhibition (e) and primary NKG2A+NKG2C NK cell inhibition (a). In a, c and e, P values were determined in comparison with target cells expressing SP-5B using a two-sided paired t-test for primary NK cells and an unpaired t-test for NKL cells. **P < 0.01, ***P < 0.001, ****P < 0.0001. In b, d, f and g, R2 was determined by Spearman correlation analysis and is shown with a two-tailed P value.
Fig. 4 |
Fig. 4 |. Frequencies of combined functional signal peptides at each HLA locus across NMDP populations.
The frequencies of HLA alleles encoding functional SP-A (SP-1A/SP-2A/SP-5A), SP-B (SP-6B) and SP-C (SP-1C/SP-2C) were combined for each HLA class I locus based on data available at http://www.allelefrequencies.net/ for four US NMDP populations (Extended Data Fig. 1).
Fig. 5 |
Fig. 5 |. HLA-A, HLA-B and HLA-C haplotypes and genotypes stratified by the presence of alleles encoding functional signal peptides.
a, Frequencies of HLA class I haplotype groups that encode 0–3 functional SPs in four NMDP populations. Classical HLA class I haplotypes were analyzed for the presence of alleles encoding functional SPs. Labels represent loci providing functional SPs. 0 indicates no functional SPs on the haplotype. b, Distribution of HLA-A, HLA-B and HLA-C genotypes containing different numbers of functional SPs in four populations from the 1000 Genomes Project genotyped for HLA class I. AFR, Africans; AMR, Admixed Americans; EAS, East Asians; EUR, Europeans. c, Distribution of HCMV VL9 mimics in the dataset reported previously. The legend lists the three major VL9 mimic sequences corresponding to the functional SPs shown. d, Correlation between the frequencies of HCMV VL9 variants (c) and the frequencies of matching functional SPs in the NMDP haplotypes (a). R2 was determined by Spearman correlation analysis based on average frequencies between the populations and is shown with a two-tailed P value.
Fig. 6 |
Fig. 6 |. HLA-E expression levels on BLCLs and recognition of BLCLs by reporter cells suggest competition between SP variants in providing VL9 epitopes to HLA-E.
a, Correlation between cell surface HLA-E expression on BLCLs and JurkatNKG2A reporter cell activity after co-incubation with the same BLCLs (n = 360). b, Cell surface HLA-E expression levels on BLCLs and the corresponding JurkatNKG2A reporter cell activity (percentage of CD69+ cells) as stratified by HLA-E*01:03 copy number. Lines in each group represent the median. P values for multigroup comparisons were determined by Kruskal–Wallis tests. c, Cell surface HLA-E expression levels on BLCLs and the corresponding JurkatNKG2A reporter cell activity as stratified by the number of functional SPs encoded by BLCL HLA genotypes. d, Scaled abundance of VL9s eluted from HLA class I expressed on two different BLCLs as determined by mass spectrometry. Peptide abundance values were normalized to the amount of HLA-E observed in the tryptic digests; the highest peptide abundance obtained between the two BLCLs was set to a value of 1. Data are mean ± s.d. from three technical replicates. In ac, data represent average measurements from four experiments. In a and c, R2 was determined by Spearman correlation analysis and is shown with a two-tailed P value.
Fig. 7 |
Fig. 7 |. Increasing copy number of alleles encoding SP-1C versus SP-6B associate with opposing effects on JurkatNKG2A reporter cell activity.
a,b, HLA-E surface expression levels on BLCLs (n = 360) and corresponding JurkatNKG2A reporter cell activity (percentage of CD69+ cells), as stratified by copy number of alleles encoding SP-1C (a) and SP-6B (b). P values for multigroup comparisons were determined by the Kruskal–Wallis test. c,d, HLA-E surface expression on BLCLs and corresponding JurkatNKG2A reporter cell activity as stratified by HLA genotypes encoding SPs (indicated above the graphs), which differed only by the presence of HLA class I alleles encoding SP-1C (c; left, n = 47; right, n = 38) or SP-6B (d; left, n = 30; middle, n = 41; right, n = 22). X designates nonfunctional SPs. Dashes indicate identity with the genotype in each respective group 1. P values were determined by a two-sided Mann–Whitney test. In ad, lines in each group represent the median.

References

    1. Quatrini L et al. Human NK cells, their receptors and function. Eur. J. Immunol. 51, 1566–1579 (2021). - PMC - PubMed
    1. McMahon CW & Raulet DH Expression and function of NK cell receptors in CD8+ T cells. Curr. Opin. Immunol. 13, 465–470 (2001). - PubMed
    1. Borrego F, Ulbrecht M, Weiss EH, Coligan JE & Brooks AG Recognition of human histocompatibility leukocyte antigen (HLA)-E complexed with HLA class I signal sequence-derived peptides by CD94/NKG2 confers protection from natural killer cell-mediated lysis. J. Exp. Med. 187, 813–818 (1998). - PMC - PubMed
    1. Braud VM et al. HLA-E binds to natural killer cell receptors CD94/NKG2A, B and C. Nature 391, 795–799 (1998). - PubMed
    1. Lee N et al. HLA-E is a major ligand for the natural killer inhibitory receptor CD94/NKG2A. Proc. Natl Acad. Sci. USA 95, 5199–5204 (1998). - PMC - PubMed

Publication types

MeSH terms

Substances