. 2023 Jun 1;24(1):32.
doi: 10.1186/s12868-023-00800-9.

The glycine receptor alpha 3 subunit mRNA expression shows sex-dependent differences in the adult mouse brain

Affiliations

The glycine receptor alpha 3 subunit mRNA expression shows sex-dependent differences in the adult mouse brain

Mikaela M Ceder et al. BMC Neurosci. .

Abstract

Background: The glycinergic system plays an important inhibitory role in the mouse central nervous system, where glycine controls the excitability of spinal itch- and pain-mediating neurons. Impairments of the glycine receptors can cause motor and sensory deficits. Glycine exerts inhibition through interaction with ligand-gated ion channels composed of alpha and beta subunits. We have investigated the mRNA expression of the glycine receptor alpha 3 (Glra3) subunit in the nervous system as well as in several peripheral organs of female and male mice.

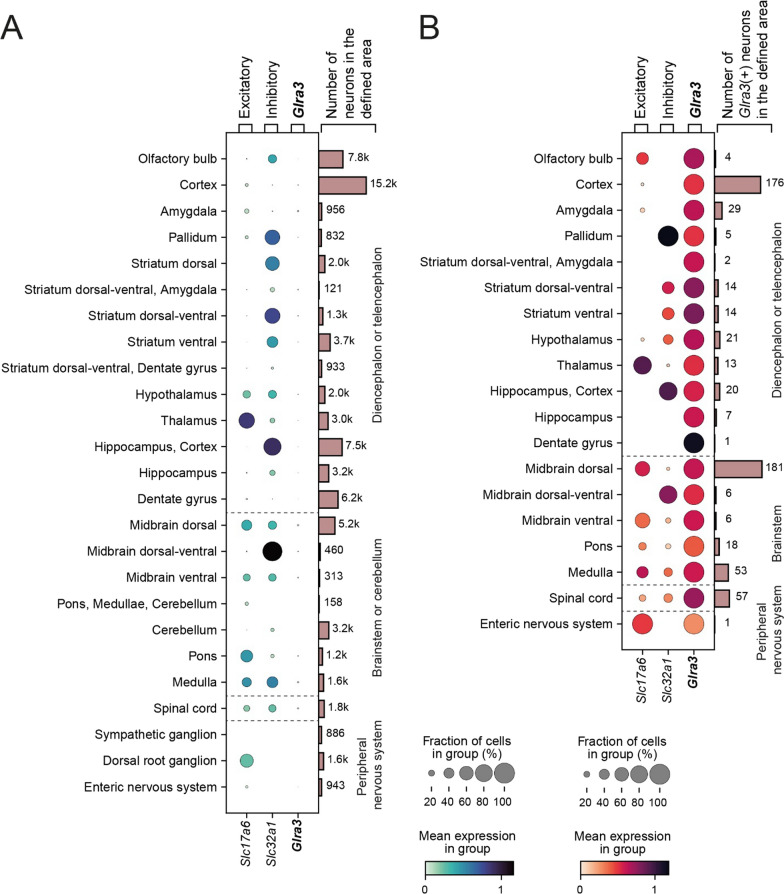
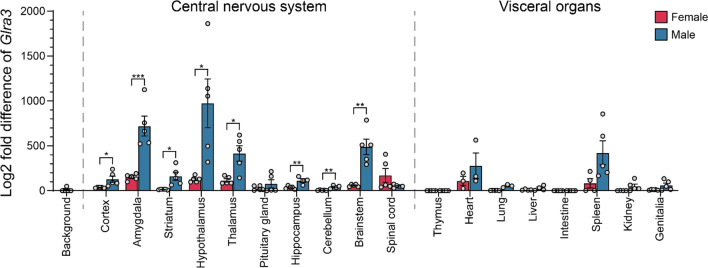
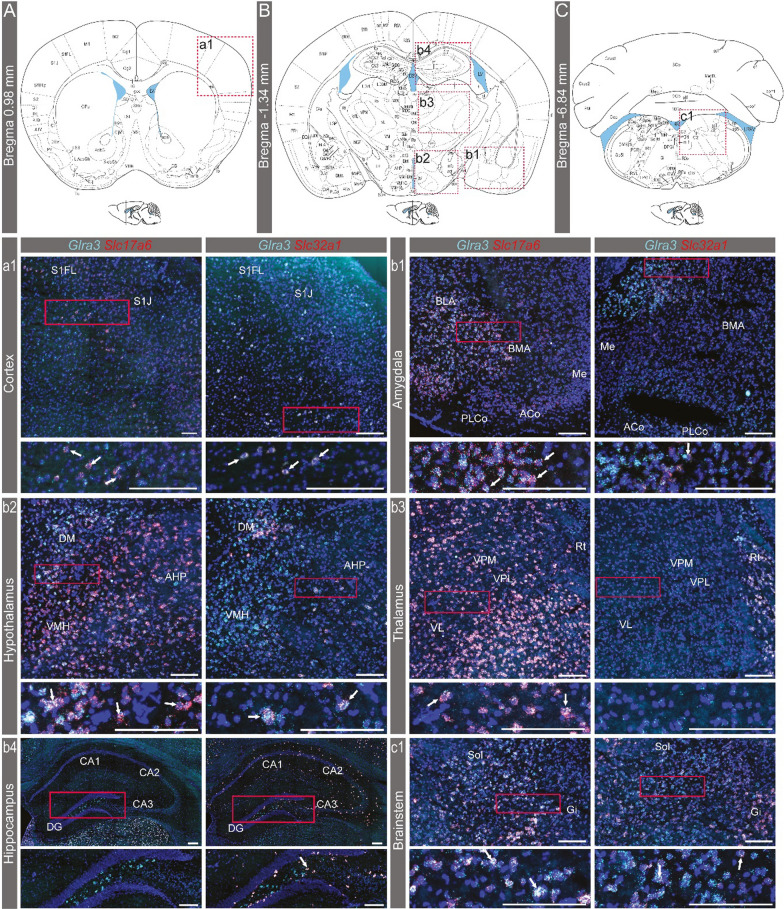
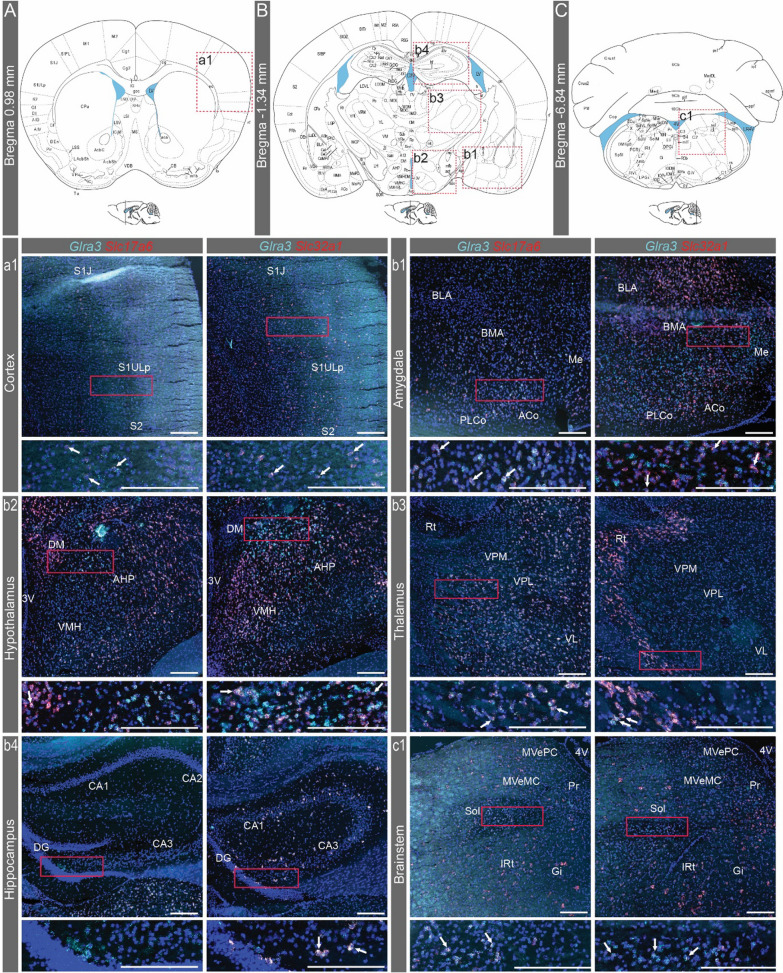
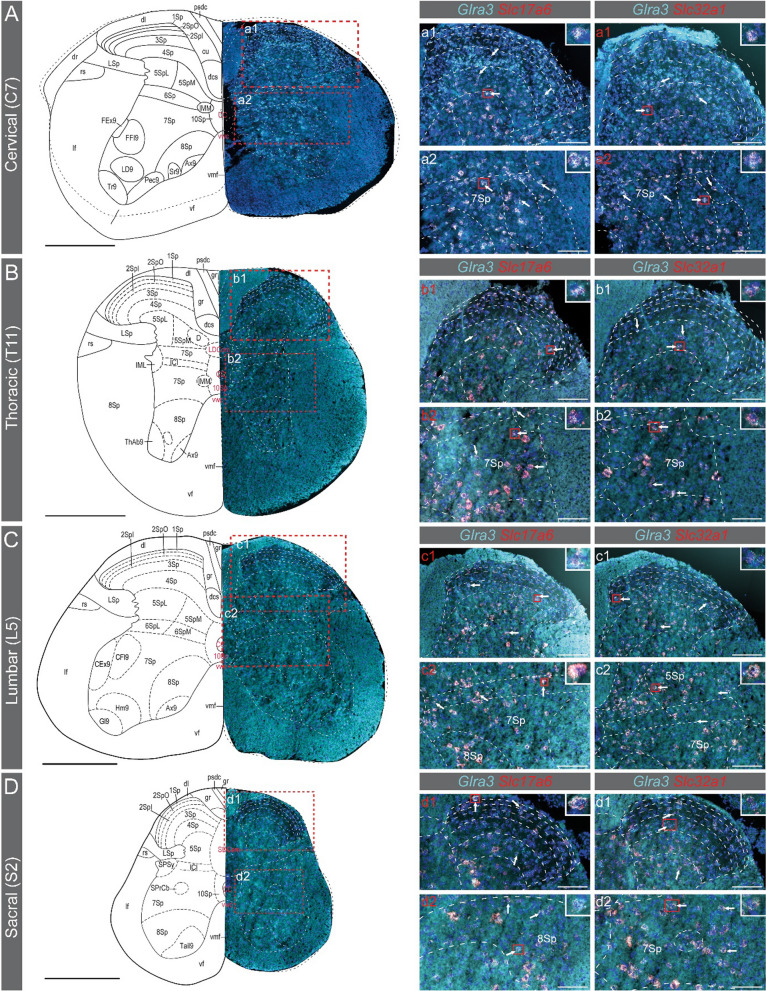
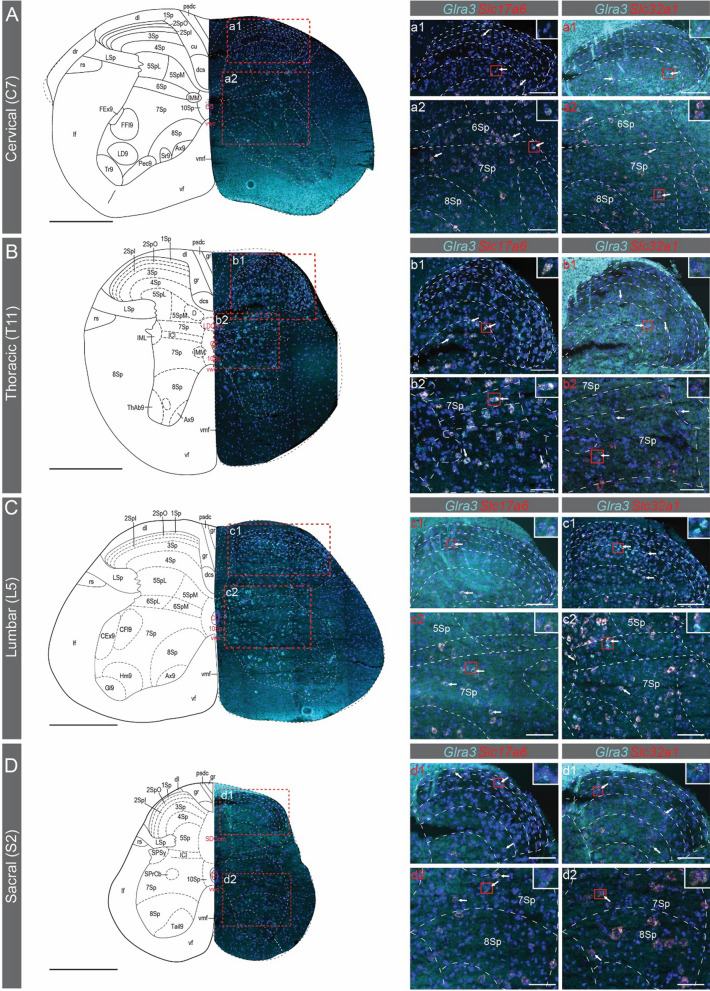
Results: Single-cell RNA sequencing (scRNA-seq) data analysis on the Zeisel et al. (2018) dataset indicated widespread but low expression of Glra3 in vesicular glutamate transporter 2 (Vglut2, Slc17a6) positive and vesicular inhibitory amino acid transporter (Viaat, Slc32a1)positive neurons of the mouse central nervous system. Highest occurrence of Glra3 expression was identified in the cortex, amygdala, and striatal regions, as well as in the hypothalamus, brainstem and spinal cord. Bulk quantitative real-time-PCR (qRT-PCR) analysis demonstrated Glra3 expression in cortex, amygdala, striatum, hypothalamus, thalamus, pituitary gland, hippocampus, cerebellum, brainstem, and spinal cord. Additionally, male mice expressed higher levels of Glra3 in all investigated brain areas compared with female mice. Lastly, RNAscope spatially validated Glra3 expression in the areas indicated by the single-cell and bulk analyses. Moreover, RNAscope analysis confirmed co-localization of Glra3 with Slc17a6 or Slc32a1 in the central nervous system areas suggested from the single-cell data.

Conclusions: Glra3 expression is low but widespread in the mouse central nervous system. Clear sex-dependent differences have been identified, indicating higher levels of Glra3 in several telencephalic and diencephalic areas, as well as in cerebellum and brainstem, in male mice compared with female mice.

Keywords: Brain; Glra3; Glycine; Mice; Sex-dependent differences; Spinal cord.


Conflict of interest statement

The authors state no conflict of interest.

Figures

Fig. 1
Fig. 1
Low expression of Glra3 was detected in the central nervous system. The expression of Glra3 and its co-expression with excitatory marker Slc17a6 (Vglut2) and inhibitory marker Slc32a1 (Viaat) were examined in distinct areas in the central and peripheral nervous system in the Zeisel et al. (2018) dataset, which contained scRNA-seq data of 27,998 genes in 74,539 neurons [22]. A Dot plot of the expressions of the targeted genes in all neurons in the areas annotated in the Zeisel et al. (2018) dataset. Glra3 was generally expressed in low levels, as indicated by light blue colored dots, and in a small number of cells, as indicated by the dots’ small diameters. The highest expression was found in Zeisel et al. (2018) defined central nervous system areas, namely the amygdala, dorsal midbrain, medulla and the spinal cord (more than 3.0% of neurons in these areas expressed Glra3). B The occurrence of Glra3 neurons (Glra3 was considered expressed if log1p > 0.1) and the co-expression of Slc17a6 and Slc32a1 in the respective areas visualized with a dot plot. Glra3 was expressed in both excitatory and inhibitory neurons, with some areas displaying either excitatory or inhibitory Glra3 neurons, while other areas contained Glra3 neurons of both molecular properties.
Fig. 2
Fig. 2
qRT-PCR revealed Glra3 to be mainly found in the central nervous system. Glra3 expression in adult female (n = 5, red) and adult male (n = 5, blue) C57BL/6J mice was measured using qRT-PCR, with a cutoff of 45 cycles. The relative mRNA expression was calculated using the delta Ct method with three stable reference genes (female and male body: Actβ, Rpl19, Gapdh; female brain: Actβ, Rpl19, Gapdh; male brain: Actβ, Rpl19, Cyclo). Stable reference genes were found using the GeNorm protocol [23]. Biological outliers (in total two outliers from male mice, one for the hippocampus and one for the cerebellum) were removed using the Grubbs outlier test with α = 0.05 before proceeding. The log2 fold mean difference (± SEM) against the genomic Glra3 DNA expression is illustrated in the combined scatter-bar plot. Glra3 was measured in heart (n = 3), lung (n = 3–5), spleen (n = 4–5), kidney (n = 4–5) and testes (n = 5) however these findings should be considered with caution (see Additional file 1: Fig. S1). Glra3 was expressed in most tissues collected for the central nervous system, with highest expression in the amygdala, hypothalamus, thalamus, brainstem and spinal cord. Two-tailed Mann–Whitney U-test (thalamus p = 0.0317; hippocampus p = 0.0079 (with outlier); cerebellum p = 0.0079 (with outlier); pituitary gland p > 0.9999) or unpaired t-test (prefrontal cortex p = 0.0256; amygdala p = 0.0009; striatum (females caudate putamen, males caudate putamen and nucleus accumbens); p = 0.0118; hypothalamus p = 0.0144; hippocampus p = 0.0051 (without outlier); cerebellum p = 0.0027 (without outlier); brainstem p = 0.0010; spinal cord p = 0.1495) were used to calculate the difference between female and male mice for each tissue where *p < 0.05, **p < 0.01, ***p < 0.001
Fig. 3
Fig. 3
Analysis of the spatial expression of Glra3 in the female brain. The spatial Glra3 mRNA expression was detected with RNAscope using probes against Glra3 (teal), Slc17a6 (red) and Slc32a1 (red). Expression was detected at (A) Bregma 0.98 mm in the (a1) cortex, and both co-localization of Glra3 with Slc17a6 or Slc32a1 was observed. B At Bregma -1.34 mm, Glra3 expression was found in the (b1) amygdala, (b2) hypothalamus, (b3) thalamus and (b4) hippocampus. b1–b4 Overlap with Slc17a6 expression was observed in all areas, except in the hippocampus, while overlap with Slc32a1 was seen in all areas, except in the thalamus. C At Bregma -6.84 mm, Glra3 expression and overlap with Slc17a6 or Slc32a1 expression was observed in the (c1) brainstem. Illustrations of the Bregma sections in A–C are adapted from https://mouse.brain-map.org/experiment/thumbnails/100048576?image_type=atlas. The red dashed squares in A–C indicate approximately the area displayed in a1–c1. The dashed squares were consistently placed on the right side of the schematic image in order to maximize the readability of the abbreviations, regardless of the position of the representative images. White arrows denote examples of co-expression. Scale bars: 200 µm, enlargements 100 µm. Abbreviated areas in a1–c1: Aco = anterior cortical amygdaloid nucleus, AHP = anterior hypothalamic area, posterior part, BLA = basolateral amygdaloid nucleus, anterior part, BMA = basomedial amygdaloid nucleus, anterior part, DG = dentate gyrus, DM = dorsomedial hypothalamic nucleus, Gi = gigantocellular reticular nucleus, ME = medial amygdaloid nucleus, PLCo = posterolateral cortical amygdaloid nucleus, Rt = reticular thalamic nucleus, S1FL = primary somatosensory cortex, forelimb region, S1J = primary somatosensory cortex, jaw region, Sol = solitary tract, VL = ventrolateral thalamic nucleus, VMH = ventromedial hypothalamic nucleus, VPL = ventral posterolateral thalamic nucleus, VPM = ventral posteromedial thalamic nucleus. For all other abbreviations, please see https://mouse.brain-map.org/experiment/thumbnails/100048576?image_type=atlas
Fig. 4
Fig. 4
Analysis of the spatial expression of Glra3 in the male brain. The spatial Glra3 mRNA expression was detected with RNAscope using probes against Glra3 (teal), Slc17a6 (red) and Slc32a1 (red). Expression was detected at (A) Bregma 0.98 mm in the (a1) cortex, and both co-localization of Glra3 with Slc17a6 or Slc32a1 was observed. B At Bregma -1.34 mm, Glra3 expression was found in the (b1) amygdala, (b2) hypothalamus, (b3) thalamus and the (b4) hippocampus (for Slc32a1 the representative image is from a section between Bregma -1.06 and -1.22 mm). b1–b4 Overlap with Slc17a6 expression was observed in all areas, except for the hippocampus, while overlap with Slc32a1 expression was seen in all areas. C At Bregma -6.84 mm Glra3 expression and overlap with Slc17a6 or Slc32a1 expressions was observed in the (c1) brainstem. Illustrations of the Bregma sections in A–C are adapted from https://mouse.brain-map.org/experiment/thumbnails/100048576?image_type=atlas. The red dashed squares in A–C indicate approximately the area displayed in a1–c1. The dashed squares were consistently placed on the right side of the schematic image in order to maximize the readability of the abbreviations, regardless of the position of the representative images. White arrows denote examples of co-expression. Scale bars: 200 µm, enlargements 100 µm. Abbreviated areas in a1–c1: Aco = anterior cortical amygdaloid nucleus, AHP = anterior hypothalamic area, posterior part, BLA = basolateral amygdaloid nucleus, anterior part, BMA = basomedial amygdaloid nucleus, anterior part, DG = dentate gyrus, DM = dorsomedial hypothalamic nucleus, Gi = gigantocellular reticular nucleus, IRt = intermediate reticular nucleus, ME = medial amygdaloid nucleus, MVeMC = medial vestibular nucleus, magnocellular part, MVePC = medial vestibular nucleus, parvicellular part, PLCo = posterolateral cortical amygdaloid nucleus, Pr = prepositus nucleus, Rt = reticular thalamic nucleus, S1J = primary somatosensory cortex, jaw region, S1ULP = primary somatosensory cortex, upper lip region, S2 = secondary somatosensory cortex, Sol = solitary tract, VL = ventrolateral thalamic nucleus, VMH = ventromedial hypothalamic nucleus, VPL = ventral posterolateral thalamic nucleus, VPM = ventral posteromedial thalamic nucleus, 3V = 3rd ventricle, 4V = 4th ventricle. For all other abbreviations, please see https://mouse.brain-map.org/experiment/thumbnails/100048576?image_type=atlas
Fig. 5
Fig. 5
Spatial expression analysis of Glra3 in the female spinal cord. The spatial Glra3 mRNA expression was examined with RNAscope using probes for Glra3 (teal), Slc17a6 (red) and Slc32a1 (red). Glra3 was expressed in the (A)cervical (C7), (B) thoracic (T11), (C) lumbar (L5) and (D) sacral (S2) divisions of the spinal cord (AD). Overlap with Slc17a6 and Slc32a1expressions could be observed in all divisions (a1, a2, b1, b2, c1, c2, d1, d2). Expression was found in the dorsal and ventral horns in all divisions. Glra3 could be detected in the ventral horn in the cervical, lumbar and sacral divisions. Illustrations of the spinal cord divisions in AD are modified from https://mouse.brain-map.org/experiment/siv?id=100050402&imageId=101006525&imageType=atlas. The red dashed squares in AD indicate approximately the enlarged images in a1-d2 (labelled with white text). No overview images are shown for the enlarged images labeled with red text. AD Scale bars: 500 µm, a1–d2: scale bars 100 µm. White arrows denote examples of co-expression. Grey line in a1-d2 indicates boarder for lamina IIouter and lamina IIinner. 5Sp = lamina 5, 7Sp = lamina 7, 8Sp = lamina 8. For all other abbreviations, please see https://mouse.brain-map.org/experiment/siv?id=100050402&imageId=101006525&imageType=atlas
Fig. 6
Fig. 6
Spatial expression analysis of Glra3 in the male spinal cord. The spatial Glra3 mRNA expression was examined with RNAscope using probes for Glra3 (teal), Slc17a6 (red) and Slc32a1 (red). Glra3 was expressed in the (A) cervical (C7), (B) thoracic (T11), (C) lumbar (L5) and (D) sacral (S2) divisions of the spinal cord (AD). Overlap with Slc17a6 and Slc32a1 expressions could be observed in all divisions (a1, a2, b1, b2, c1, c2, d1, d2). Glra3 expression was found in the dorsal and ventral horns in all divisions. Glra3 could be detected in the ventral horn in the cervical, lumbar and sacral divisions. Illustrations of the spinal cord divisions in AD are modified from https://mouse.brain-map.org/experiment/siv?id=100050402&imageId=101006525&imageType=atlas. The red dashed squares in AD indicate approximately the area displayed in a1–d2 (labelled with white text). No overview images are shown for the enlarged images labeled with red text. AD Scale bars: 500 µm, a1–d2: scale bars 100 µm. White arrows denote examples of co-expression. Grey line in a1-d2 indicates boarder for lamina IIouter and lamina IIinner. 5Sp = lamina 5, 6Sp = lamina 6, 7Sp = lamina 7, 8Sp = lamina 8. For all other abbreviations, please see https://mouse.brain-map.org/experiment/siv?id=100050402&imageId=101006525&imageType=atlas

Similar articles

Cited by

References

    1. Freitag FB, Ahemaiti A, Jakobsson JET, Weman HM, Lagerstrom MC. Spinal gastrin releasing peptide receptor expressing interneurons are controlled by local phasic and tonic inhibition. Sci Rep. 2019;9(1):16573. doi: 10.1038/s41598-019-52642-3. - DOI - PMC - PubMed
    1. Foster E, Wildner H, Tudeau L, Haueter S, Ralvenius WT, Jegen M, et al. Targeted ablation, silencing, and activation establish glycinergic dorsal horn neurons as key components of a spinal gate for pain and itch. Neuron. 2015;85(6):1289–1304. doi: 10.1016/j.neuron.2015.02.028. - DOI - PMC - PubMed
    1. Zhu H, Gouaux E. Architecture and assembly mechanism of native glycine receptors. Nature. 2021;599(7885):513–517. doi: 10.1038/s41586-021-04022-z. - DOI - PMC - PubMed
    1. Kuhse J, Schmieden V, Betz H. Identification and functional expression of a novel ligand binding subunit of the inhibitory glycine receptor. J Biol Chem. 1990;265(36):22317–22320. doi: 10.1016/S0021-9258(18)45707-9. - DOI - PubMed
    1. Malosio ML, Marqueze-Pouey B, Kuhse J, Betz H. Widespread expression of glycine receptor subunit mRNAs in the adult and developing rat brain. EMBO J. 1991;10(9):2401–2409. doi: 10.1002/j.1460-2075.1991.tb07779.x. - DOI - PMC - PubMed

Publication types