. 2023 Jun 1;24(1):123.
doi: 10.1186/s13059-023-02960-7.

Pervasive tandem duplications and convergent evolution shape coral genomes

Affiliations

Pervasive tandem duplications and convergent evolution shape coral genomes

Benjamin Noel et al. Genome Biol. .

Abstract

Background: Over the last decade, several coral genomes have been sequenced allowing a better understanding of these symbiotic organisms threatened by climate change. Scleractinian corals are reef builders and are central to coral reef ecosystems, providing habitat to a great diversity of species.

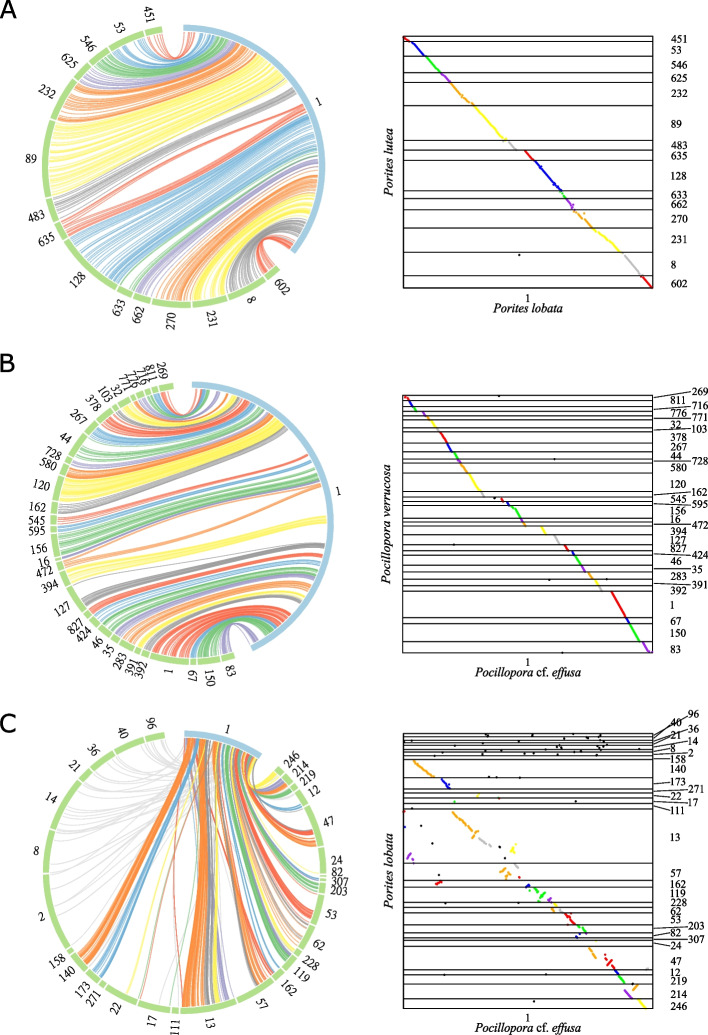
Results: In the frame of the Tara Pacific expedition, we assemble two coral genomes, Porites lobata and Pocillopora cf. effusa, with vastly improved contiguity that allows us to study the functional organization of these genomes. We annotate their gene catalog and report a relatively higher gene number than that found in other public coral genome sequences, 43,000 and 32,000 genes, respectively. This finding is explained by a high number of tandemly duplicated genes, accounting for almost a third of the predicted genes. We show that these duplicated genes originate from multiple and distinct duplication events throughout the coral lineage. They contribute to the amplification of gene families, mostly related to the immune system and disease resistance, which we suggest to be functionally linked to coral host resilience.

Conclusions: At large, we show the importance of duplicated genes to inform the biology of reef-building corals and provide novel avenues to understand and screen for differences in stress resilience.


Conflict of interest statement

The authors declare that they have no competing interests. JMA received travel and accommodation expenses to speak at Oxford Nanopore Technologies conferences.

Figures

Fig. 1
Fig. 1
Comparison of available coral genomes. Species from the complex clade are in orange, species from the robust clase are in red and the three genomes described in this study are in bold. A Rooted species tree of 25 cnidarian species based on OrthoFinder. B Genome assembly sizes are in megabases, green bars indicate the estimated genome size based on kmers calculated from short reads when available. C Contig N50 values in kilobases (log scale). D Number of annotated genes. E Proportion of genes containing a functional domain. F Proportion of genes in orthogroups (OG) that contain at least two different species. G BUSCO scores computed with the Metazoan gene set (N = 954 genes). Numbers in the blue bar represent the proportion of complete and single-copy genes in each gene catalog. NB: see Table S7 for information on assembly/annotation versions used
Fig. 2
Fig. 2
Coral synteny. Circular (left) and dotplot (right) representations of the synteny between the longest contigs. Each colored link represents linkage between two orthologous genes which are in a syntenic cluster. Colors of links represent syntenic clusters. Gray links connect orthologous genes that are not syntenic. Dotplots display only regions of contigs that contain orthologous genes. A Synteny between the longest contig of P. lobata (blue) and its syntenic scaffolds in P. lutea (green). B Synteny between the longest contig of P. cf. effusa (blue) and its syntenic scaffolds in P. verrucosa (green). C Synteny between the longest contig of P. cf. effusa (blue) and its syntenic contigs in P. lobata (green)
Fig. 3
Fig. 3
Quantification of tandemly duplicated genes (TDG) in coral genomes. A Number of TDG for each species. B Distribution of the number of genes per TDG cluster. C For 499 gene families (orthogroups with ≥ 10 genes in P. cf. effusa or P. lobata), the number of genes in Pocillopora and Porites species is compared to the normalized depth of mapping of short reads on OG consensus (i.e., estimated gene copy number based on mapping of short reads). Pie charts represent the proportion of TDG genes in each species. For Pocillopora damicornis, no value of depth was computed since we were not able to identify a set of Illumina short reads to download
Fig. 4
Fig. 4
Amplified gene families in corals vs sea anemones. A Average number of gene copies in corals vs sea anemones. Orthogroups colored in orange have significantly more gene copies in corals compared to sea anemones and orthogroups colored in blue have significantly less gene copies in corals compared to sea anemones (binomial test, adjusted p-value < 0.001). Dot sizes correspond to the ratio of TDG for each OG in 11 coral genomes. B Heatmap of gene copy numbers in 15 species for 192 OG amplified in corals and 28 OG amplified in sea anemones. The phylogenetic tree is the output of the OrthoFinder software. C Proportion of TDG in 192 OG amplified in corals (orange), 28 amplified in sea anemones (blue), and not amplified OG (gray). The pie charts represent the proportion of TDG among the OG amplified in corals or sea anemones, in Porites lobata (orange), Pocillopora cf. effusa (red) and in sea anemones (blue)
Fig. 5
Fig. 5
A Comparison of the number of genes in amplified gene families of Porites lobata and Pocillopora cf. effusa genomes. Gene families are grouped by their functional annotation. The largest gene family is indicated by a colored bar, for P. cf. effusa (red) and P. lobata (orange). B Ks distribution of Porites lobata and Pocillopora cf. effusa tandemly duplicated gene pairs (TDG) and allelic gene pairs (BRH between haplotype 1 and haplotype 2 annotations “hap1/hap2”). C Ks distributions for TDG pairs in P. lobata (Pl) and P. cf. effusa (Pm) for 11 orthogroups (OG) that are amplified in corals and contain NACHT domains
Fig. 6
Fig. 6
A Approximately maximum-likelihood phylogenetic tree obtained with FastTree after aligning proteins from OG0000106 (TIR-domain-containing orthogroup) in Porites lobata (orange dots) and Pocillopora cf. effusa (red dots). Colors correspond to tandemly repeated gene clusters (singletons are in red). B,C Trees obtained for 15 coral species for two individual TDG clusters. Dot colors correspond to species displayed in the species tree in D. E Distribution of Ks between pairs of genes in TDG clusters, in P. lobata and P. cf. effusa
Fig. 7
Fig. 7
A Map showing the 11 islands sampled during the Tara Pacific expedition. B Pearson correlations of gene expression profiles across the 103 samples for different values of dS between pairs of TDG. C Heatmap of expression quantification (z-score of mean TPM per OG) of amplified genes in coral genomes across the 103 samples. The column named Reference corresponds to RNA extracted from the same individual as that used for genome sequencing
Fig. 8
Fig. 8
A. Cumulative bar plot representing the number of genes in innate immune receptor OG identified from domain annotation of 14 cnidarian gene sets, for three innate immune receptor categories. B,C Domain composition of TIR-containing (B) and NACHT/NB-ARC (C) containing proteins in 5 coral species. Left panels: schematic view of domain composition. Right panels: number of genes in each species

References

    1. Connell JH. Diversity in tropical rain forests and coral reefs. Science. 1978;199:1302–1310. doi: 10.1126/science.199.4335.1302. - DOI - PubMed
    1. World Conservation Monitoring Centre, United Nations Environment Programme. World atlas of coral reefs. [Internet]. 2001. [quote: 2023, May] Available from: https://wedocs.unep.org/20.500.11822/30238
    1. Moberg F, Folke C. Ecological goods and services of coral reef ecosystems. Ecol Econ. 1999;29:215–233. doi: 10.1016/S0921-8009(99)00009-9. - DOI
    1. Knowlton N, Rohwer F. Multispecies microbial mutualisms on coral reefs: the host as a habitat. Am Nat. 2003;162:S51–S62. doi: 10.1086/378684. - DOI - PubMed
    1. Pogoreutz C, et al. The coral holobiont highlights the dependence of cnidarian animal hosts on their associated microbes. in Cellular Dialogues in the Holobiont (CRC Press, 2020).

Publication types

LinkOut - more resources