. 2023 Sep;52(9):645-661.
doi: 10.1177/03010066231178149. Epub 2023 Jun 2.

Responses to Raven matrices: Governed by visual complexity and centrality

Affiliations

Responses to Raven matrices: Governed by visual complexity and centrality

Joost C F de Winter et al. Perception. 2023 Sep.

Abstract

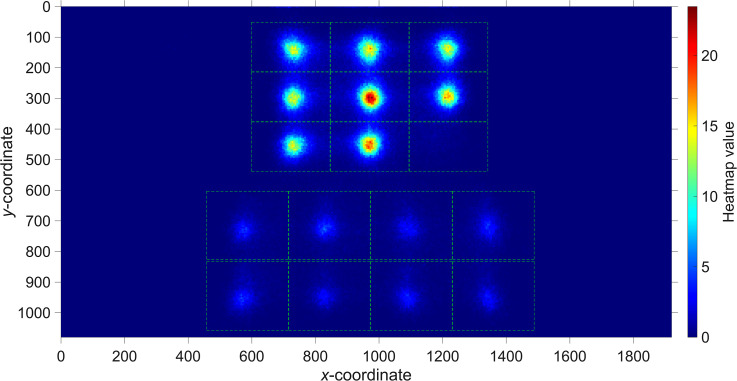
Raven matrices are widely considered a pure test of cognitive abilities. Previous research has examined the extent to which cognitive strategies are predictive of the number of correct responses to Raven items. This study examined whether response times can be explained directly from the centrality and visual complexity of the matrix cells (edge density and perceived complexity). A total of 159 participants completed a 12-item version of the Raven Advanced Progressive Matrices. In addition to item number (an index of item difficulty), the findings demonstrated a positive correlation between the visual complexity of Raven items and both the mean response time and the number of fixations on the matrix (a strong correlate of response time). Moreover, more centrally placed cells as well as more complex cells received more fixations. It is concluded that response times on Raven matrices are impacted by low-level stimulus attributes, namely, visual complexity and eccentricity.

Keywords: Raven Advanced Progressive Matrices; attention distribution; eye tracking; perception; visual complexity.


Conflict of interest statement

The authors declared no potential conflicts of interest with respect to the research, authorship, and/or publication of this article.

Figures

Figure 1.
Figure 1.
Example item of Raven matrices. The areas of interest (AOIs) are depicted as green outlines (not visible during the experiment). This item has been generated by the current authors to ensure that the original Raven matrices remain confidential and test integrity is preserved. Also shown are the centrality weights of the matrix cells used in regression analysis (described later in the Methods section).
Figure 2.
Figure 2.
One of the pairwise comparisons completed by participants through crowdsourcing.
Figure 3.
Figure 3.
Heatmap of all collected eye-gaze data. The heatmap was created by dividing the screen into squares of 5  ×  5 pixels, and counting the number of samples (after downsampling to 100 Hz), the squares were gazed at. All counts were then divided by the number of participants (159).
Figure 4.
Figure 4.
Matrix cells (96 in total, i.e., 12 Raven items  ×  8 cells per Raven item) sorted by edge density. Below each image, the edge density (in green) and perceived complexity (in yellow) are shown. Visual complexity ranks are shown in parenthesis, where 1 refers to the lowest value and 96 refers to the highest value.
Figure 5.
Figure 5.
Mean number of fixations on matrix cells versus edge density per Raven item (left) and versus perceived complexity per Raven item (right). Edge density and complexity were computed from the mean of the nine matrix cells for that Raven item. The numbers in the circular markers indicate the test item number.

Similar articles

Cited by

References

    1. Adam K. C. S., Vogel E. K. (2018). Improvements to visual working memory performance with practice and feedback. PLOS ONE, 13(8), e0203279. 10.1371/journal.pone.0203279 - DOI - PMC - PubMed
    1. Arthur W., Jr., Day D. V. (1994). Development of a short form for the Raven Advanced Progressive Matrices test. Educational and Psychological Measurement, 54(2), 394–403. 10.1177/0013164494054002013 - DOI
    1. Arthur W., Jr., Tubre T. C., Paul D. S., Sanchez-Ku M. L. (1999). College-sample psychometric and normative data on a short form of the Raven Advanced Progressive Matrices test. Journal of Psychoeducational Assessment, 17(4), 354–361. 10.1177/073428299901700405 - DOI
    1. Attneave F. (1957). Physical determinants of the judged complexity of shapes. Journal of Experimental Psychology, 53(4), 221–227. 10.1037/h0043921 - DOI - PubMed
    1. Bindemann M. (2010). Scene and screen center bias early eye movements in scene viewing. Vision Research, 50(23), 2577–2587. 10.1016/j.visres.2010.08.016 - DOI - PubMed

LinkOut - more resources