. 2023 Jun 23;133(1):25-44.
doi: 10.1161/CIRCRESAHA.122.322017. Epub 2023 Jun 2.

An ERK5-NRF2 Axis Mediates Senescence-Associated Stemness and Atherosclerosis

Affiliations

An ERK5-NRF2 Axis Mediates Senescence-Associated Stemness and Atherosclerosis

Jun-Ichi Abe et al. Circ Res. .

Abstract

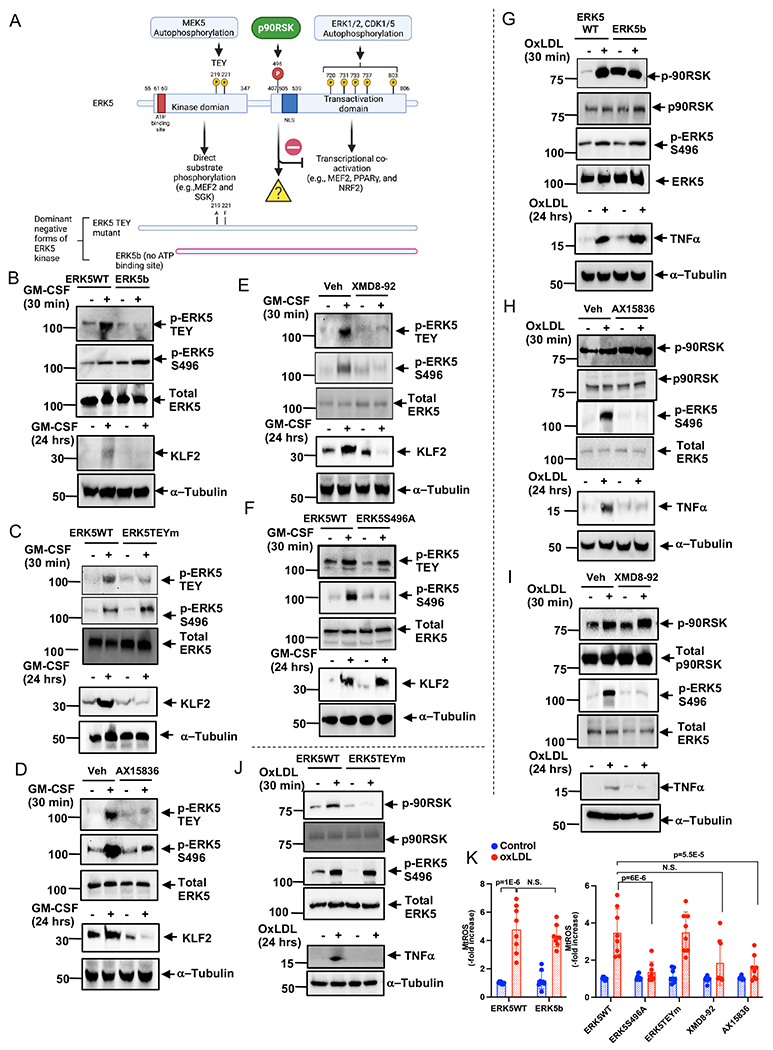
Background: ERK5 (extracellular signal-regulated kinase 5) is a dual kinase transcription factor containing an N-terminal kinase domain and a C-terminal transcriptional activation domain. Many ERK5 kinase inhibitors have been developed and tested to treat cancer and inflammatory diseases. However, recent data have raised questions about the role of the catalytic activity of ERK5 in proliferation and inflammation. We aimed to investigate how ERK5 reprograms myeloid cells to the proinflammatory senescent phenotype, subsequently leading to atherosclerosis.

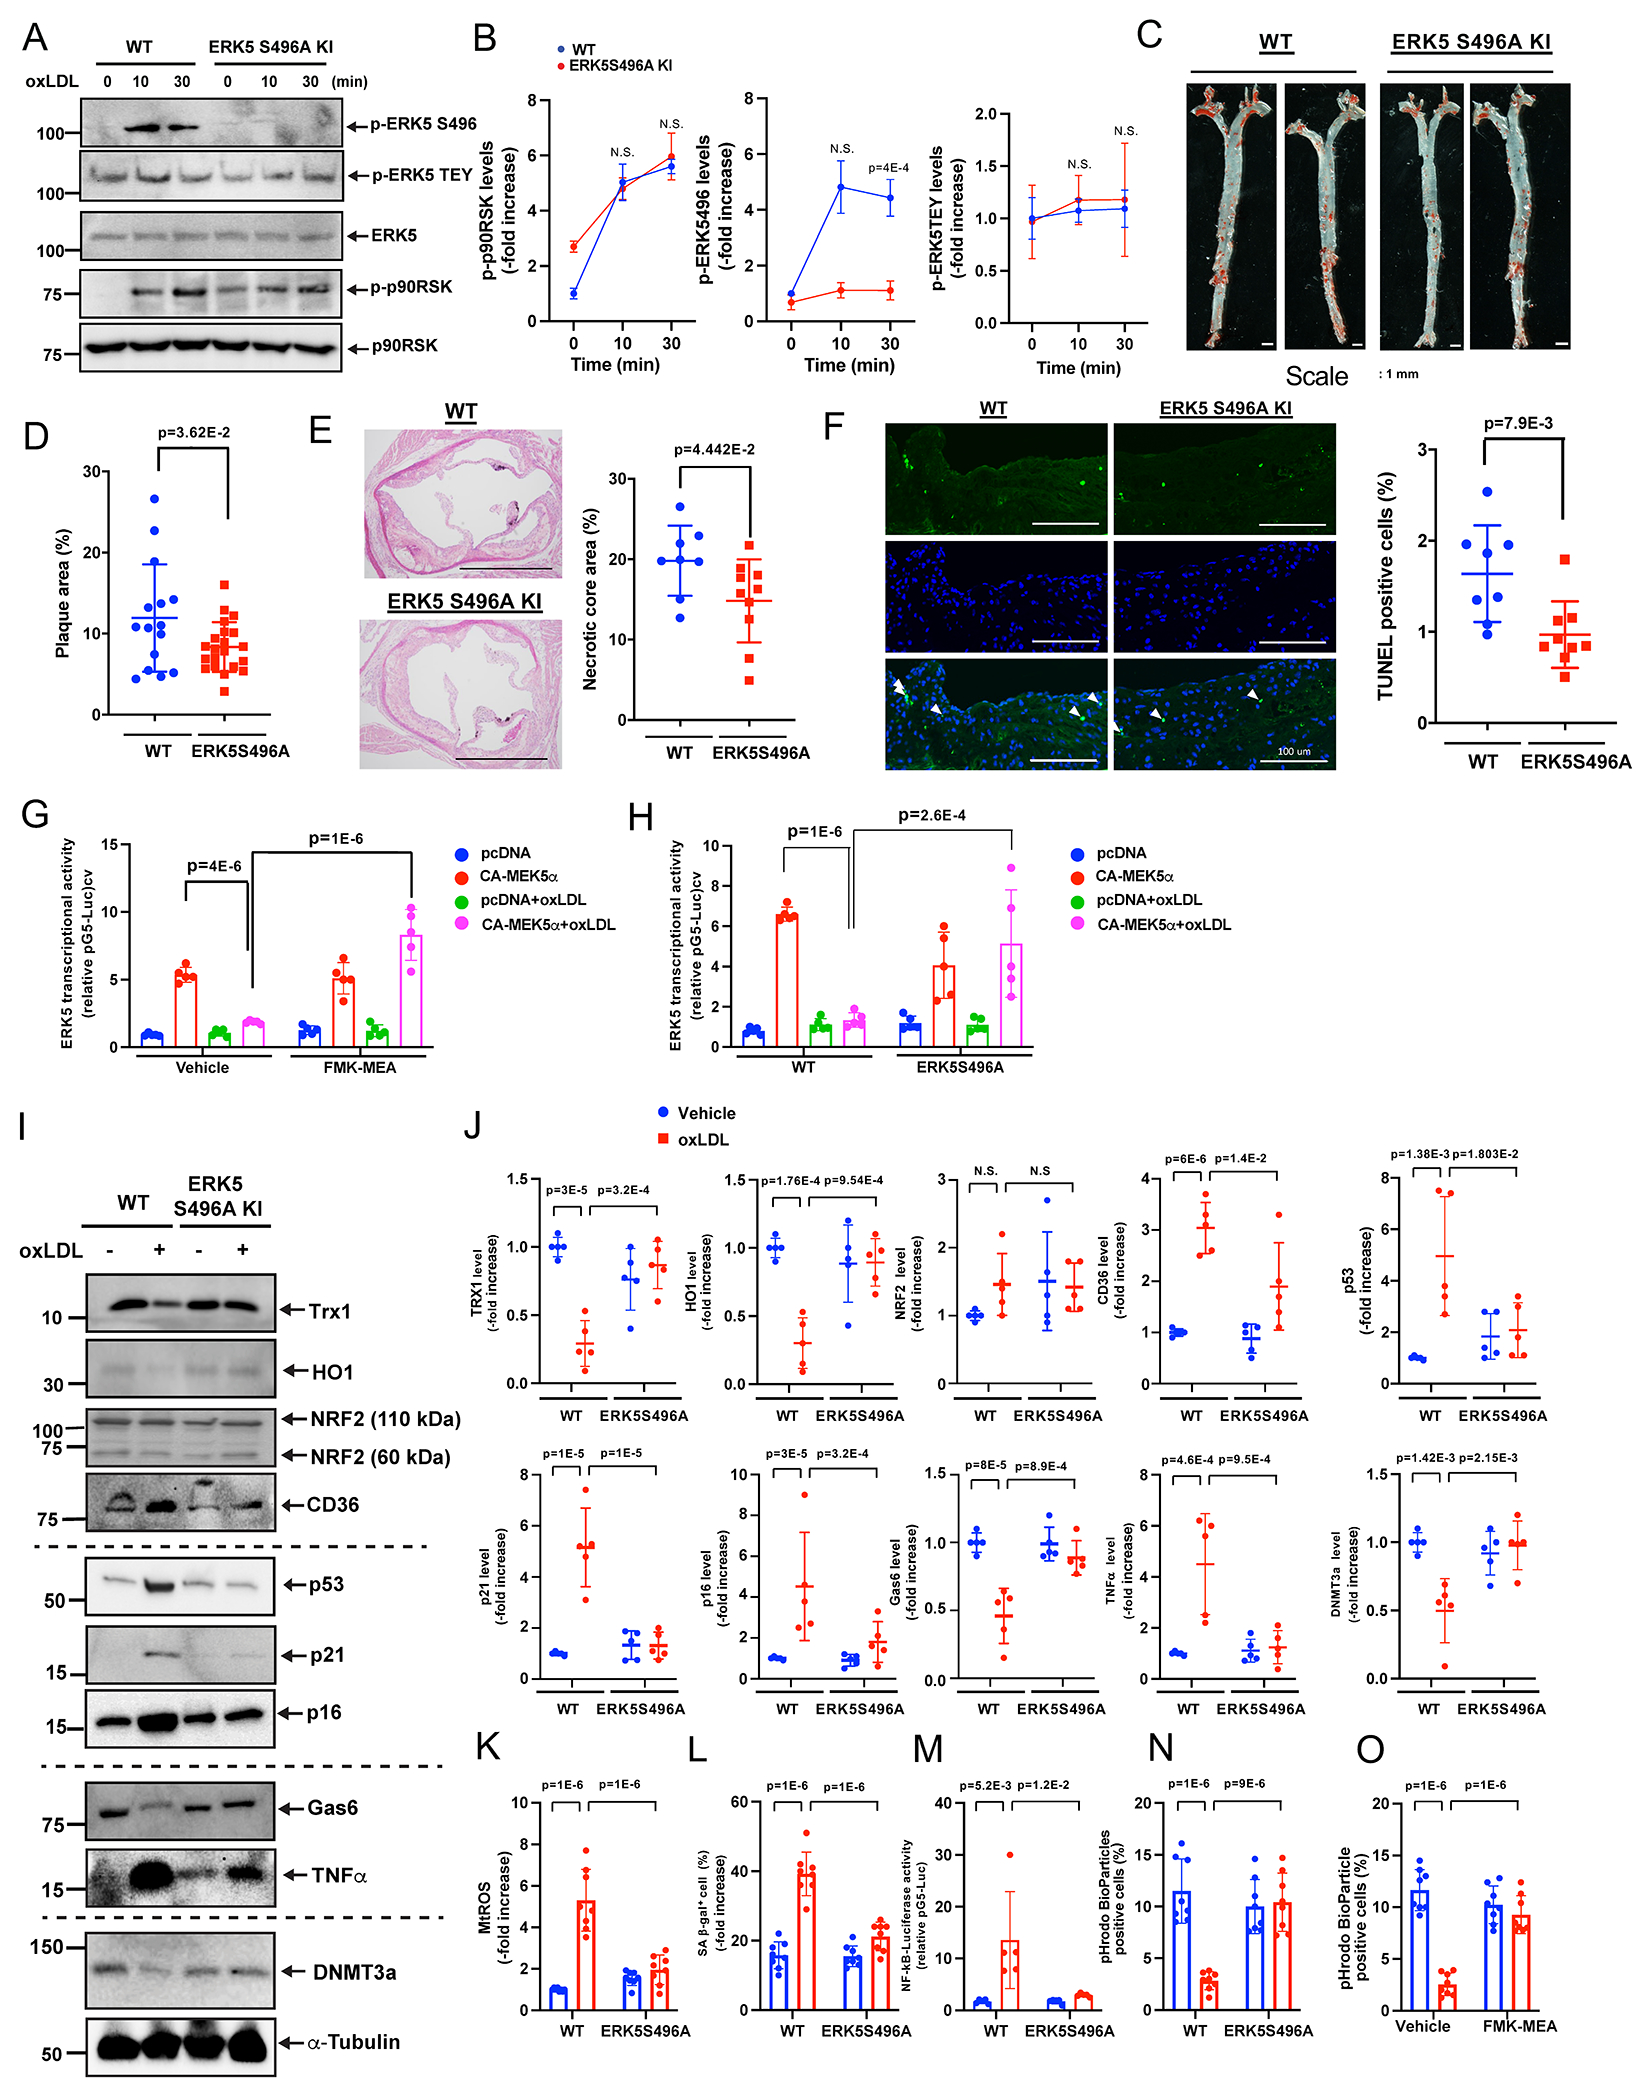
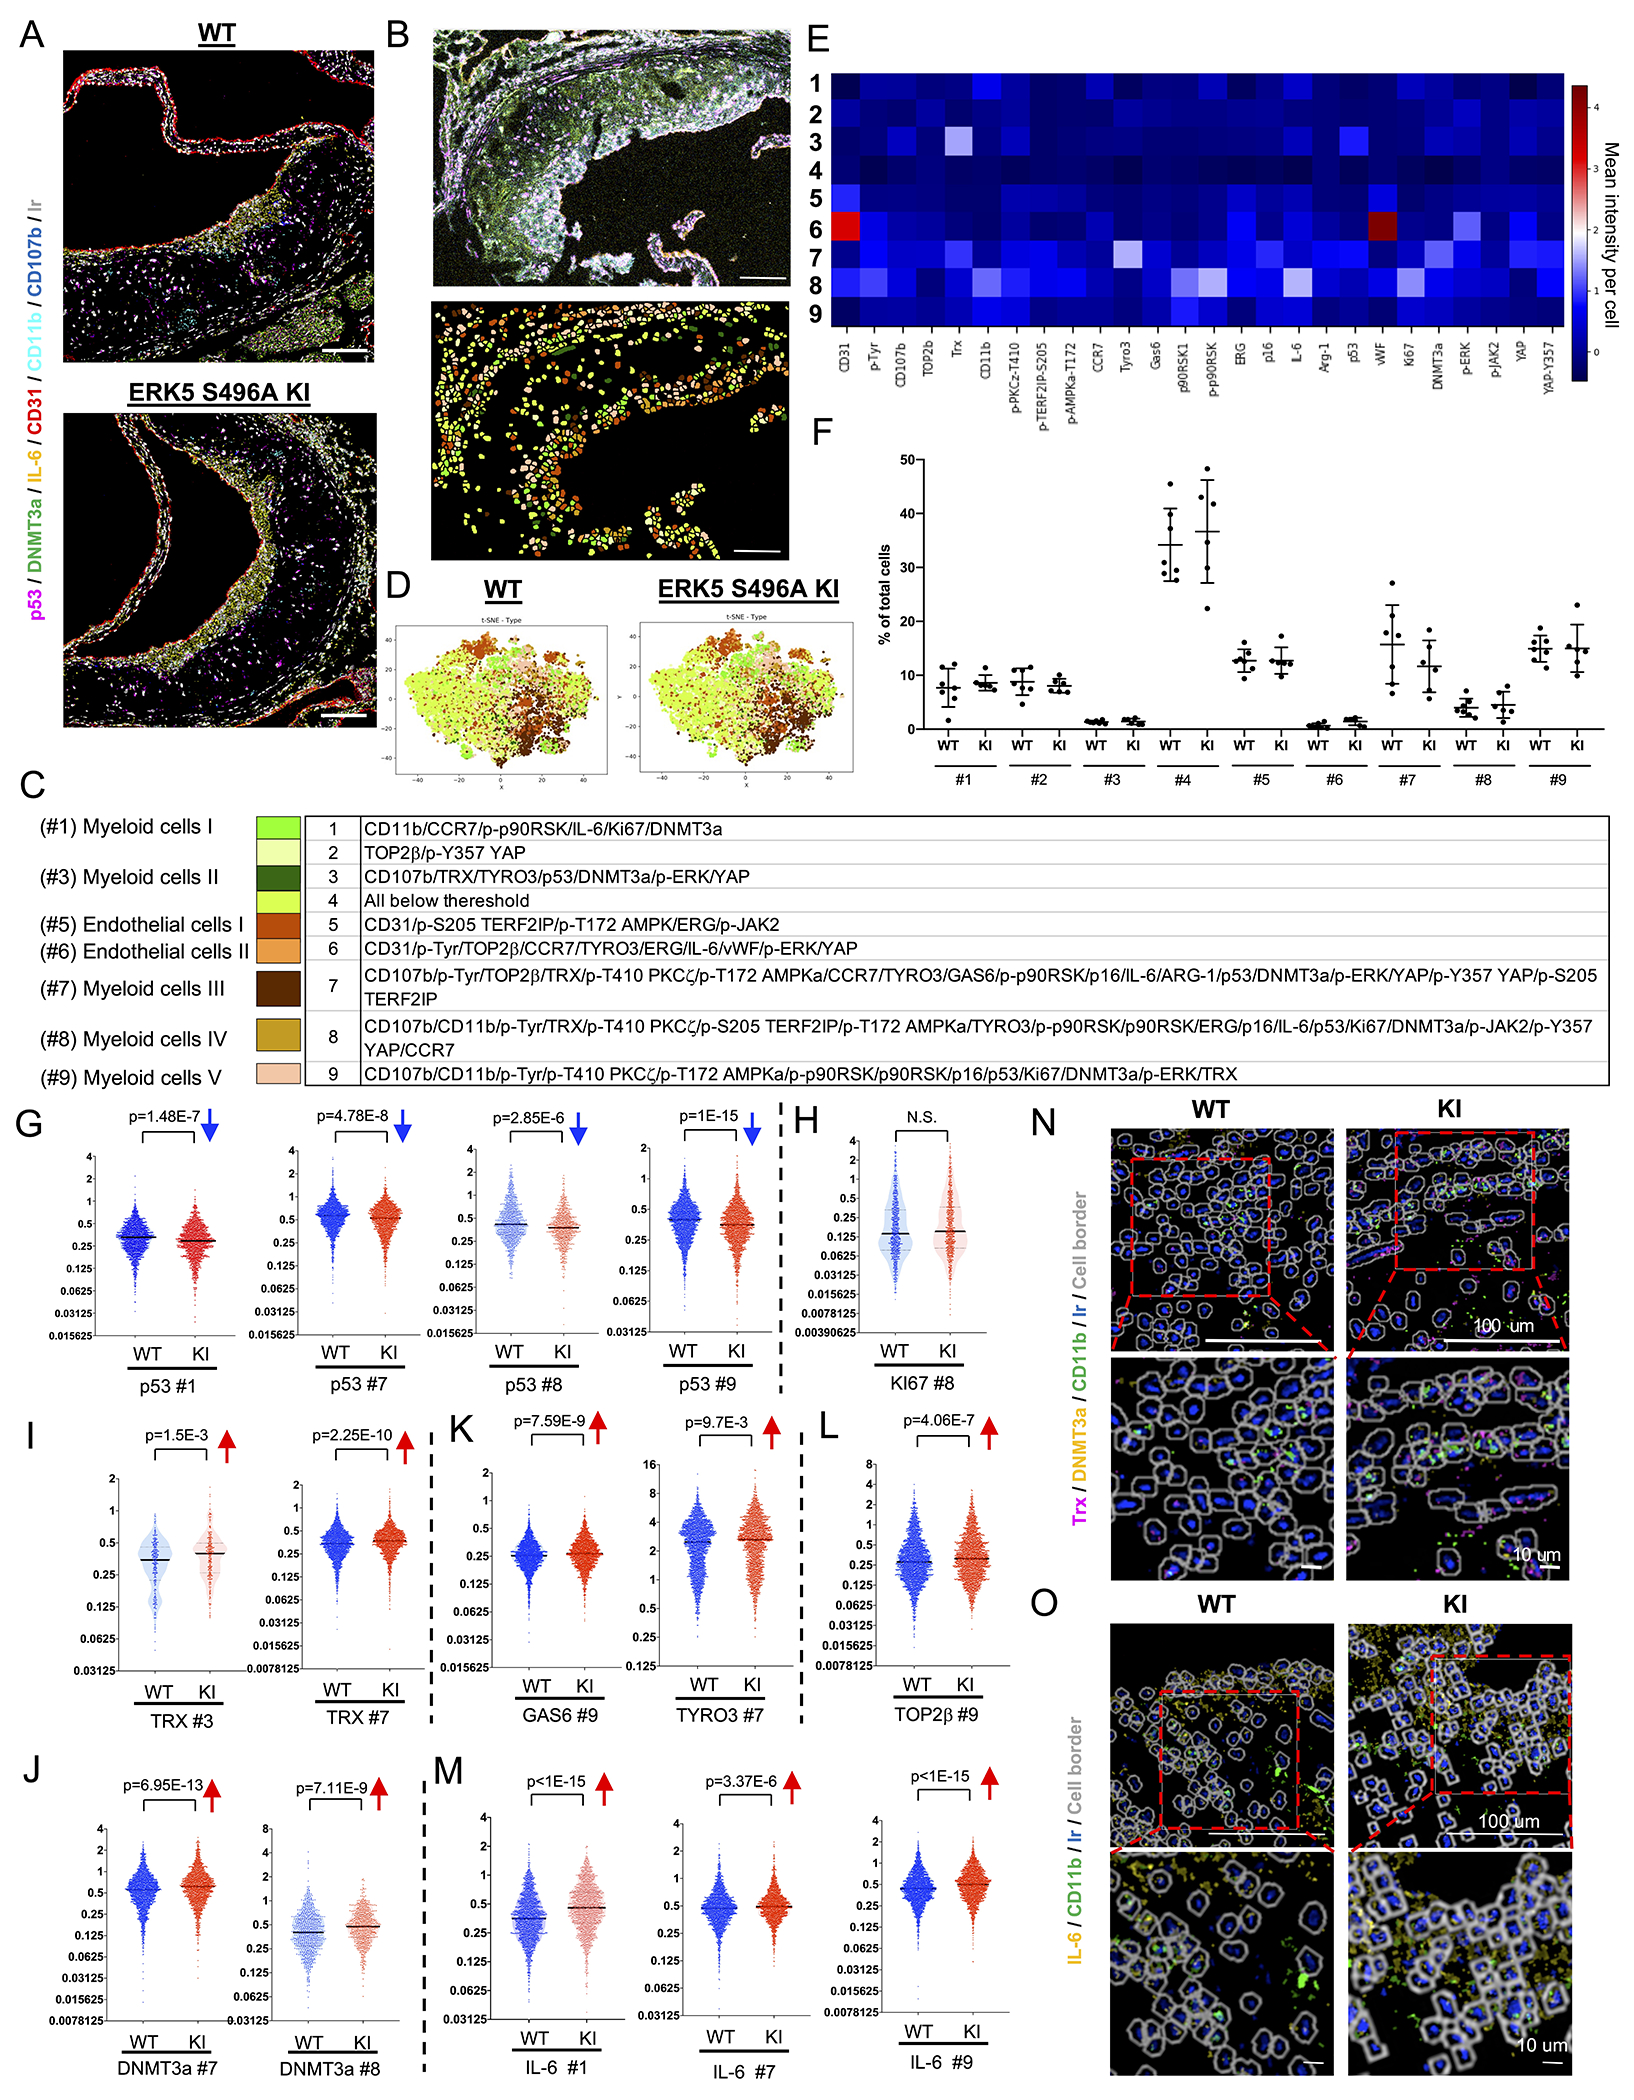
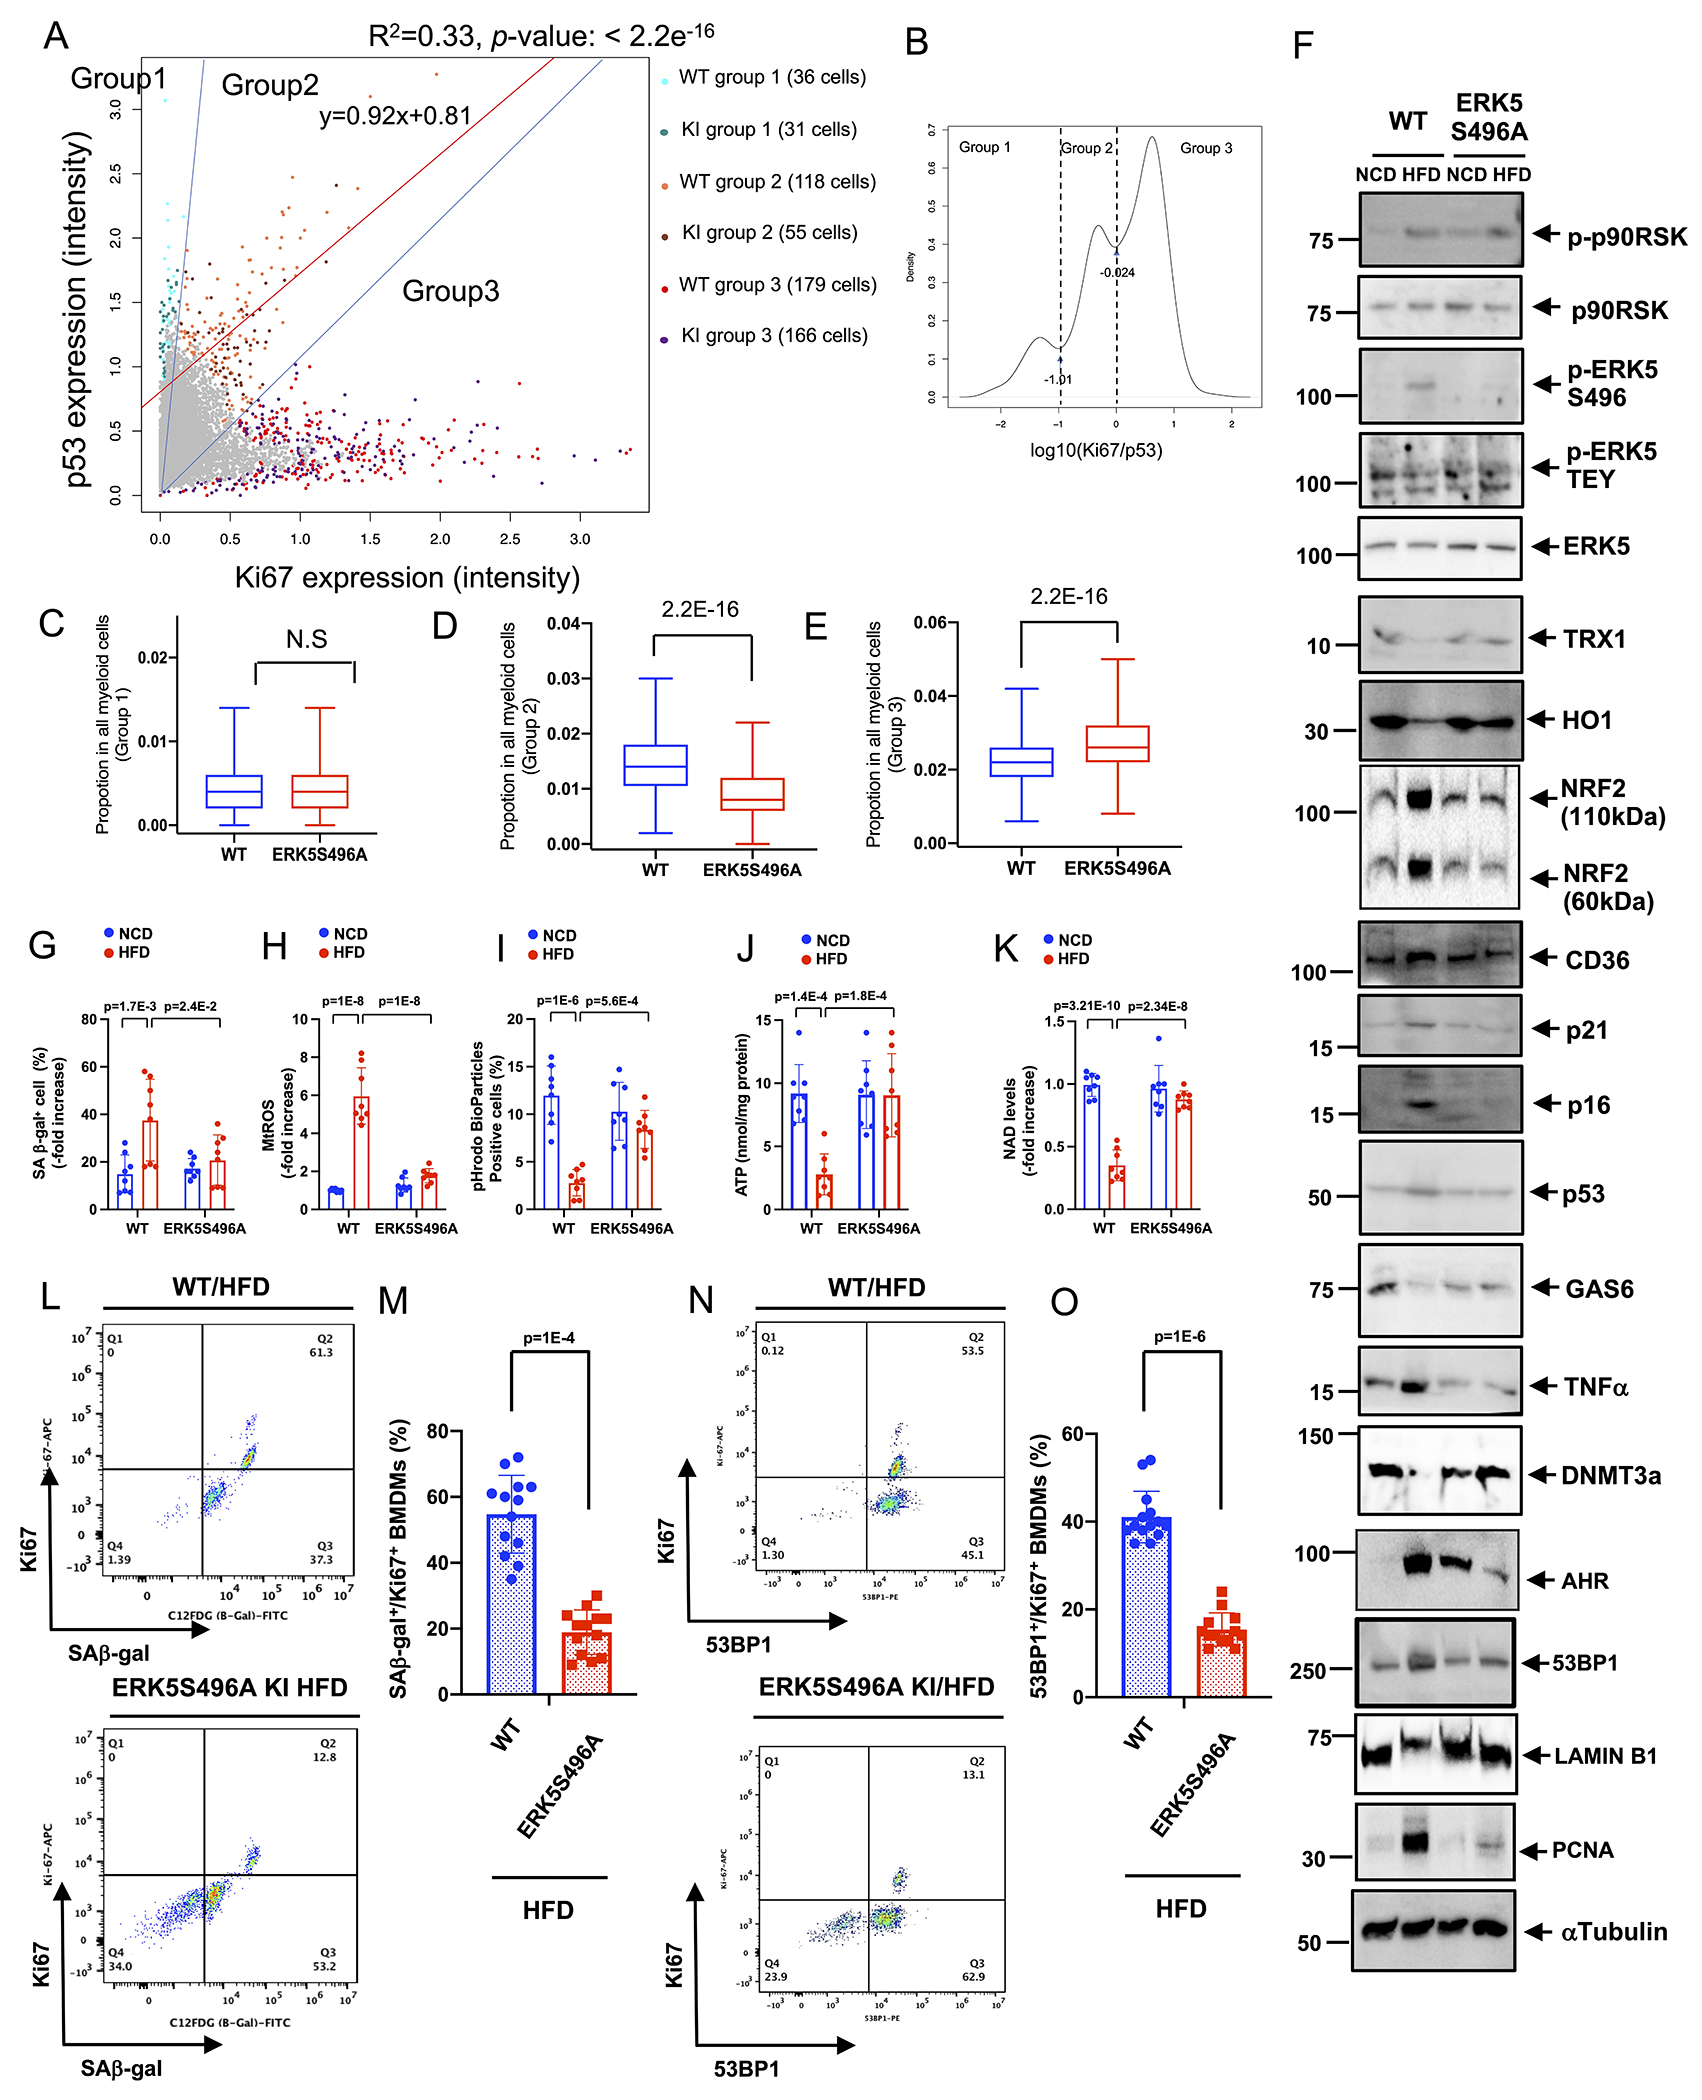
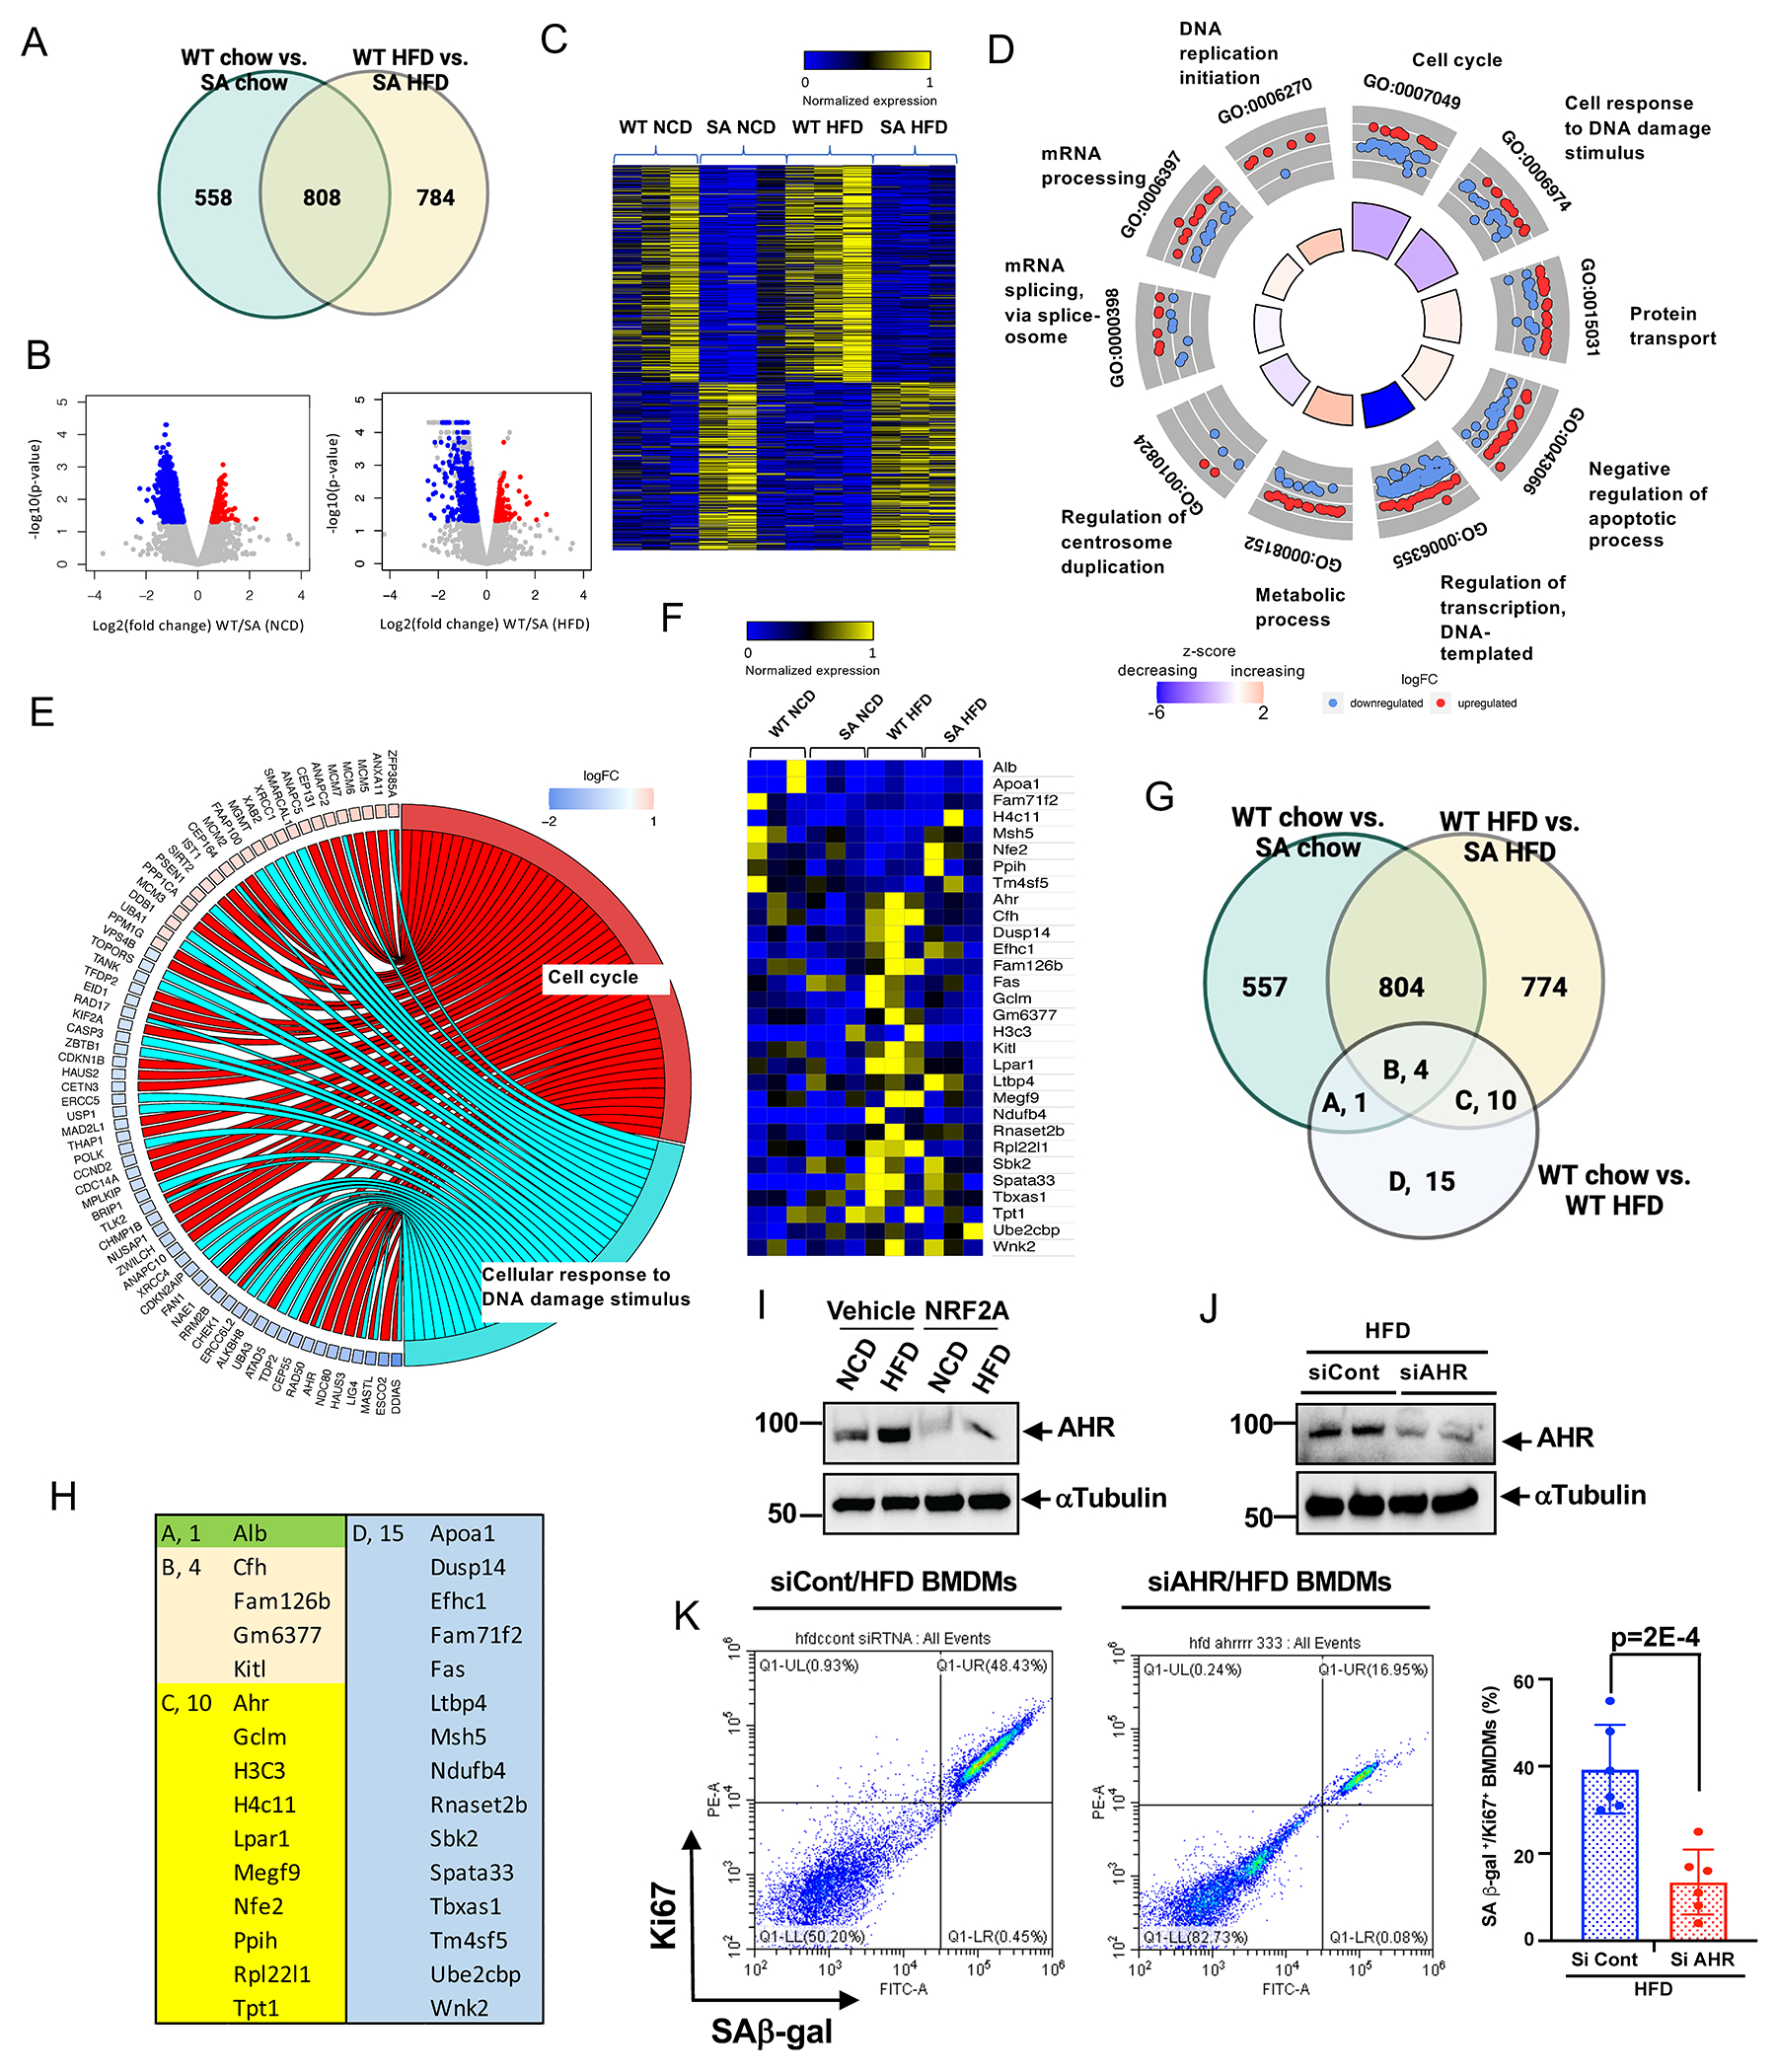
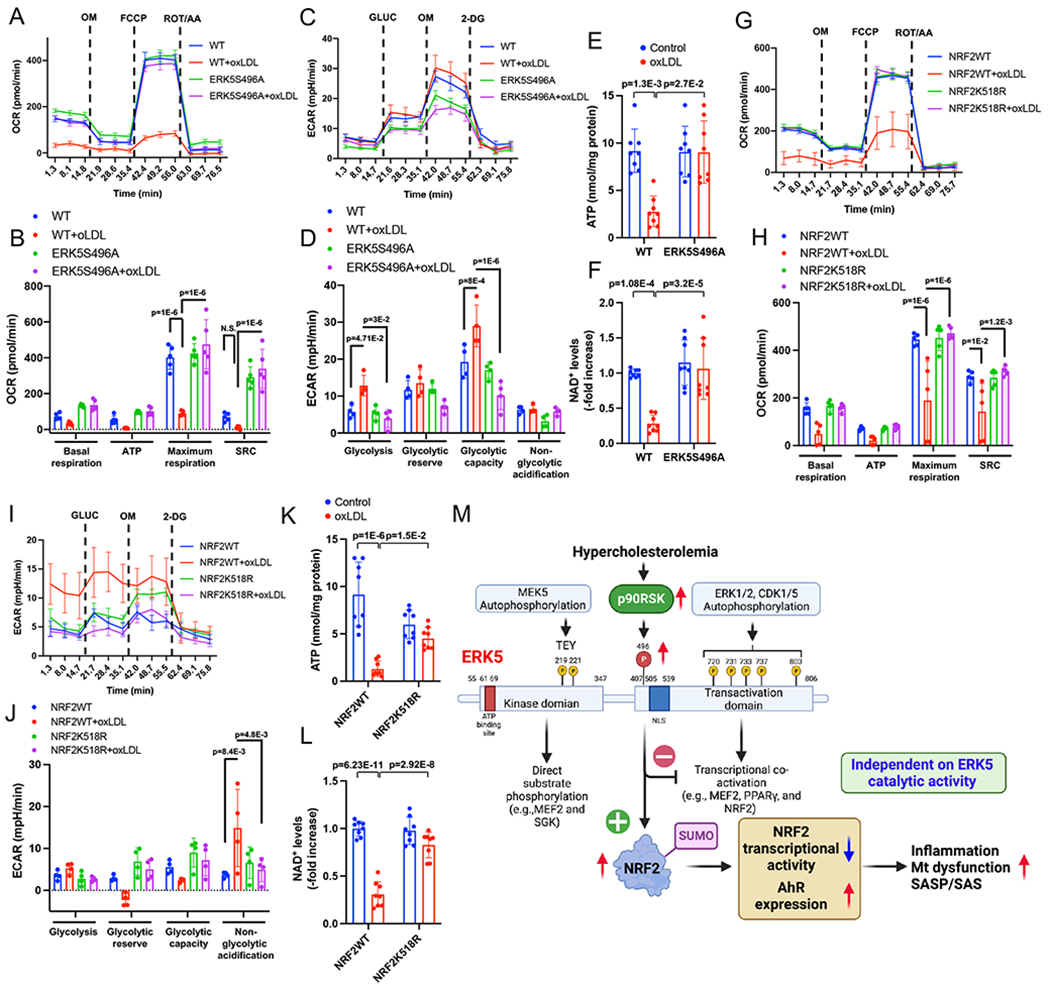
Methods: A ERK5 S496A (dephosphorylation mimic) knock in (KI) mouse model was generated using CRISPR/Cas9 (clustered regularly interspaced short palindromic repeats/clustered regularly interspaced short palindromic repeat-associated 9), and atherosclerosis was characterized by hypercholesterolemia induction. The plaque phenotyping in homozygous ERK5 S496A KI and wild type (WT) mice was studied using imaging mass cytometry. Bone marrow-derived macrophages were isolated from hypercholesterolemic mice and characterized using RNA sequencing and functional in vitro approaches, including senescence, mitochondria reactive oxygen species, and inflammation assays, as well as by metabolic extracellular flux analysis.

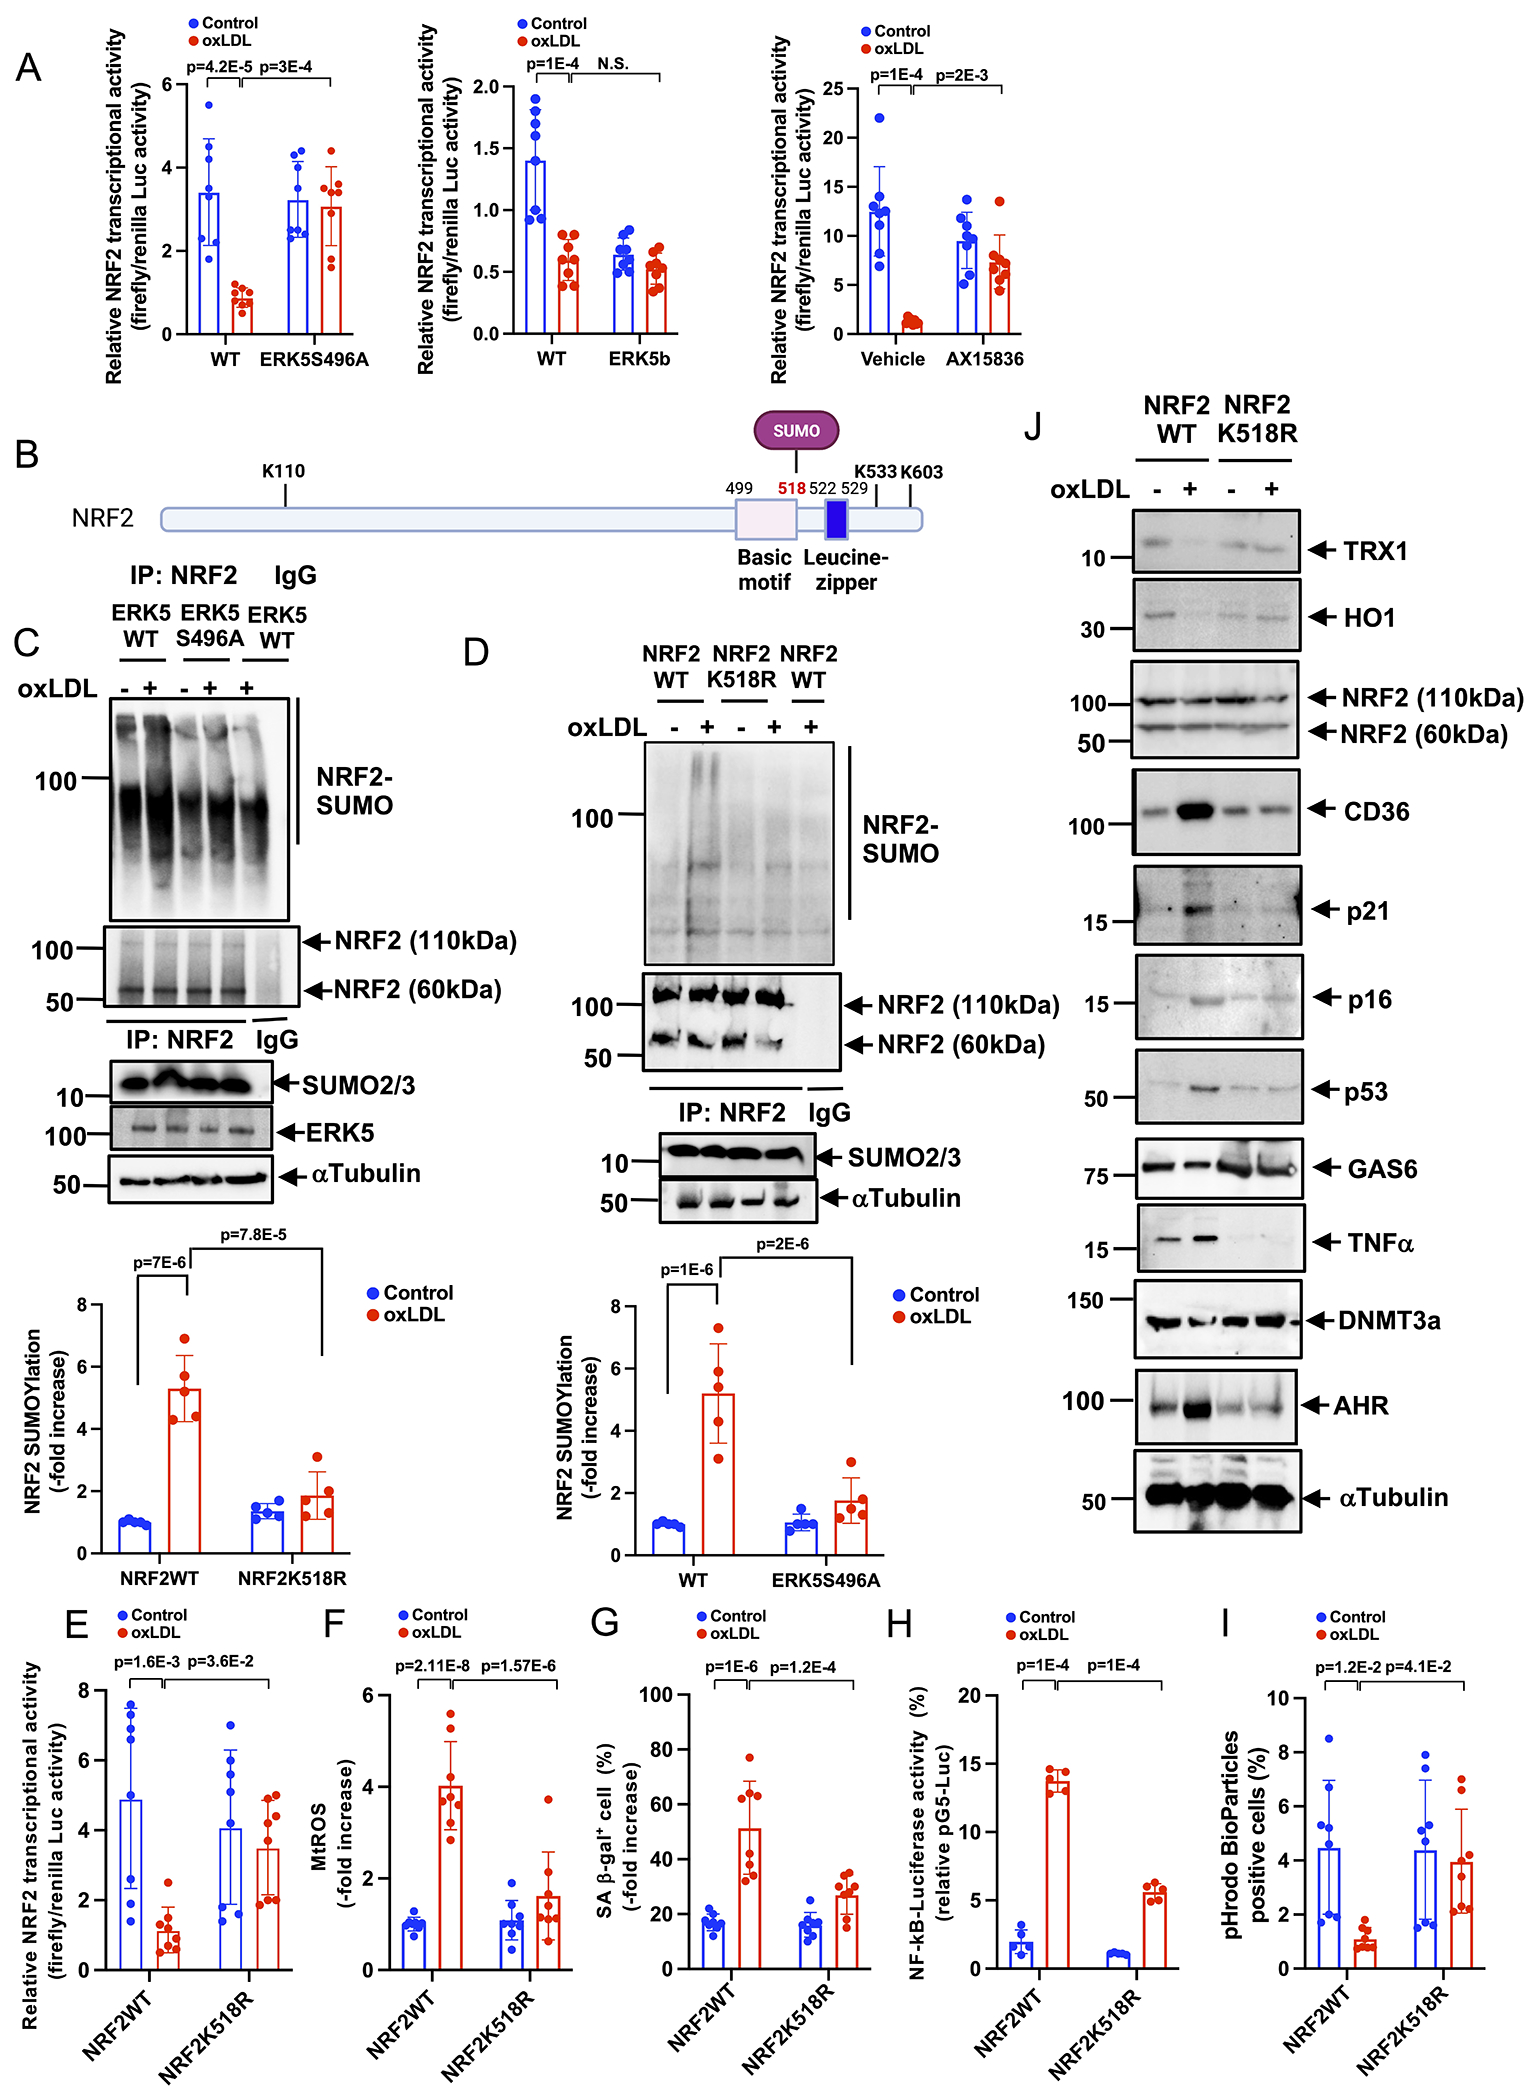
Results: We show that atherosclerosis was inhibited in ERK5 S496A KI mice. Furthermore, ERK5 S496 phosphorylation mediates both senescence-associated secretory phenotype and senescence-associated stemness by upregulating AHR (aryl hydrocarbon receptor) in plaque and bone marrow-derived macrophages isolated from hypercholesterolemic mice. We also discovered that ERK5 S496 phosphorylation could induce NRF2 (NFE2-related factor 2) SUMOylation at a novel K518 site to inhibit NRF2 transcriptional activity without altering ERK5 catalytic activity and mediates oxidized LDL (low-density lipoprotein)-induced senescence-associated secretory phenotype. Specific ERK5 kinase inhibitors (AX15836 and XMD8-92) also inhibited ERK5 S496 phosphorylation, suggesting the involvement of ERK5 S496 phosphorylation in the anti-inflammatory effects of these ERK5 kinase inhibitors.

Conclusions: We discovered a novel mechanism by which the macrophage ERK5-NRF2 axis develops a unique senescence-associated secretory phenotype/stemness phenotype by upregulating AHR to engender atherogenesis. The finding of senescence-associated stemness phenotype provides a molecular explanation to resolve the paradox of senescence in proliferative plaque by permitting myeloid cells to escape the senescence-induced cell cycle arrest during atherosclerosis formation.

Keywords: NF-E2-related factor 2 (NRF2); antioxidants; atherosclerosis; mitogen-activated protein kinase 7 (ERK5); receptors, aryl hydrocarbon (AHR); senescence-associated secretory phenotype; sumoylation.


Conflict of interest statement

Disclosures S.H. Lin is an Advisory Board member of AstraZeneca, Beyond Spring Pharmaceuticals, and STCube Pharmaceuticals. The other authors report no conflicts.

Figures

Figure 1:
Figure 1:. ERK5 S496 phosphorylation plays a crucial role in vulnerable plaque formation and SASP induction.
WT BMDMs and ERK5 S496A KI BMDMs were treated with oxLDL (10 μg/ml) for 0-30 minutes (A, B), and an immunoblotting analysis was performed using antibodies against the indicated proteins in vitro. (B) The graphs represent densitometry data from 3 independent gels, one of which is shown in A. (C, D) 16 weeks after AAV-PCSK9 injection and fed an HFD, ERK5 S496A KI mice exhibited fewer oil-red O-stained atherosclerotic lesions in the en face whole aorta, scale bars=1 mm. (D) Quantified oil-red O-stained lesions are shown. (n=15, 21, all male). (E) The area occupied by the necrotic core (acellular lipid core) is shown as the percentage of the total lesion area (E, right). Scale bar=1 mm. (n=8, 10). (F) Sections of proximal aortas from each group were labeled using TUNEL reagents to detect apoptotic cells and counterstained with DAPI to detect nuclei. Only double-positive cells (TUNEL and DAPI) were counted. Scale bar=100 μm. (F, right) The graph shows the percentage of TUNEL-positive cells (TUNEL+ cells/total cells counted) in the lesion area. Over 200 cells were counted for each group. (n=8, 9). (G, H) BMDMs treated with vehicle or FMK-MEA (G) or WT BMDMs and ERK5 S496A KI BMDMs (H) were incubated with oxLDL (10 μg/mL) or vehicle, and ERK5 transcriptional activity was detected. (I, J) WT BMDMs and ERK5 S496A KI BMDMs were treated with oxLDL (10 μg/ml) for 24 hours, and immunoblotting analysis was performed using antibodies against the indicated proteins in vitro. (J) The graphs represent densitometry data from 5 independent gels, one of which is shown in I. (K) WT BMDMs and ERK5 S496A KI BMDMs were incubated with oxLDL as indicated. mtROS levels were detected by MitoNeoD as described in methods section in vitro. Cells treated with oxLDL were assayed 24 hours later. (L) The percentages of cells positive for SA-β-gal staining are shown in vitro. More than 200 cells/sample were counted. (M) WT BMDMs and ERK5 S496A KI BMDMs were transfected with the NF-κB luciferase reporter and the constitutively expressing Renilla luciferase vector for 16 hours and then incubated with oxLDL or vehicle. After 12 hours, NF-κB transcriptional activity was measured as described in Methods in vitro. (N, O) BMDMs treated with vehicle or FMK-MEA (10 μM) (N) or WT BMDMs and ERK5 S496A KI BMDMs (O) were incubated with oxLDL (10 μg/mL) or vehicle. After 24 hours, pHrodo-positive cells were quantified in vitro. The applied statistical tests, sample number, and results in all figures are summarized in Table S3. All data are expressed as mean±SD, **P<0.01, *P<0.05.
Figure 2.
Figure 2.. Single cells-based clustering by imaging mass cytometry and SASP markers in WT and ERK5 S496A KI plaques in vivo.
(A) Six transient and single isotope signals from the markers and the Ir DNA-Intercalator signal were plotted. (B, upper) IMC analysis of tissues sectioned from WT and ERK5 S496A KI plaques. All 26 transient and single isotope signals from the markers and the Ir DNA-Intercalator signal were plotted. (B, lower, and C) After cell segmentation and phenotyping, 9 phenotypic clusters were identified in WT and ERK5 S496A KI plaque tissues. Each color indicates a cell cluster in C. (D) t-SNE plots of WT and ERK5 S496A KI plaque tissues. (E) Heatmap with 9 phenotypic clusters showed differentially regulated 26 molecules. (F) Cell number (%) in each cluster of total cells in each region of interest (ROI). We measured 18 ROIs from 7 WT samples and 18 ROIs from 6 ERK5 S496A KI samples and averaged the values from the same sample (n=7, 6). Data are expressed as mean±SD. Statistical significance was assessed by one-way ANOVA, and showed no difference between WT and ERK5 S496A KI. (G-M) The single-cell expression level of each marker in MC-like clusters between WT and ERK5 S496A KI plaque tissues. p53 expression levels in #1, #7, #8, and #9 were decreased in ERK5 S496A KI cells compared to in WT cells (G). Ki67 expression in the most inflammatory MC-like cluster (#8) was not changed between WT and ERK5 S496A KI cells (H). TRX expression levels in #3 and #7; DNMT3a in #7 and #8; TYRO3 in #7; GAS6 and TOP2β in #9; and IL-6 in #1, #7, and #9 were increased in ERK5 S496A KI cells compared to in WT cells (I-M). The Y-axis indicates the mean intensity, and solid black lines indicate the median value in each violin plot. (N, O) Staining images of each marker acquired by IMC were exported by the MCD viewer and merged with cell border images (gray) exported from VIS software. Ir (blue) is DNA. Upper images are low magnification (scale bar=100 μm), and lower images are high magnification (scale bar=10 μm). (N) Trx (magenta) and DNMT3a (yellow) in CD11b (lime)-positive myeloid cells were induced in ERK5 S496A KI compared to WT cells. (O) IL-6 (yellow) in CD11b (lime)-positive myeloid cells was induced in ERK5 S496A KI compared to WT cells. The applied statistical tests, sample number, and results in all figures are summarized in Table S3.
Figure 3.
Figure 3.. ERK5 S496 phosphorylation provokes SAS in vivo and ex vivo.
(A-E) Single-cell analysis of p53 and Ki67 expression in vivo. (B) The log scaled ratio of Ki67 and p53 of selected cells by log10(expression of Ki67/ expression of p53), and the cutoff of ratio with log10(−1.01) and log10(−0.024). (C-E) The % of ERK5 S496A KI cells in groups 1-3. KI and WT cells were resampled for 1,000 rounds to calculate the % of cells in groups 1-3. In each resampling round, 500 KI (or WT) cells were selected to calculate the % in group 1 (or group 2 or 3) by # of cells in group 1 (or group 2 or 3)/# of total cells. Wilcoxon test was performed as described in the methods. (F-O) BMDMs isolated from WT and ERK5 S496A KI mice fed a NCD or HFD for 4 months were cultured with the same medium ex vivo. (F) Immunoblotting analysis was performed using antibodies against the indicated proteins. We used the α-Tubulin expression as a loading control for each protein. (Quantification data was shown in Fig. S3.) (G) The percentages of cells positive for SA-β-gal staining are shown. (H) mtROS levels were detected by MitoNeoD as described in Methods. (I) Efferocytosis was detected by the quantification of pHrodo-positive cells (%). ATP (J) and NAD+ (K) were measured in BMDMs isolated from WT and ERK5S496A KI mice fed a NCD or HFD. (L) Co-expression of the fluorescent SA β-gal marker and Ki67 in BMDMs isolated from WT and ERK5 S496A KI mice after 4 months of HFD. (M) The graph showed % of double-positive SA-β-gal and Ki67 cells. (N) Co-expression of the fluorescent 53BP1 marker and Ki67 in BMDMs isolated from WT mice after 4 months of HFD. (O) The graph showed % of double-positive 53BP1 and Ki67 cells. n=13-14. The applied statistical tests, sample number, and results in all figures are summarized in Table S3. All data are expressed as mean±SD, **P<0.01, *P<0.05.
Figure 4.
Figure 4.. ERK5 S496 phosphorylation regulates the genetic profile of HC-mediated reprogrammed MCs and the critical role of AHR on SAS ex vivo.
(A) Venn diagram illustrating the gene expression patterns in each experimental group. (B) Volcano plot of BMDMs from WT and ERK5 S496A KI fed a normal chow diet (NCD) or high fat diet (HFD) RNA-seq adjusted p-value < 0.01, 1039 genes upregulated and 327 downregulated in WT vs. SA NCD, and 1174 genes upregulated, and 418 downregulated in WT vs. SA HFD. 3 samples/group. (C) Heatmap differentially regulated 784 genes only between WT HFD and ERK5 S496A KI HFD (SA HFD). (D) Functional enrichment analyses. GOcircle plots display scatter plots of log fold change (logFC) for selected GO terms. Red dots represent upregulated genes, and blue dots represent downregulated genes. The inner circles display z-scores calculated as the number of up-regulated genes minus the number of down-regulated genes divided by the square root of the count for a WT HFD and ERK5 S496A KI HFD. Up-regulated means that expression is higher in the ERK5 S496A KI HFD. (E) Circle plot of select genes indicated ontologies. Gene expression relative difference (log2 fold change). (F) Heatmap differentially regulated 30 genes only between WT NCD and WT HFD (WT HFD). (G) Venn diagram including the genes listed in E, and (H) the list of the genes. (I) AHR expression in BMDMs from WT fed a NCD or HFD after 24 hours of the vehicle or NRF2-KEAP1-binding inhibitory peptide, CAS 1362661 (NRF2A; 2 μM) treatment. (J) AHR expression in BMDMs from WT fed a HFD after AHR siRNA or control siRNA transfection. (K) Co-expression of the fluorescent SA-β-gal marker and Ki67 in BMDMs isolated from WT HFD after transfection of control siRNA and AHR siRNA Graph showed % of double-positive cells of SA-β-gal and Ki67. The applied statistical tests, sample number, and results in all figures are summarized in Table S3. Mean±SD, **P<0.01.
Figure 5.
Figure 5.. ERK5 TEY motif mutant and ERK5 specific kinase inhibitors inhibited ERK5 kinase activity and ERK5 S496 phosphorylation in vitro.
(A) The scheme of ERK5 kinase, transactivation domain, and phosphorylation sites. BMDMs were transfected with ERK5 WT or ERK5b (B, G), ERK5 TEY motif mutant (ERK5TEYm) (C, J), ERK5 S496A mutant (F), or pre-treated with AX15836 (D, H, 5 μM), XMD8-92 (E, I, 10 μM), or vehicle for 1 hour, then BMDMs were stimulated by GM-CSF (20 ng/ml, B-F), ox-LDL (10 μg/ml, G-K), or vehicle. Cell lysates were collected after 24 hours of stimulation, and western blotting was performed by the indicated antibodies. Representative images from 5 independent experiments are shown. (Quantification data was shown in Fig. S7.) (K) BMDMs were treated with indicated mutants and inhibitors as described above, and mtROS production was detected by MitoNeoD as described in the Methods. The applied statistical tests, sample number, and results in all figures are summarized in Table S3. Mean±SD, **P<0.01.
Figure 6.
Figure 6.. NRF2 K518 SUMOylation mediated by ERK5 S496 phosphorylation inhibits NRF2 transcriptional activity and subsequent SASP induction in vitro.
(A) BMDMs were transfected with the ERK5 WT, ERK5 S496A, or ERK5b plasmid, and ARE luciferase reporter and the constitutively expressing Renilla luciferase vector. After 16 hours of transfection, cells were pretreated with AX15836 for 1 hour and then treated with ox-LDL (10 μg/ml) or vehicle. After 12 hours, ARE transcriptional activity was measured as described in the Methods. (B) The scheme of NRF2 SUMOylation sites and DNA binding sites. (C) WT BMDMs and ERK5 S496A KI BMDMs were incubated with oxLDL or vehicle. After 0 or 30 min of oxLDL incubation, cell lysates were immunoprecipitated with anti-NRF2 or IgG control and immunoblotted with SUMO2/3 antibody. (D) BMDMs were transfected with GFP-tagged NRF2 K518R mutant or GFP tag plasmid. After 0 or 30 min of oxLDL incubation, cell lysates were immunoprecipitated with anti-NRF2 or IgG control and immunoblotted with SUMO2/3 antibody. The lower graphs represent densitometry data from 5 independent gels, one of which is shown in C and D. (E) WT BMDMs were transfected with NRF K518R mutant or NRF2 WT, the ARE luciferase reporter, and the constitutively expressing Renilla luciferase vector for 16 hours. Cells were treated with oxLDL (10 μg/mL) or vehicle, and 6 hours later, NRF2 transcriptional activity was measured as described in Methods. (F) WT BMDMs were transfected with NRF2 or control siRNA, and after 48 hours of transfection, mtROS levels were detected by MitoNeoD as described in Methods. Cells treated with oxLDL or vehicle were assayed 12 hours later. (G) The percentages of cells positive for SA β-gal staining are shown. More than 200 cells/sample were counted. (H) NF-κB transcriptional activity was measured as described in Fig. 1M in BMDMs transfected with NRF2 K518R mutant or wild type after 24 hrs of oxLDL or vehicle treatment. (I) BMDMs were incubated with oxLDL or vehicle after NRF2 K518R mutant or wild-type transfection. After 24 hours of oxLDL incubation, pHrodo-positive cells were quantified. (J) BMDMs transfected with NRF2 K518R mutant or wild type were treated with oxLDL (10 μg/mL) or vehicle. After 0-24 hours, Western blotting was performed with the indicated antibodies. Representative images from 5 independent experiments are shown. (Quantification was shown in Fig. S8C). The applied statistical tests, sample number, and results in all figures are summarized in Table S3. All data are expressed as mean±SD, **P<0.01, *P<0.05.
Figure 7.
Figure 7.. ERK5 S496 phosphorylation and NRF2 K518 SUMOylation mediate mitochondrial dysfunction in vitro.
(A-F) WT BMDMs and ERK5 S496A KI BMDMs and (G-L) BMDMs transfected with NRF2 K518R and control plasmid, incubated with oxLDL (10 μg/mL) or vehicle. These cells were then seeded on Seahorse plates. After 24 hours, OXPHOS and glycolysis parameters were measured. During extracellular flux analysis, cells were sequentially treated with (A, G) oligomycin (OM), carbonyl cyanide 4-(trifluoromethoxy) phenylhydrazone (FCCP), and rotenone plus antimycin A (ROT/AA) and used to assess OXPHOS parameters based on oxygen consumption rates. (B, H) The basal respiration, mt ATP production, maximal respiration, and spare respiratory capacity were calculated and plotted as oxygen consumption rates in pmoles/minutes. (C, I) Glucose (GLUC), OM, and 2-deoxyglucose (2-DG) were used to determine glycolysis parameters from extracellular acidification rates. (D, J) Glycolysis, glycolytic reserve, glycolytic capacity, and non-glycolytic acidification were calculated and plotted as the extracellular acidification rate in mpH/minutes. ATP (E, K) and NAD+ (F, L) were measured after 24 hrs of oxLDL (10 μg/mL) or vehicle treatment in WT BMDMs and ERK5 S496A KI BMDMs. (M) Proposed model of HC-mediated MC reprogramming to SASP/SAS by ERK5 S496 phosphorylation. The applied statistical tests, sample number, and results in all figures are summarized in Table S3. All data except A, C, G, and I are expressed as mean±SD, and others are expressed as mean±SEM, **P<0.01, *P<0.05.

References

    1. Singh MV, Kotla S, Le NT, Ae Ko K, Heo KS, Wang Y, Fujii Y, Thi Vu H, McBeath E, Thomas TN, et al. Senescent Phenotype Induced by p90RSK-NRF2 Signaling Sensitizes Monocytes and Macrophages to Oxidative Stress in HIV-Positive Individuals. Circulation. 2019;139:1199–1216. doi: 10.1161/CIRCULATIONAHA.118.036232 - DOI - PMC - PubMed
    1. Kitada M, Ogura Y, Koya D. The protective role of Sirt1 in vascular tissue: its relationship to vascular aging and atherosclerosis. Aging (Albany NY). 2016;8:2290–2307. doi: 10.18632/aging.101068 - DOI - PMC - PubMed
    1. Du W, Wong C, Song Y, Shen H, Mori D, Rotllan N, Price N, Dobrian AD, Meng H, Kleinstein SH, et al. Age-associated vascular inflammation promotes monocytosis during atherogenesis. Aging Cell. 2016;15:766–777. doi: 10.1111/acel.12488 - DOI - PMC - PubMed
    1. Wang JC, Bennett M. Aging and atherosclerosis: mechanisms, functional consequences, and potential therapeutics for cellular senescence. Circulation research. 2012;111:245–259. doi: 10.1161/CIRCRESAHA.111.261388 - DOI - PubMed
    1. Li W Phagocyte dysfunction, tissue aging and degeneration. Ageing research reviews. 2013;12:1005–1012. doi: 10.1016/j.arr.2013.05.006 - DOI - PMC - PubMed

Publication types

MeSH terms

Substances