. 2023 Jul-Aug;80(7-8):215-227.
doi: 10.1002/cm.21763. Epub 2023 Jun 2.

Caenorhabditis elegans septins contribute to the development and structure of the oogenic germline

Affiliations

Caenorhabditis elegans septins contribute to the development and structure of the oogenic germline

Jenna A Perry et al. Cytoskeleton (Hoboken). 2023 Jul-Aug.

Abstract

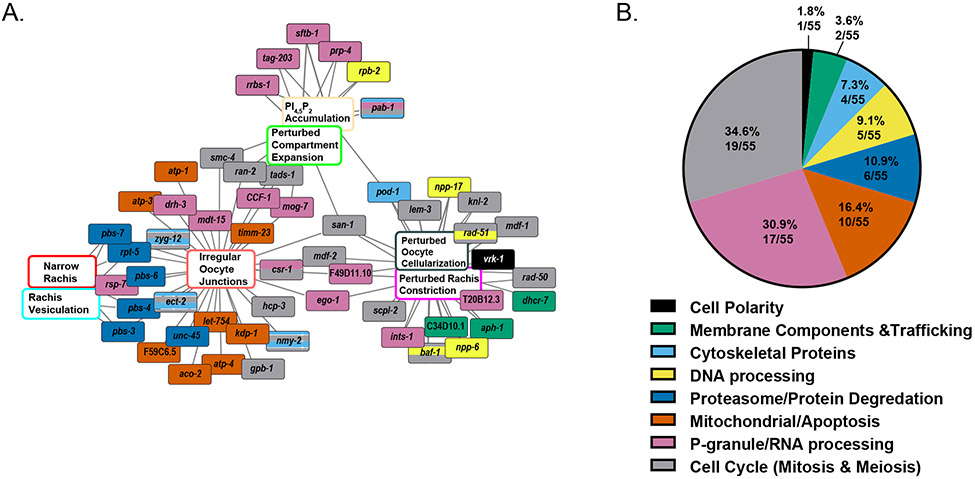
Oocytes must be exceptionally large cells in order to support embryonic development. Throughout animal phylogeny, a specialized cell called a syncytium, wherein many nuclei share a continuous cytoplasm, achieves oogenesis. The syncytial nature of germline architecture is key to its function and depends on conserved components of the cortical cytoskeleton. Septins form non-polar cytoskeletal polymers that associate with membranes. In the syncytial germline of the nematode Caenorhabditis elegans, septins are highly enriched on the cortex and generally required for fertility, but the role of septins in the germline is poorly understood. We report that the C. elegans septins, UNC-59 and UNC-61, are important for germline extension during development, the maintenance of its syncytial architecture, and production of oocytes. While much of our findings substantiate the idea that the two C. elegans septins act together, we also found evidence that they have distinct functions. Loss of UNC-61 perturbed germline extension during germline development, while the loss of UNC-59 function severely affected germline architecture in adult hermaphrodites. Consultation of clustering results from a large-scale high-throughput screen suggested that septins are involved in germ cell proliferation and/or differentiation. In sum, our findings implicate a conserved cytoskeletal component in the complex architecture of a germline syncytium.

Keywords: C. elegans; cell division; cytoskeleton; oogenesis; septins; syncytium.


Figures

Figure 1:
Figure 1:. Septin loss-of-function manifests in post-embryonic development defects.
(A) The number of unhatched embryos and live progeny (brood size) produced per worm within 48 hours by mCherry::H2B control (n=10), unc-59(e1005);mCherry::H2B (n=10), and unc-61(e228);mCherry::H2B (n=10). Brood size was significantly reduced in both septin loss-of-function strains (****, p ≤ 0.0001), with no statistically significant difference between the two septin loss-of-function strains. (B) Percentage of embryonic viability in broods produced by mCherry::H2B (n=10), unc-59(e1005);mCherry::H2B), and unc-61(e228);mCherry::H2B bearing strains. Embryonic viability was significantly reduced in the unc-61(e228);mCherry::H2B containing strain (*, p ≤ 0.05) (C) Schematic of bleach synchronization protocol. A culture plate of gravid C. elegans is bleached to isolate embryos. Those embryos are transferred to an unseeded culture plate for 24 hours to synchronize the animals at the larval-1 (L1) stage before being transferred to a seeded culture plate, where they will develop for three days before analysis. (D) Phenotype scoring of septin loss-of-function strains compared to control. Results are represented in the percent incidence of the phenotype occurring within the total population scored (mCherry::H2B, n = 120 animals; unc-59(e1005);mCherry::H2B, n = 139 animals; unc-61(e228);mCherry::H2B, n = 137 animals). A single worm may have more than one phenotype displayed. (E) Quantification of embryos in utero of 66 hours post-feeding adults. The wide variance of oocyte number in unc-59(e1005) may be due to the onset of ovulation but not egg laying at 66 hours post-feeding. The number of embryos in utero was not significantly different in unc-59(e1005) animals compared to controls, nor was it significantly different between unc-61(e228) and control animals There was also no significant difference between the two strains bearing the septin loss-of-function alleles. In all instances, n = 10 animals. Results in (B) and (D) are represented as average ± SD, and significance is determined by ANOVA (ns: not significant; ****, p≤ 0.0001).
Figure 2:
Figure 2:. C. elegans germline morphology and function are perturbed upon septin loss-of-function.
(A) Schematic illustrating the C. elegans germline with colored squares (orange, green, blue) representing areas where GFP or mKate2 intensity was measured using a line scan (rachis lining, −2 oocyte cytoplasm, and oocyte boundary, respectively; top) and Representative single optical section inverted contrast images of adult germlines expressing UNC-59::GFP and mKate2::ANI-1 in animals with only mKate2::ANI-1, co-labeled mKate2::ANI-1 and UNC-59::GFP, or co-labeled mKate2::ANI-1 and UNC-59::GFP animals containing the unc-61(e228) allele (bottom). Scale bar = 50 μm (B) Average UNC-59::GFP intensity as measured as a line scan on the rachis near pachytene. (B’) Average mKate2::ANI-1 intensity measured as a line scan on the rachis near pachytene in the strains described above. (C) Average UNC-59::GFP intensity as measured as a line scan in the cytoplasm of the −2 oocyte. (C’) Average mKate2::ANI-1 intensity measured as a line scan in the −2 oocyte cytoplasm of the strains described above. (D) Average UNC-59::GFP intensity as measured using a line scan on the oocyte boundary between the −1 and −2 oocytes. (D’) Average mKate2::ANI-1 intensity measured as a line scan on the −1/−2 oocyte boundary in the strains listed above. All measurements are background corrected by subtracting the fluorescence intensity values from a 10 x 10 μm box positioned outside the germline. The oocyte junction values are corrected by subtracting the average fluorescence intensity values of a linescan from the −2 oocyte cytoplasm. Results in (B)-(D) are represented as average ± SD, and significance is determined by an ANOVA corrected for multiple comparisons with Tukey’s Multiple Comparison Test.
Figure 3:
Figure 3:. Morphological characterization of the C. elegans germline.
A) Representative images (single optical section through the z-series and stitched, inverted contrast images) of the C. elegans germline labeled with a GFP PLCδ-PH domain membrane label and mCherry::H2B histone (not shown) in control and animals also bearing unc-59(e1005),or unc-61(e228) that were synchronized as described in Figure 1B and imaged at 72 hours post-synchronization. Images are annotated with respect to phenotypes quantified in Figures 3B-E. Briefly, bars denote the cellularized oocytes that were determined by examination when the rachis constricts (pink arrow) and the oocytes are no longer attached to the rachis. Phenotypes describing the junction membrane are in sky blue and phenotypes describing compartment morphology are in lime green, where lime stars also denote irregularly sized compartments. Phenotypes of oocyte membranes are highlighted in salmon. Insets of selected regions are 2-fold magnified, and scale bars = 50 μm. (B) Quantification of the total germline length from distal tip cell to the end of the −1 oocyte in control (n = 10 animals), unc-59(e1005) (n = 10 animals), and unc-61(e228) (n=10 animals). In both septin loss-of-function strains, the germline is significantly shorter than the control (p ≤ 0.0001), and the two loss-of-function strains are not significantly different from each other at 72 hours post-synchronization. (C) Number of oocytes completely separated from the rachis (cellularized) in controls (n = 24 animals), unc-59(e1005) (n = 24 animals), and unc-61(e228) (n = 24 animals). For unc-59(e1005) animals, there is a significant decrease in cellularized oocytes compared to control animals (p≤ 0.0001) and unc-61(e228) bearing animals (p≤ 0.01). Symbols are transparent for easier visualization of data points. (D) Percent incidence of germline phenotypes in animals containing GFP::PLCδ-PH domain membrane and mCherry::H2B histone labeled alone, or in conjunction with the , unc-59(e1005) or unc-61(e228) allele (n = 10 animals). The colored brackets group similar phenotypes, and the colors correspond to the phenotype groupings in figure 4A. The schematic (top) depicts the phenotypes measured based on the bracketed groups. Animals were synchronized as described in Figure 1B. Results in (B) –and(C) are average ± SD, and significance is determined by an ANOVA corrected for multiple comparisons with Tukey’s Multiple Comparison Test (ns: not significant; *, p≤ 0.05; **, p≤ 0.01; ****, p≤ 0.0001).
Figure 4:
Figure 4:. Morphological analysis of septin loss-of-function germlines predicts putative roles for septins in oogenesis.
(A) Clustering analysis of genes producing similar phenotypes to septin loss-of-function animals. Two genes (san-1 and F49D11.10) were shared between 3 or more categories. Colored phenotype categories correspond to groupings in Figure 3E. Gene colors correspond to GO Term analysis in Figure 4B. The colors and categories are as follows: black – cell polarity, green – membrane components and trafficking, sky blue – cytoskeletal proteins, yellow – DNA processing, blue – proteasome/protein degradation, orange – mitochondrial/apoptosis, pink – P-granule/RNA processing and grey – cell cycle. (B) Schematic depicting the proportion of hits categorized by GO Terms. Some hits fall into more than one category. Colors are as described above.
Figure 5:
Figure 5:. Loss of unc-61, but not unc-59, leads to perturbed germline development.
(A) Schematic of bleach synchronization and imaging protocol. (B) Representative (single optical section and inverted contrast) images of the C. elegans germlines labeled with GFP::PLCδ-PH domain membrane label and mCherry::H2B histone label in control, unc-59(e1005), and unc-61(e228) over developmental time. Arrows highlight the germline in early development. Scale bar = 50 μm. (C) Quantification of total germline length measured from the distal tip cell to the edge of the −1 oocyte closest to the spermatheca. In comparison to controls (n = 10 animals), unc-59(e1005) (n = 10 animals) develop similarly until 54 h post-feeding where the germlines reach terminal length. The unc-61(e228) bearing animals (n = 10 animals) undergo consistently slower development and thus have shorter germlines. These germline lengths are significantly shorter than the germlines of unc-59(e1005) bearing animals until roughly 54 h post-feeding, wherein germline length is not considered different between the two septin loss-of-function alleles. The 54 h and 66 h germline length from unc-61(e228)-bearing animals is not significantly different from each other (p = 0.1243). The 72 h post-feeding timepoint is repeated from Figure 3B for easier visualization. Results are shown as average ± SD. Significance was determined by a two-way ANOVA with the Geisser-Greenhouse Correction for sphericity and corrected for multiple comparisons using Tukey’s Multiple Comparisons Test, where *, p≤ 0.05; **, p≤ 0.01; ***, p≤ 0.001; and ****, p≤ 0.0001.
Figure 6:
Figure 6:. Mitotic and meiotic germline regions are perturbed in animals bearing unc-61(e228).
(A) Representative images of control GFP::PLCδ-PH domain membrane label and mCherry::H2B histone label animals and animals also containing the unc-61(e228) allele. The colored bars correspond to the colored zones in the schematic shown in 6B. Briefly, purple is the mitotic zone, blue is the transition zone, green is pachytene, and red is diplotene and diakinesis. (B) To the left, a schematization of the germline depicting the various germ cell zones (colors are described above). To the right, quantification of the percent length of the mitotic and meiotic zones in comparison to total germline length in controls (n = 13 animals), unc-59(e1005) (n = 16 animals), and unc-61(e228) (n= 18 animals). Compared to controls, unc-61(e228) animals have a shorter mitotic zone and larger pachytene. Results are shown as average ± SD. Significance was determined by a two-way ANOVA with the Geisser-Greenhouse Correction for sphericity and corrected for multiple comparisons using Tukey’s Multiple Comparisons Test, where *, p≤ 0.05; **, p≤ 0.01; ***, p≤ 0.001; and ****, p≤ 0.0001.

References

    1. Amini R, Goupil E, Labella S, Zetka M, Maddox AS, Labbé J-C, & Chartier NT (2014). C. elegans Anillin proteins regulate intercellular bridge stability and germline syncytial organization. Journal of Cell Biology, 206(1), 129–143. 10.1083/jcb.201310117 - DOI - PMC - PubMed
    1. Bauer J, Poupart V, Goupil E, Nguyen KCQ, Hall DH, & Labbé J-C (2021). The initial expansion of the C. elegans syncytial germ line is coupled to incomplete primordial germ cell cytokinesis. Development, 148(18), dev199633. 10.1242/dev.199633 - DOI - PMC - PubMed
    1. Beber A, Taveneau C, Nania M, Tsai F-C, Cicco AD, Bassereau P, Lévy D, Cabral JT, Isambert H, Mangenot S, & Bertin A (2019). Membrane reshaping by micrometric curvature sensitive septin filaments. Nature Communications, 10(1), 1–12. 10.1038/s41467-019-08344-5 - DOI - PMC - PubMed
    1. Bell KR, Werner ME, Doshi A, Cortes DB, Sattler A, Vuong-Brender T, Labouesse M, & Maddox AS (2020). Novel cytokinetic ring components drive negative feedback in cortical contractility. Molecular Biology of the Cell, 31(15), 1623–1636. 10.1091/mbc.E20-05-0304 - DOI - PMC - PubMed
    1. Brenner S. (1974b). The genetics of Caenorhabditis elegans. Genetics, 77(1), 71–94. 10.1093/genetics/77.1.71 - DOI - PMC - PubMed

Publication types

MeSH terms

LinkOut - more resources