. 2023 May 17:14:1196372.
doi: 10.3389/fendo.2023.1196372. eCollection 2023.

Integrating multiple machine learning methods to construct glutamine metabolism-related signatures in lung adenocarcinoma

Affiliations

Integrating multiple machine learning methods to construct glutamine metabolism-related signatures in lung adenocarcinoma

Pengpeng Zhang et al. Front Endocrinol (Lausanne). .

Abstract

Background: Glutamine metabolism (GM) is known to play a critical role in cancer development, including in lung adenocarcinoma (LUAD), although the exact contribution of GM to LUAD remains incompletely understood. In this study, we aimed to discover new targets for the treatment of LUAD patients by using machine learning algorithms to establish prognostic models based on GM-related genes (GMRGs).

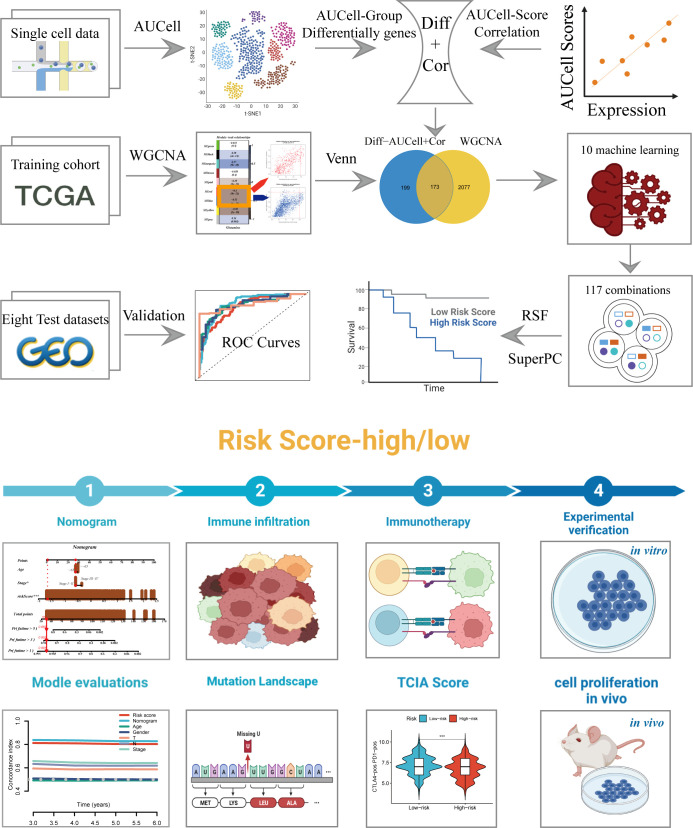
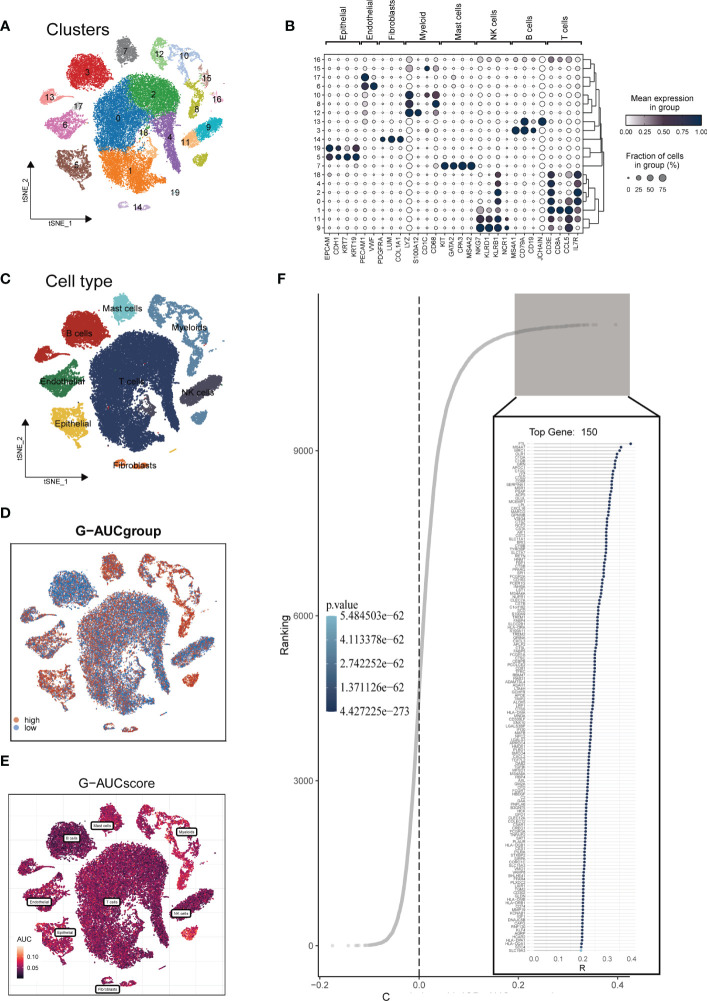
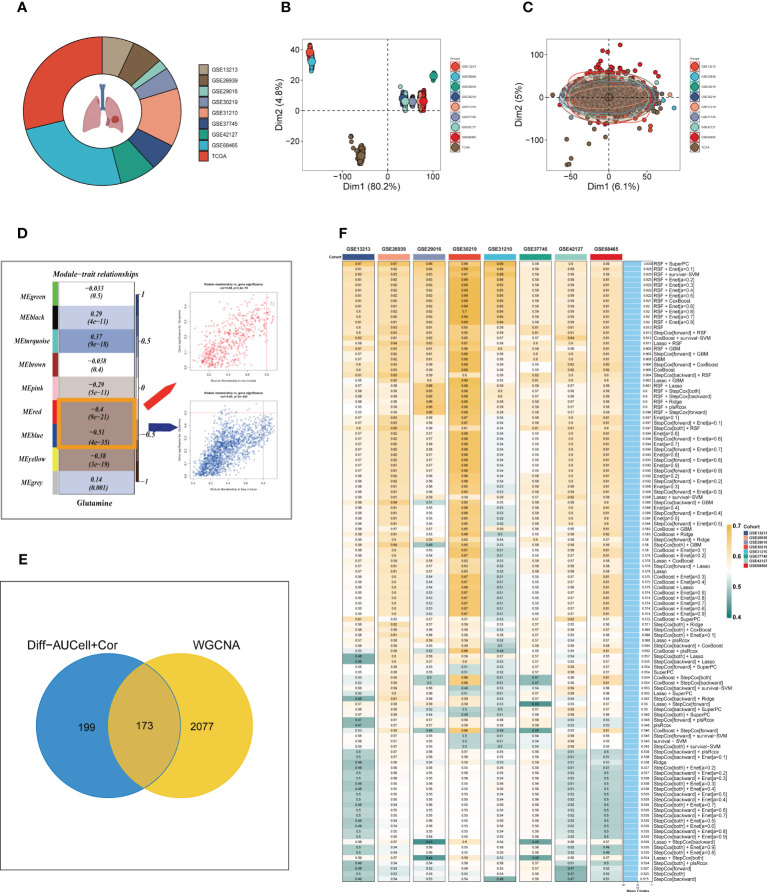
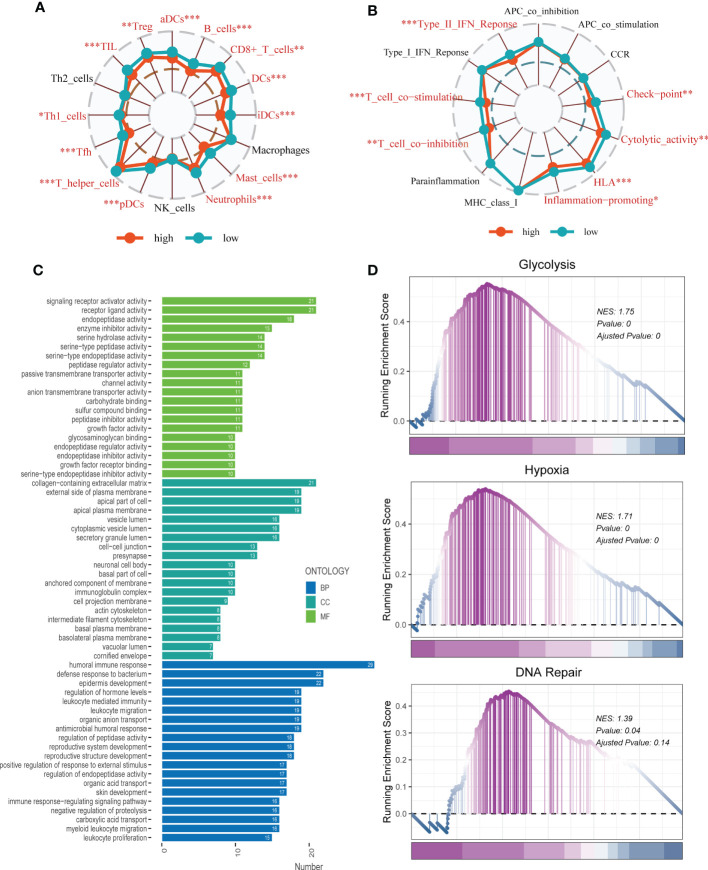
Methods: We used the AUCell and WGCNA algorithms, along with single-cell and bulk RNA-seq data, to identify the most prominent GMRGs associated with LUAD. Multiple machine learning algorithms were employed to develop risk models with optimal predictive performance. We validated our models using multiple external datasets and investigated disparities in the tumor microenvironment (TME), mutation landscape, enriched pathways, and response to immunotherapy across various risk groups. Additionally, we conducted in vitro and in vivo experiments to confirm the role of LGALS3 in LUAD.

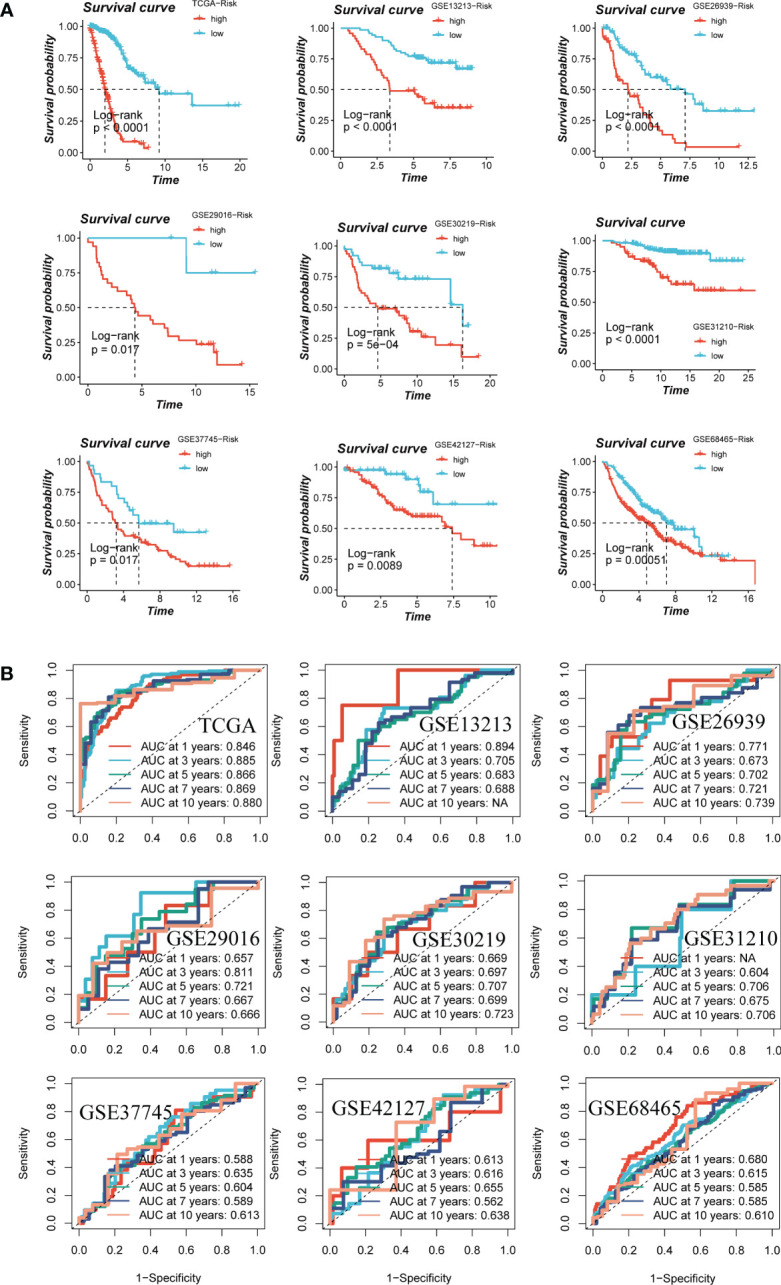
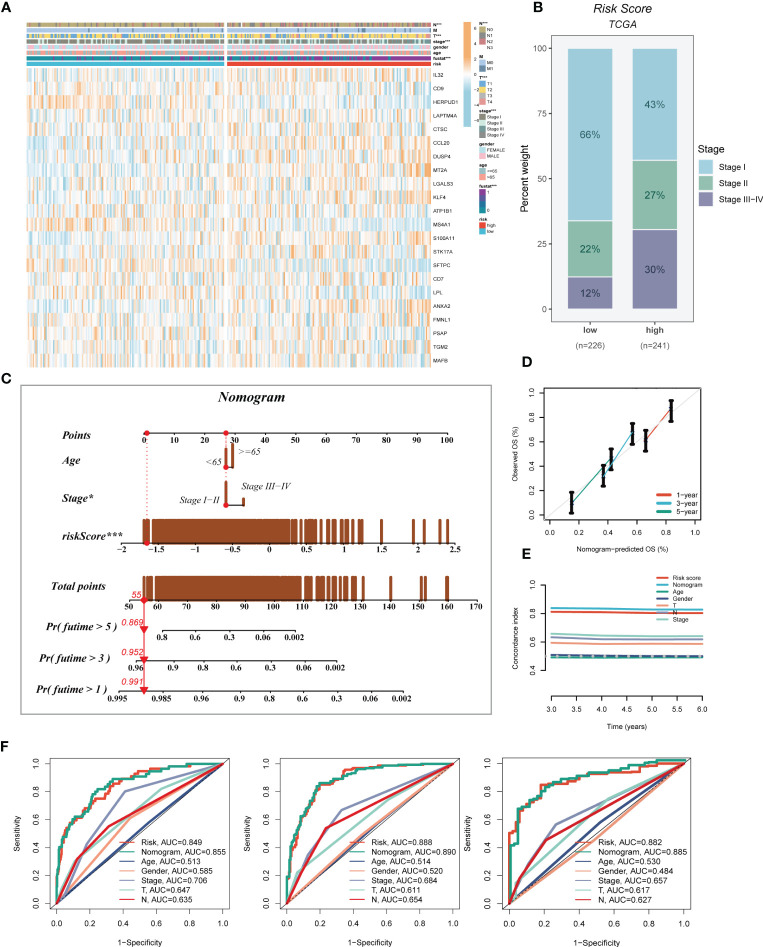
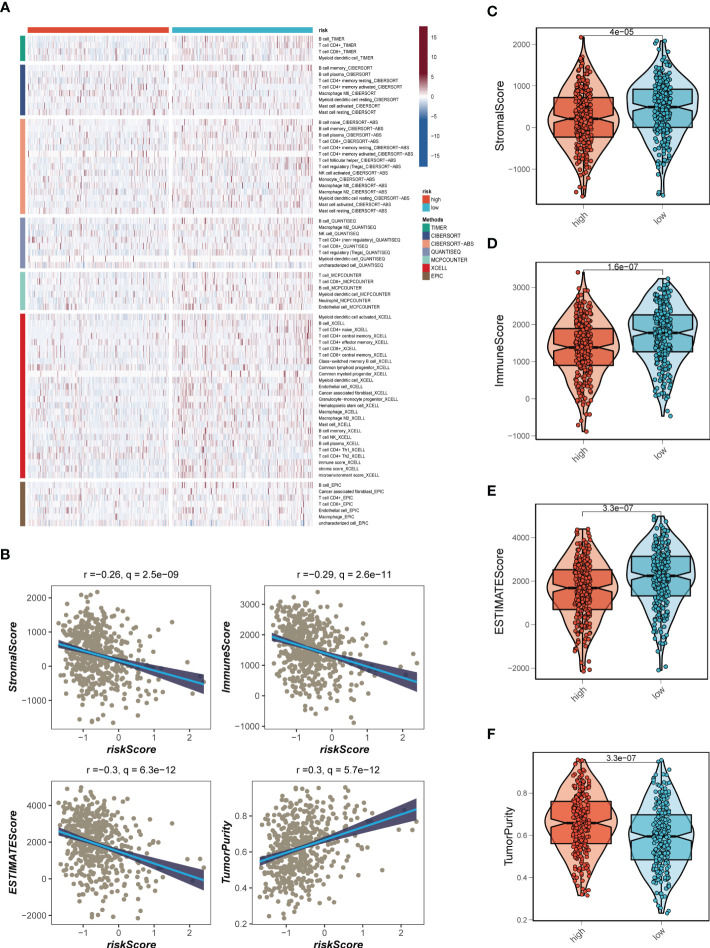
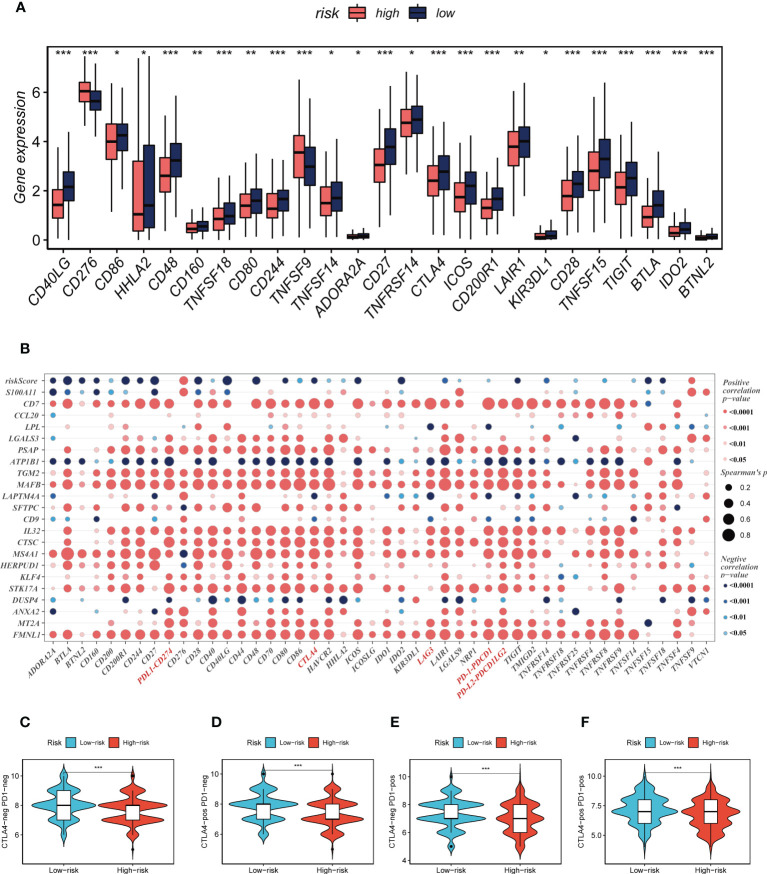
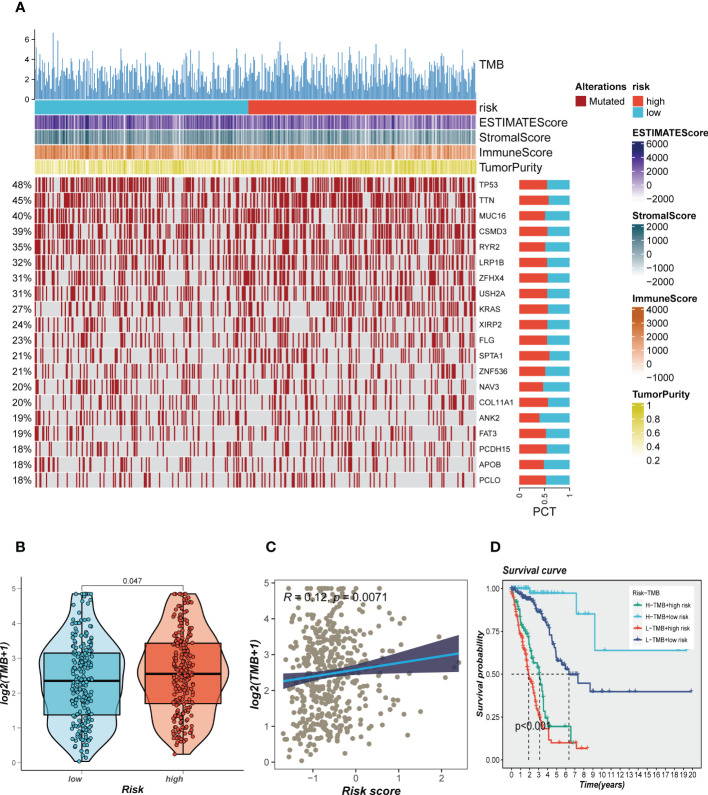
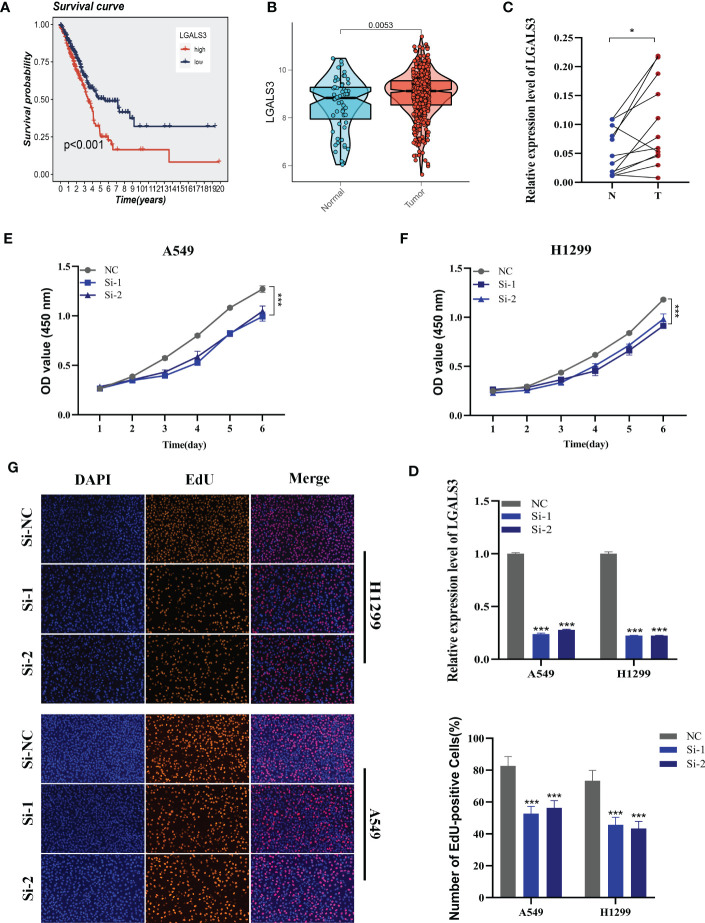
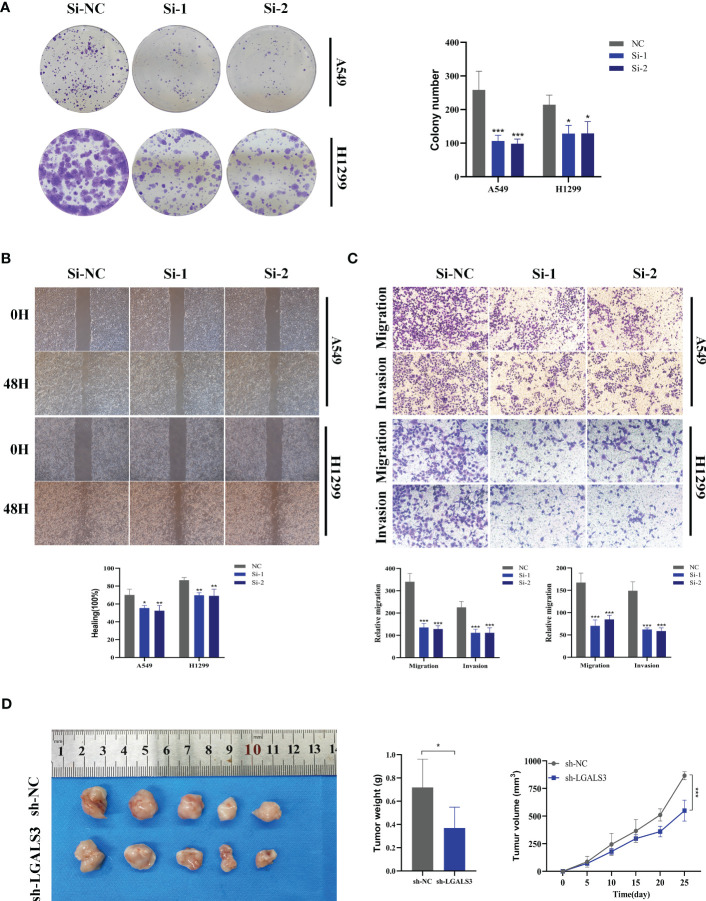
Results: We identified 173 GMRGs strongly associated with GM activity and selected the Random Survival Forest (RSF) and Supervised Principal Components (SuperPC) methods to develop a prognostic model. Our model's performance was validated using multiple external datasets. Our analysis revealed that the low-risk group had higher immune cell infiltration and increased expression of immune checkpoints, indicating that this group may be more receptive to immunotherapy. Moreover, our experimental results confirmed that LGALS3 promoted the proliferation, invasion, and migration of LUAD cells.

Conclusion: Our study established a prognostic model based on GMRGs that can predict the effectiveness of immunotherapy and provide novel approaches for the treatment of LUAD. Our findings also suggest that LGALS3 may be a potential therapeutic target for LUAD.

Keywords: glutamine; lung adenocarcinoma; machine learning; prognosis; signature.


Conflict of interest statement

The authors declare that the research was conducted in the absence of any commercial or financial relationships that could be construed as a potential conflict of interest.

Figures

Figure 1
Figure 1
The workflow of the present study.
Figure 2
Figure 2
Single-cell data annotation. (A) The t-SNE plot revealed that all cells were classified into 20 distinct clusters. (B) A bubble plot was created to display the typical marker genes for each cell cluster. (C) The t-SNE map was used to identify 8 different cell types in the TME, as represented by different colors. (D, E) The AUCell score and groups of GM activity for each cell were visualized. (F) Correlation analysis was performed between the SM-AUCell score and genes.
Figure 3
Figure 3
Construction of the GMAS. (A) The sources of samples and the proportion of sample size in 10 datasets were analyzed. (B, C) PCA plots before and after removal of batch effects for 10 datasets. (D) WGCNA analysis searched for the modules most associated with GM activity. (E) Venn plots identified the genes most associated with GM activity. (F) A total of 117 kinds of prediction models via LOOCV framework and further calculated the C-index of each model across all validation datasets.
Figure 4
Figure 4
Assessment of risk models. (A) Kaplan-Meier survival analysis of signatures in the TCGA and eight GEO datasets. (B) The ROC curve was used to evaluate the performance of the model in the TCGA and eight GEO datasets.
Figure 5
Figure 5
Developing an accurate nomogram. (A) A heatmap was generated to integrate clinical data with the expression of model genes. (B) The proportion of clinical stage was visualized in different risk groups. (C) The nomogram was constructed by combining clinical features with risk score. (D) Calibration plots were used to assess the consistency between actual OS rates and predicted survival rates. The 45° line represents the best possible prediction. (E) C-index curves were utilized to evaluate the predictive performance of different clinical characteristics, nomogram scores, and risk scores. (F) ROC curves were generated for 1, 3, and 5 years to illustrate AUC values for various clinical factors, risk scores, and nomogram scores. *P < 0.05, ***P < 0.001.
Figure 6
Figure 6
Analysis of immune infiltration. (A) Seven algorithms assess differences in immune infiltration status between different risk groups. (B) The correlations in Stromal Score, Immune Score, ESTIMATE Score, and tumor purity calculated using the ESTIMATE algorithm between the two risk subgroups. (C-F) The violin plot demonstrated the difference in Stromal Score, Immune Score, ESTIMATE Score, and tumor purity calculated using the ESTIMATE algorithm between the two risk subgroups.
Figure 7
Figure 7
Immune checkpoint and TCIA analysis. (A) A box plot showed that differences in immune checkpoint gene expression between high- and low-risk groups. (B) Correlation between model genes and immune checkpoint. (C-F) The low-risk group has significantly greater IPS, IPS-CTLA4-neg-PD-1-neg, IPS-CTLA4-pos-PD-1-neg, IPS-CTLA4-neg-PD-1-pos, and IPS-CTLA4-pos-PD-1-pos. *P < 0.05, **P < 0.01, ***P < 0.001.
Figure 8
Figure 8
Landscape of LUAD sample mutation profiles. (A) Mutation landscape of the top 20 genes with mutation frequency in differential risk subgroups. (B) Comparison of tumor mutation burden (TMB) between different risk groups. (C) Correlation analysis between risk score and TMB. (D) Survival differences for four different subgroups (H-TMB+high-risk, H-TMB+low-risk, L-TMB+high-risk, and L-TMB+low-risk).
Figure 9
Figure 9
Enrichment analysis. (A, B) The ssGSEA algorithm was employed to quantify the immune cell infiltration and immune function between the high-risk and low-risk groups. *P < 0.05, **P < 0.01, ***P < 0.001; ns, not significant, p value > 0.05. (C) A bar plot showed GO enrichment analysis. (D) GSEA showed pathway differences between high- and low-risk groups.
Figure 10
Figure 10
Cell experiment. (A) Survival analysis showed the effect of LGALS3 expression on prognosis. (B) The difference in LGALS3 expression between normal samples and tumor samples was found in the TCGA database. (C) Relative expression of LGALS3 in tumor and paracancerous tissues in LUAD and LGALS3 was highly expressed in tumor tissues compared with adjacent tissues (D) qRT-PCR to evaluate the level of LGALS3 expression 5 days after transfection and siRNA sequences could result in a significant decrease in LGALS3 expression (P < 0.001). (E, F) CCK8 assay showed that, after LGALS3 knockdown, the cells showed a significant reduction in viability. (G) EdU staining assay indicated that downregulation of LGALS3 expression repressed cell proliferation in LUAD cell lines. *P < 0.05, ***P < 0.001.
Figure 11
Figure 11
Xenograft tumor in Nude Mice. (A) Colony formation assay displayed that cell with reduced LGALS3 expression exhibited a significant reduction in the numbers of colonies, compared with the NC group. (B) Scratch-wound healing assay depicted that a significantly slower wound healing rate was observed in cells with a decreased expression of LGALS3. (C) Transwell assay showed that downregulation of LGALS3 expression inhibited the migration and invasion capacity of LUAD cells. (D) Nude mice experiments. LGALS3 knockdown inhibited tumor growth, and tumor volume and weight were smaller than those in the control group. To demonstrate the accuracy and reproducibility of the results, all experiments were repeated in two LUAD (A549, H1299) cell lines and all data were presented as the means ± SD of three independent experiments. *P < 0.05, **P < 0.01, ***P < 0.001.

References

    1. Siegel RL, Miller KD, Fuchs HE, Jemal A. Cancer statistics, 2022. CA Cancer J Clin (2022) 72(1):7–33. doi: 10.3322/caac.21708 - DOI - PubMed
    1. Gridelli C, Rossi A, Carbone DP, Guarize J, Karachaliou N, Mok T, et al. Non-Small-Cell lung cancer. Nat Rev Dis Primers (2015) 1:15009. doi: 10.1038/nrdp.2015.9 - DOI - PubMed
    1. Postmus PE, Kerr KM, Oudkerk M, Senan S, Waller DA, Vansteenkiste J, et al. Early and locally advanced non-Small-Cell lung cancer (Nsclc): esmo clinical practice guidelines for diagnosis, treatment and follow-up. Ann Oncol (2017) 28(suppl_4):iv1–iv21. doi: 10.1093/annonc/mdx222 - DOI - PubMed
    1. DeBerardinis RJ, Cheng T. Q's next: the diverse functions of glutamine in metabolism, cell biology and cancer. Oncogene (2010) 29(3):313–24. doi: 10.1038/onc.2009.358 - DOI - PMC - PubMed
    1. Liu L, Zhou X, Zhang J, Wang G, He J, Chen Y, et al. Lncrna hulc promotes non-small cell lung cancer cell proliferation and inhibits the apoptosis by up-regulating sphingosine kinase 1 (Sphk1) and its downstream Pi3k/Akt pathway. Eur Rev Med Pharmacol Sci (2018) 22(24):8722–30. doi: 10.26355/eurrev_201812_16637 - DOI - PubMed

Publication types