. 2023 May 15:11:1100938.
doi: 10.3389/fcell.2023.1100938. eCollection 2023.

Actin cytoskeleton depolymerization increases matrix metalloproteinase gene expression in breast cancer cells by promoting translocation of cysteine-rich protein 2 to the nucleus

Affiliations

Actin cytoskeleton depolymerization increases matrix metalloproteinase gene expression in breast cancer cells by promoting translocation of cysteine-rich protein 2 to the nucleus

Takouhie Mgrditchian et al. Front Cell Dev Biol. .

Abstract

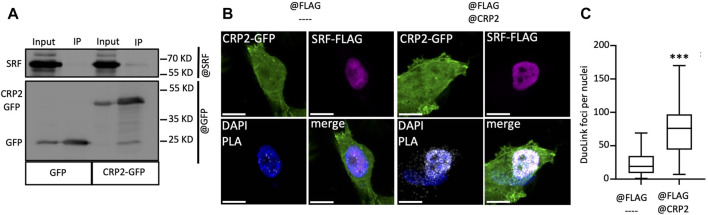
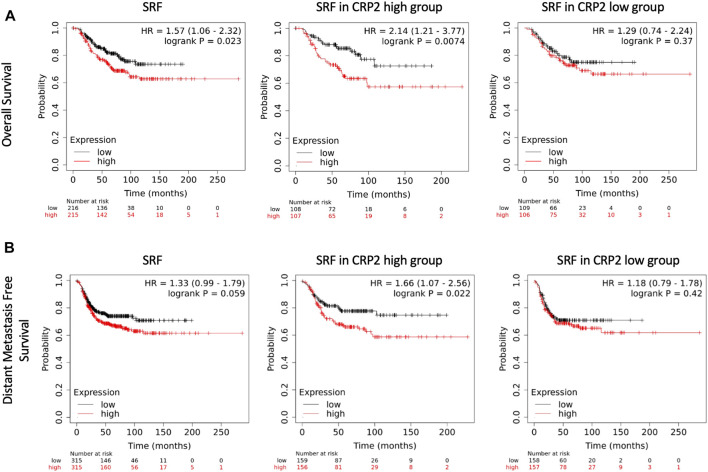
The actin cytoskeleton plays a critical role in cancer cell invasion and metastasis; however, the coordination of its multiple functions remains unclear. Actin dynamics in the cytoplasm control the formation of invadopodia, which are membrane protrusions that facilitate cancer cell invasion by focusing the secretion of extracellular matrix-degrading enzymes, including matrix metalloproteinases (MMPs). In this study, we investigated the nuclear role of cysteine-rich protein 2 (CRP2), a two LIM domain-containing F-actin-binding protein that we previously identified as a cytoskeletal component of invadopodia, in breast cancer cells. We found that F-actin depolymerization stimulates the translocation of CRP2 into the nucleus, resulting in an increase in the transcript levels of pro-invasive and pro-metastatic genes, including several members of the MMP gene family. We demonstrate that in the nucleus, CRP2 interacts with the transcription factor serum response factor (SRF), which is crucial for the expression of MMP-9 and MMP-13. Our data suggest that CRP2 and SRF cooperate to modulate of MMP expression levels. Furthermore, Kaplan-Meier analysis revealed a significant association between high-level expression of SRF and shorter overall survival and distant metastasis-free survival in breast cancer patients with a high CRP2 expression profile. Our findings suggest a model in which CRP2 mediates the coordination of cytoplasmic and nuclear processes driven by actin dynamics, ultimately resulting in the induction of invasive and metastatic behavior in breast cancer cells.

Keywords: Actin cytoskeleton; breast cancer; cysteine-rich protein 2 (CRP2); gene transcription; matrix metalloproteinases (MMPs); metastasis; serum response factor (SRF).


Conflict of interest statement

The authors declare that the research was conducted in the absence of any commercial or financial relationships that could be construed as a potential conflict of interest.

Figures

FIGURE 1
FIGURE 1
CRP2 localizes to both the cytoplasmic and the nuclear compartments and regulates gene expression in MDA-MB-231 breast cancer cells. (A) Subcellular distribution of endogenous CRP2 in MDA-MB-231 breast cancer cells as visualized by immunofluorescence staining and confocal microscopy. Ventral and nuclear optical sections are shown (upper and lower panels, respectively). F-actin and nucleus are labeled using fluorescent phalloidin (red) and DAPI (blue). Bars = 20 µm. (B) Total (T), nuclear (N) and cytoplasmic (C) distribution of endogenous CRP2 in MDA-MB-231 breast cancer cells as evaluated by subcellular fractionation and western blot analysis. Histone3 (H3) and a-Tubulin are used as nuclear and cytoplasmic markers, respectively. (C) Subcellular localization of CRP2-GFP, CRP2 C-terminal domain-GFP, CRP2 N-terminal domain-GFP in transfected MDA-MB-231 cells. Bars = 20 µm. (D) Western blot analysis showing CRP2 levels in control siRNA- and CRP2-targeting siRNA-transfected MDA-MB-231 cells subjected to RNAseq analysis. (E) Principal component analysis (PCA) plots for RNAseq data (three biological replicates were used for control and CRP2-depeleted cells). (F) Scatterplot of differentially expressed genes between control and CRP2-depeleted cells (G) Deregulated gene sets associated with breast cancer progression identified by gene set enrichment analysis. (H) K-means clustering of various matrix metalloproteases. The microscopy images presented are representative of the entire cell population. The experiments were performed in triplicate to ensure the reproducibility of the results.
FIGURE 2
FIGURE 2
CRP2 upregulates MMP transcript levels in invasive breast cancer cell lines. (A–D) MDA-MB-231 and MDA-MB-468 cells were transfected with non-targeting control siRNAs or two different CRP2-targeting siRNAs (siCRP2#a and #b). The blots on the left show CRP2 protein levels (western blot) in MDA-MB-231 (A) and MDA-MB-468 cells (C) 68 h after transfection. The charts on the right show the transcript level for several MMP genes in MDA-MB-231 (B) and MDA-MB-468 cells (D) as evaluated by real-time RT-qPCR. (E) Western blot showing CRP2 protein levels in MDA-MB-231 cell-derived cell lines stably expressing a control non-targeting shRNA (shCTR) and CRP2-targeting shRNA (shCRP2), and in a “rescue” cell line (shCRP2+CRP2*) overexpressing a HA-fused, shRNA-resistant CRP2, variant (CRP2*). (F,G) MMP-9 (F) and MMP-13 (G) transcript levels in the shCTR, shCRP2 and shCRP2+CRP2* MDA-MB-321 cell lines as evaluated by real-time RT-qPCR. Results are expressed as the average ±SEM of at least three independent experiments (open circles); * denotes a p-value less than 0.05, ** a p-value less than 0.01, *** a p-value less than 0.001 (two-tailed Student’s t test).
FIGURE 3
FIGURE 3
Actin depolymerization increases MMP-9 and MMP-13 transcript levels by promoting CRP2 nuclear translocation. (A) Effects of control (DMSO) and cytochalasin-D (CD) treatment on F-actin-based structures and nuclear abundance of endogenous CRP2 in MDA-MB-231 cells as visualized by phalloidin staining (red) and immunofluorescence staining (green), respectively. Nuclei are labeled with DAPI (blue). The microscopy images presented are representative of the entire cell population. (B) Effects of control (DMSO) and cytochalasin-D (CD) treatment on endogenous CRP2 subcellular distribution in MDA-MB-231 cells as evaluated by subcellular fractionation and western blot analysis. Histone3 (H3) and a-Tubulin are used as nuclear and cytoplasmic markers, respectively. (C) CRP2 nuclear/cytoplasmic ratio quantified from four independent western blot analyses, similar to the one shown in (B). (D,E) MMP-9 (D) and MMP-13 (E) transcript levels in control and CD-treated cells. (F,G) MMP-9 (F) and MMP-13 (G) transcript levels in control and CD-treated cells combined with non-targeting control siRNA or CRP2-targeting siRNA treatment. Results are expressed as the average ±SEM of at least three independent experiments (open circles); * denotes a p-value less than 0.05, ** a p-value less than 0.01, *** a p-value less than 0.001 (two-tailed Student’s t test).
FIGURE 4
FIGURE 4
CRP2 interacts with the transcription factor SRF in breast cancer cells. (A) Protein extracts of GFP and CRP2-GFP expressing MDA-MB-231 cells were subjected to immunoprecipitation using anti-GFP-nanobodies covalently bound to magnetic agarose beads (GFP-Trap®). Input and bound fractions (IP) were probed for SRF and GFP. (B) PLA images where the PLA signal (white foci) indicates close proximity between CRP2-GFP (green) and SRF-FLAG (purple) in MDA-MB-231 cells (right panels). Unspecific PLA signal was evaluated by omitting anti-CRP2 antibodies (left panels). Nuclei were counterstained with DAPI (blue). Bars = 10 µm. (C) Quantitative analysis of Duolink® PLA foci in the nuclei of MDA-MB-231 cells. The center lines of the box-and-whisker diagram denotes the median value (50th percentile), while the upper and lower boxes represent the first and third quartiles, respectively. The whiskers extend to the minimum and maximum values of the data set. Data originate from 4 independent experiments, including at least 77 randomly selected cells. *** a p-value less than 0.001 (two-tailed Student’s t test). The microscopy images presented are representative of the entire cell population.
FIGURE 5
FIGURE 5
MMP-9 and MMP-13 transcript levels are regulated by SRF. (A) Schematic representation of MMP-9 and MMP-13 proximal promoter regions. Regulatory promoter elements including TATA-box, INR and DPE, as well as position (relative to the transcription start site, TSS) and sequence of predicted binding sites for SRF are indicated. Further information is provided in Supplementary Table S3. (B–D) Effects of SRF knockdown, as verified by western blot analysis (B), on MMP-9 and MMP-13 transcript levels in MDA-MB-231 cells (C and D, respectively). Results are expressed as the average ±SEM of at least three independent experiments (open circles); ** a p-value less than 0.01, *** a p-value less than 0.001 (two-tailed Student’s t test).
FIGURE 6
FIGURE 6
Interdepence of SRF and CRP2 in regualting MMP-9 and MMP-13 transcript levels. (A) Western blot analysis of SRF and CRP2 (or HA-CRP2) protein levels in MDA-MB-231 cell-derived shCRP2 and shCRP2+CRP2* cell lines, 48 h following their transfection with non-targeting or SRF-targeting siRNAs (siCTR and siSRF, respectively). (B,C) MMP-9 (B) and MMP-13 (C) transcript levels in cells described in (A) as evaluated by real-time RT-qPCR. Results are expressed as the average ±SEM of at least three independent experiments (open circles); ns non significant, * denotes a p-value less than 0.05, ** a p-value less than 0.01, *** a p-value less than 0.001 (two-tailed Student’s t test).
FIGURE 7
FIGURE 7
Kaplan-Meier survival analyses in relation to SRF expression in basal-like breast carcinoma. The upper (A) and lower (B) panels show overall and distant metastasis free survival, respectively. Left panels denote survival in the total population of basal-like breast cancer patients (PAM50), while middle and right panels denote survival in basal-like breast cancer patients with high and low CRP2 expression profile, i.e., above and below median, respectively. The patient samples, hazard ratio with 95% confidence interval, and p-value (Logrank test) are displayed on each chart.
FIGURE 8
FIGURE 8
Model for the dual cytoplasmic and nuclear roles of CRP2 in breast cancer invasion and metastasis. In breast cancer cells, CRP2 exhibits dual cytoplasmic and nuclear localization. In the cytoplasm, CRP2 binds to and crosslinks actin filaments, and contributes to forming and maintaining pro-invasive actin-rich structures, such as invadopodia (Hoffmann et al., 2016; Hoffmann et al., 2018). In the nucleus, CRP2 associates with SRF and upregulates the expression of pro-invasive genes, including several MMPs known for their ability to degrade the extracellular matrix and facilitate the early steps of invadopodia formation, such as MMP-14/MT1-MMP (Ferrari et al., 2019). The relative distribution of CRP2 in the cytoplasmic and nuclear compartments is modulated by actin dynamics. Upon actin filament depolymerization, e.g., during disassembly of aging invadopodia, free CRP2 is released and shuttles to the nucleus. The presence of a nuclear localization signal (NLS) in the N-terminal region of CRP2 may facilitate the trafficking of CRP2 to the nucleus. Although CRP2 also lacks a nuclear export signal (NES), the nuclear amount of CRP2 increases upon leptomycin B treatment, suggesting that CRP2 interacts with a partner that is regulated by exportin 1/CMR1.

References

    1. Amar S., Fields G. B. (2015). Potential clinical implications of recent matrix metalloproteinase inhibitor design strategies. Expert Rev. Proteomics 12 (5), 445–447. 10.1586/14789450.2015.1069190 - DOI - PMC - PubMed
    1. Arber S., Caroni P. (1996). Specificity of single LIM motifs in targeting and LIM/LIM interactions in situ . Genes Dev. 10 (3), 289–300. 10.1101/gad.10.3.289 - DOI - PubMed
    1. Azam H., Pierro L., Reina M., Gallagher W. M., Prencipe M. (2022). Emerging role for the Serum Response Factor (SRF) as a potential therapeutic target in cancer. Expert Opin. Ther. Targets 26 (2), 155–169. 10.1080/14728222.2022.2032652 - DOI - PubMed
    1. Bailey T. L., Johnson J., Grant C. E., Noble W. S. (2015). The MEME suite. Nucleic Acids Res. 43 (W1), W39–W49. 10.1093/nar/gkv416 - DOI - PMC - PubMed
    1. Castro-Mondragon J. A., Riudavets-Puig R., Rauluseviciute I., Lemma R. B., Turchi L., Blanc-Mathieu R., et al. (2022). Jaspar 2022: The 9th release of the open-access database of transcription factor binding profiles. Nucleic Acids Res. 50 (D1), D165–D173. 10.1093/nar/gkab1113 - DOI - PMC - PubMed