. 2023 Jun 1;23(6):3.
doi: 10.1167/jov.23.6.3.

Learning spatial frequency identification through reweighted decoding

Affiliations

Learning spatial frequency identification through reweighted decoding

Barbara Dosher et al. J Vis. .

Abstract

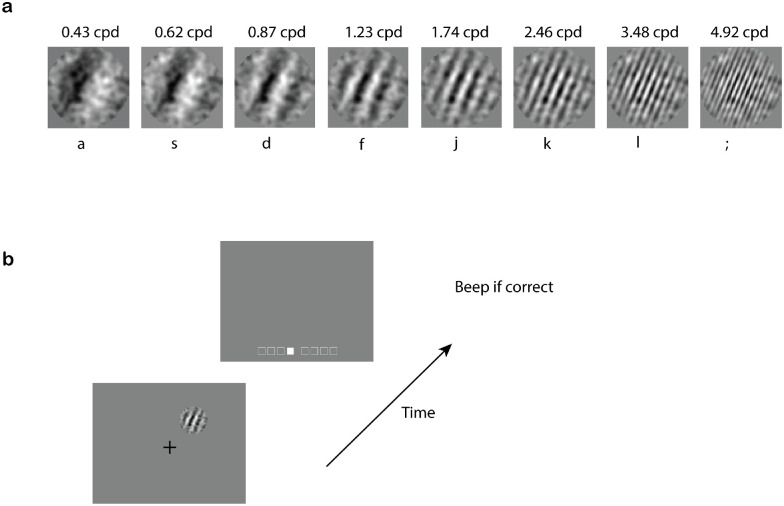
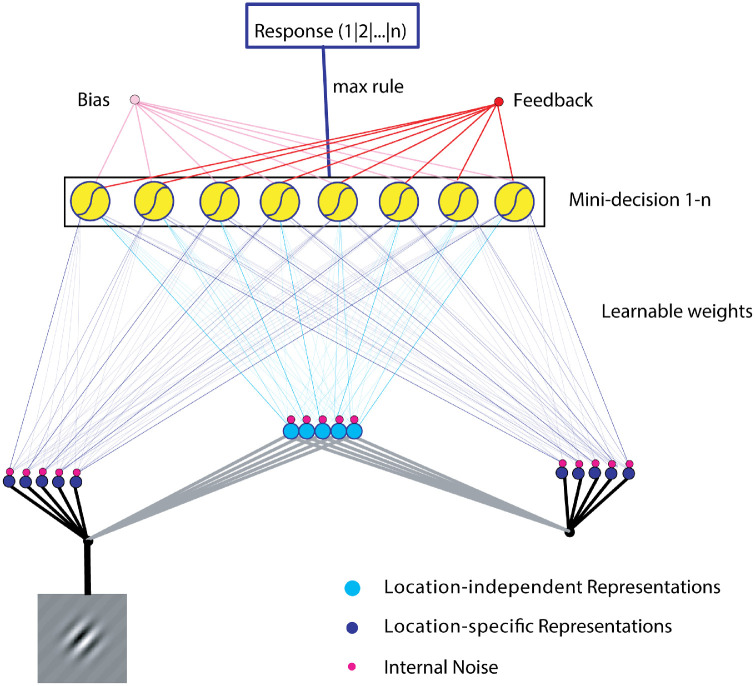
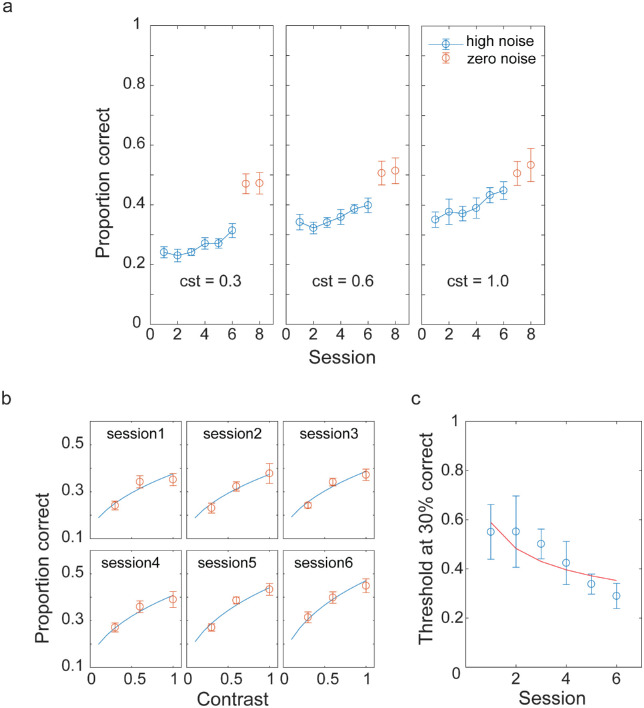
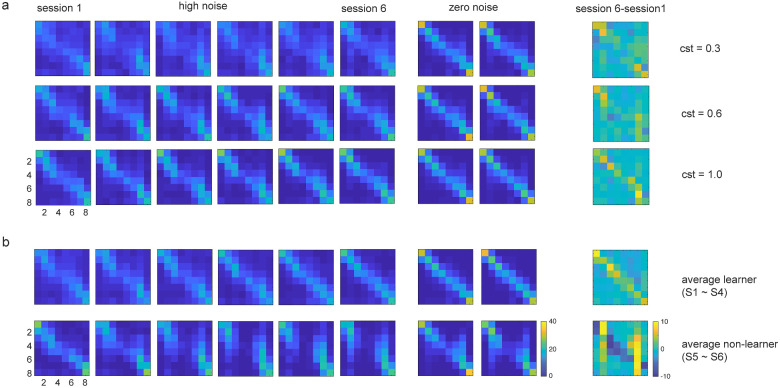
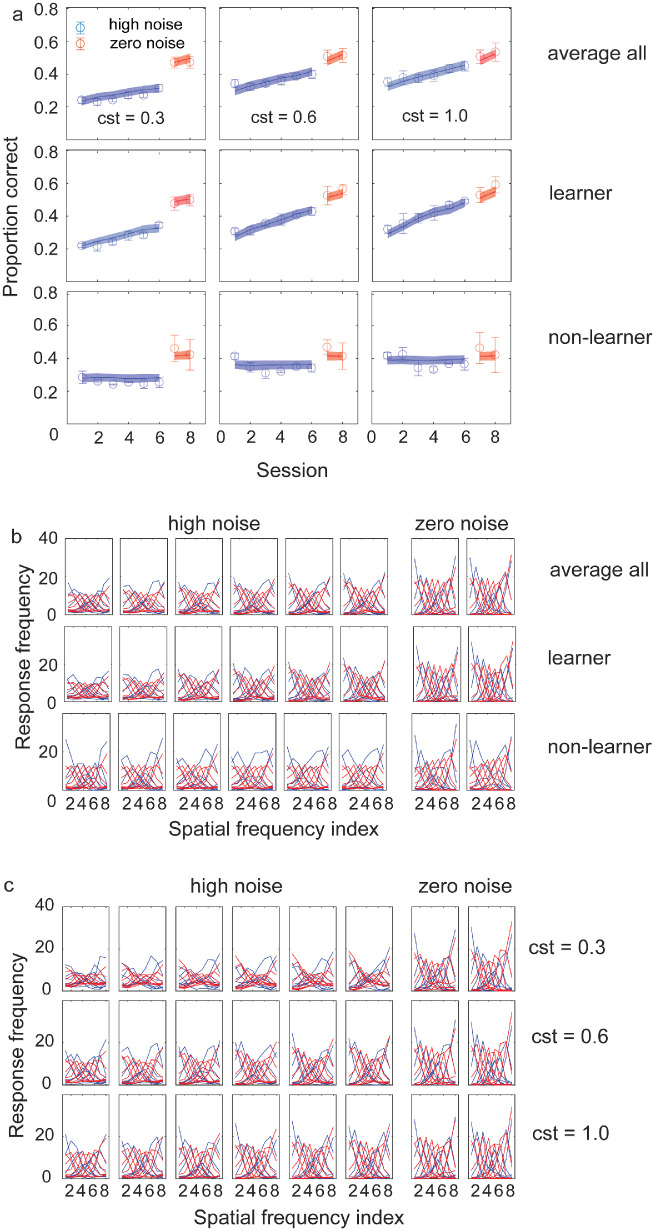
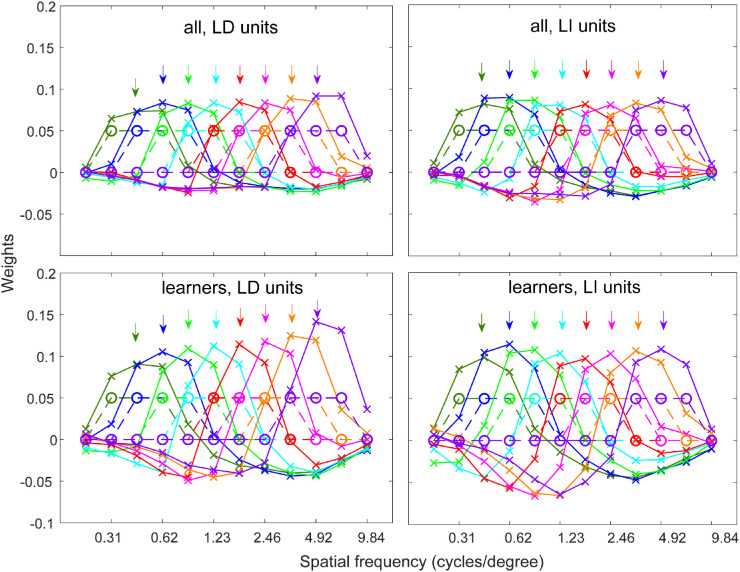
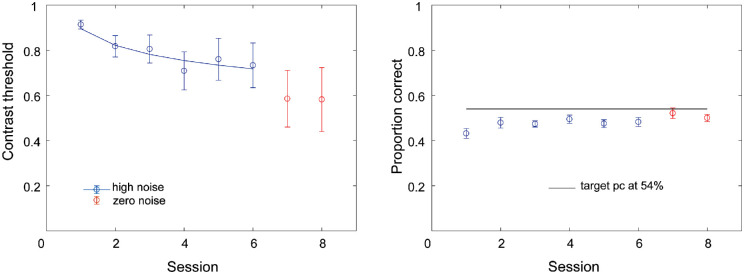
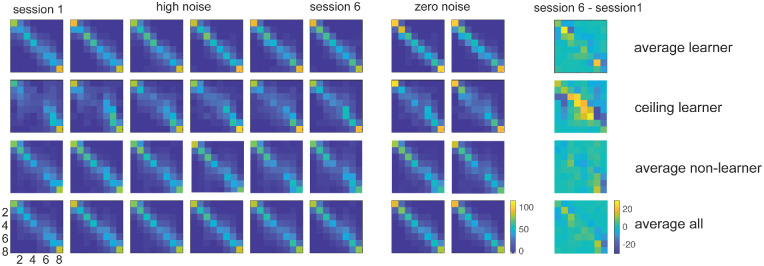
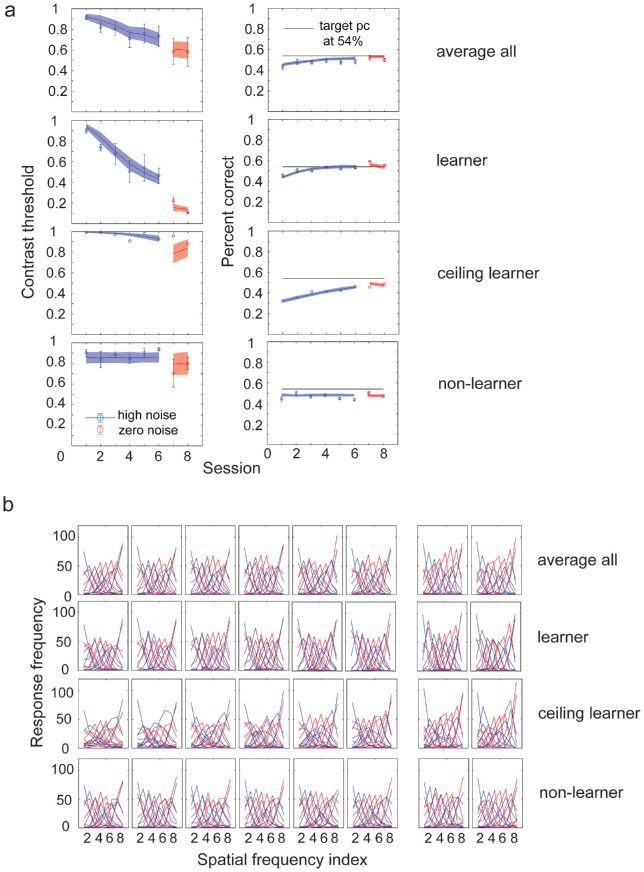
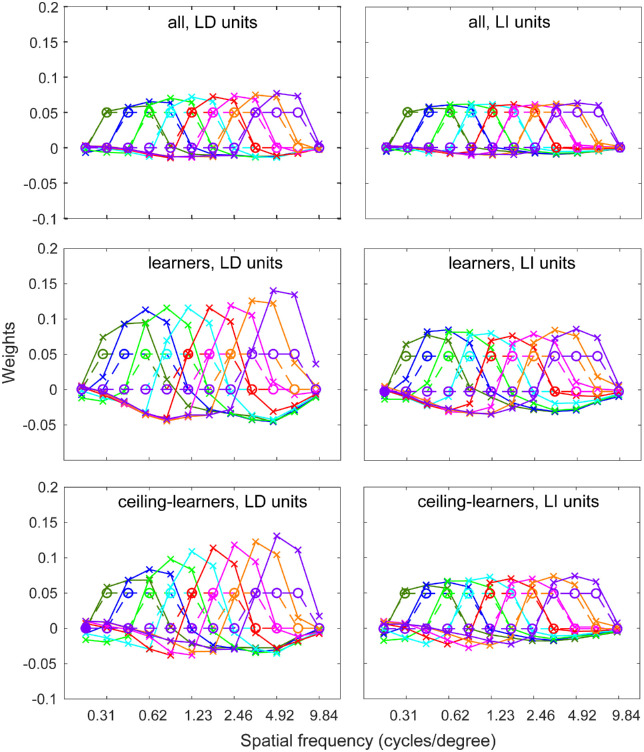
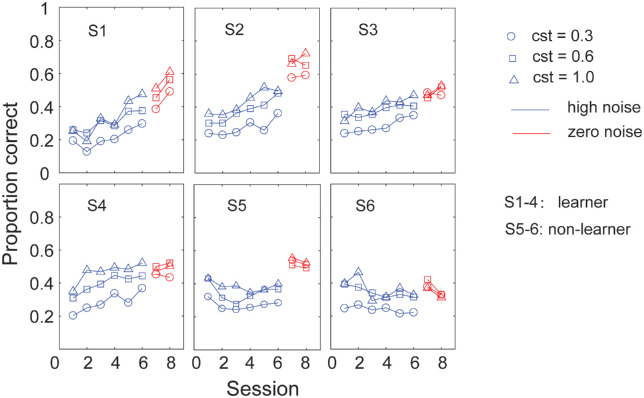
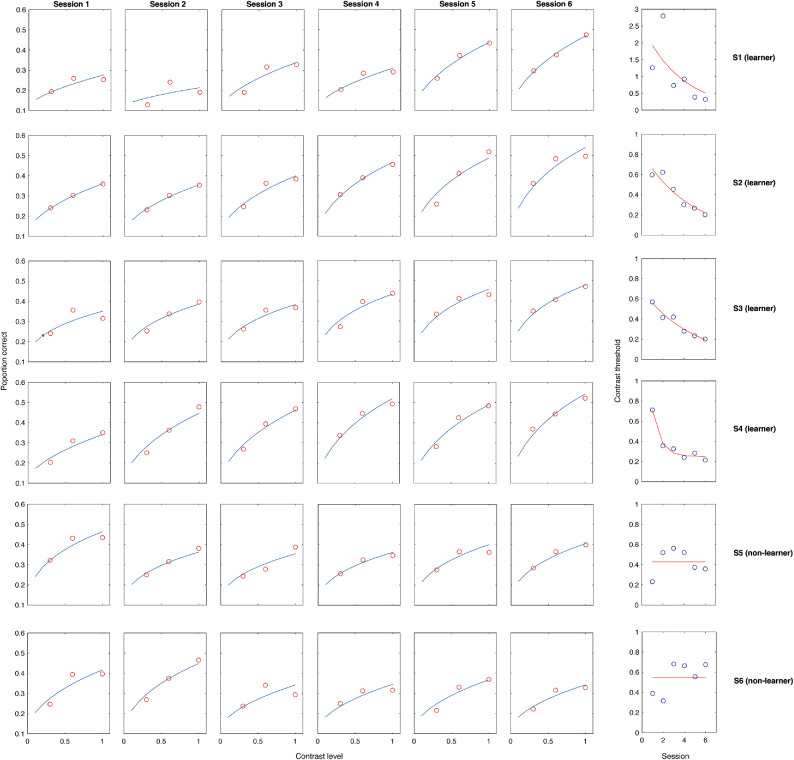
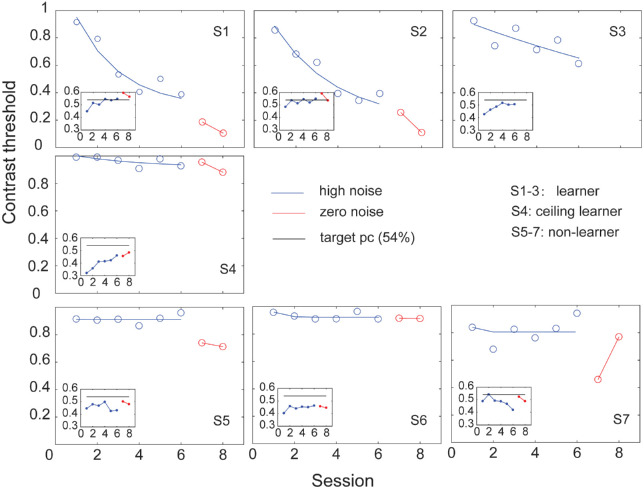
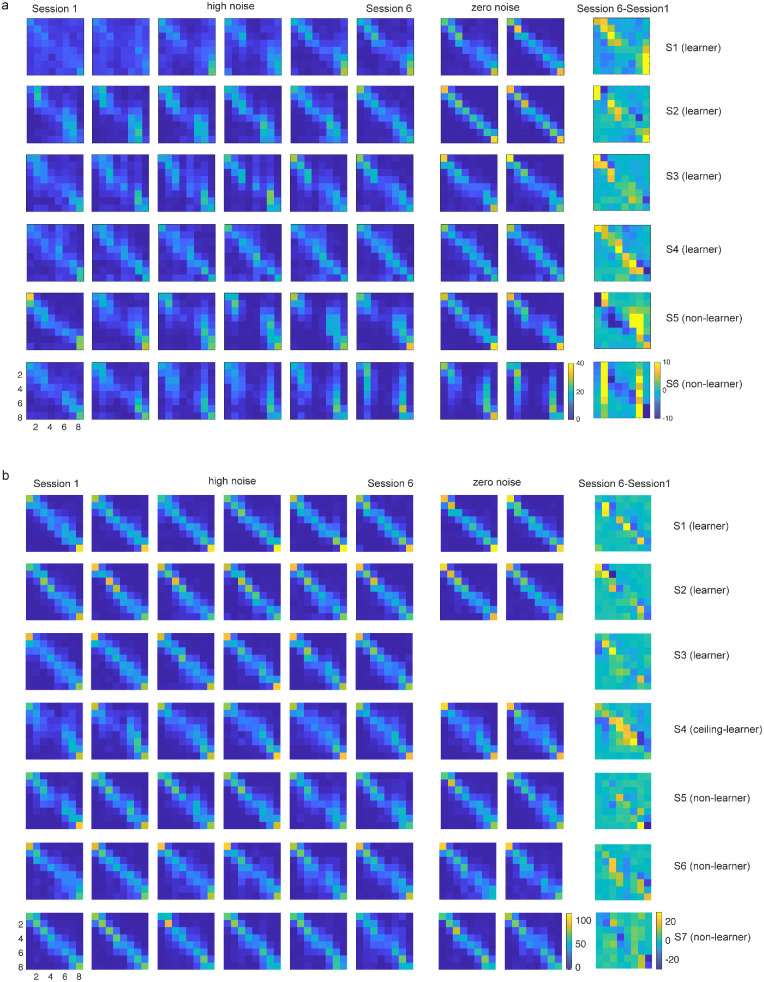
Perceptual learning, the improvement of perceptual judgments with practice, occurs in many visual tasks. There are, however, relatively fewer studies examining perceptual learning in spatial frequency judgments. In addition, perceptual learning has generally been studied in two-alternative tasks, occasionally in n-alternative tasks, and infrequently in identification. Recently, perceptual learning was found in an orientation identification task (eight-alternatives) and was well accounted for by a new identification integrated reweighting theory (I-IRT) (Liu et al., submitted). Here, we examined perceptual learning in a similar eight-alternative spatial frequency absolute identification task in two different training protocols, finding learning in the majority but not all observers. We fit the I-IRT to the spatial frequency learning data and discuss possible model explanations for variations in learning.


Figures

Figure 1.
Figure 1.
(a) The experimental stimuli – noisy Gabor images with eight possible spatial frequencies. (b) A simplified task paradigm: every trial only one stimulus was presented, and observers made a response. A visual feedback (white square) and audio feedback (beep if the response was correct) followed.
Figure 2.
Figure 2.
The I-IRT model. A stimulus is first processed into both location-specific and location-independent representations, which are fed forward to n mini-decision units. A max rule decides the actual response. Feedback (information about which response is desired) and bias (to balance response frequency for each response) are fed into the mini-decision units, which drive the learning of the model. Learning is achieved through updating weights between representations and mini-decision units.
Figure 3.
Figure 3.
Results of Experiment 1. (a) The average proportion correct in three contrast levels over eight sessions, first six sessions in high noise and last two sessions in zero noise for all observers. Observed proportion correct improved for all contrast levels over the sessions. (b) The Weibull function fit for average data in each high noise session. (c) The 30% correct threshold from the Weibull fit in b. The red line is a power function fit of the threshold data. The reduction of thresholds over sessions demonstrates learning.
Figure 4.
Figure 4.
The confusion matrices heatmap in each session, and the change in confusion matrices from session 1 to session 6. The diagonal shows the correct responses. (a) Confusion matrices averaged across all observers for each contrast level. Performance was better in higher contrast, in low noise, and in later sessions, seen as cleaner diagonal frequency data. The difference between session 6 and session 1 showed the improved performance. (b) Confusion matrices averaged across contrast levels for the average of learners (S1–S4, top), and non-learners (S5–S6, bottom). The difference between session 6 and session 1 showed clear biases in non-learners – who disproportionately responded “2” and “7” for the lower and higher spatial frequencies, respectively.
Figure 5.
Figure 5.
The I-IRT model fit to the experimental data in Experiment 1. (a) Model fit to the average of all observers (top), of learners (middle), and of non-learners (bottom). In each case the I-IRT fit the data quite well (see main text for statistics). (b) The response function of data (blue) and model predictions (red), averaged over stimulus contrasts, organically emerge from the fit of the model to the proportion correct data in a. Each line of the response function shows the frequency of responses to a given stimulus. The model captures the data in non-learners reasonably well even without introducing response biases (see main text for discussion). (c) The response function of data (blue) and model (red) for the average of all observers in three contrast levels. The model captures the data in different contrast and external noise levels well.
Figure 6.
Figure 6.
The initial (circles) and final (crosses) weights from representation units to each mini-decision unit for location-specific and location-invariant units for all observers (top panels), and for learners (bottom panels), tuned to the trained orientation. Each color represents one mini-decision unit, and arrows are eight spatial frequencies in the stimuli. Initial weights are set positively for representation units tuned for the spatial frequencies near the stimulus for each mini-decision unit and set to zero for others, corresponding with initial above-chance performance. After learning, the weights of the relevant representation units increased, whereas the weights on other units decreased. For middle spatial frequency stimuli, the pattern shows an excitatory center, inhibitory surround patter to suppress the input from response competitors; for end point stimuli, evidence from representations tuned just outside the range retain positive weights. The weight changes in fits to learners are more robust than for the average of all observers. The weights do not change from initial values in fits to non-learners data. (See text for explanation.)
Figure 7.
Figure 7.
Results for Experiment 2 (contrast threshold version). Left: Contrast thresholds decreased across sessions, showing perceptual learning. Right: Proportion correct over the sessions approximated the 54% target accuracy of the adaptive staircase, although it was somewhat below especially in the first sessions due to ceiling effects in some observers. (See Appendix B for individual observer data.)
Figure 8.
Figure 8.
Confusion matrices for Experiment 2 across sessions shown as heatmaps. Confusion matrices are expected to be roughly the same across sessions since the adaptive estimates of contrast threshold sought to hold proportion correct performance at 54%. The data show some improvement over sessions in the confusion matrices because of one near-ceiling observer (see text). (See Appendix B for individual observer data.)
Figure 9.
Figure 9.
The I-IRT model fit to the experimental data in Experiment 2. (a) Model fit to the average across all participants (top), to learners (second row), to the ceiling learner (third row) and to non-learners (bottom). In each case, the I-IRT fit the data quite well (see main text for statistics). (b) The response functions of the data (blue) and model (red) based on the fit to threshold data in a. Each line of the response function shows the frequency of responses to a given stimulus. The model captures the response function data reasonably well without adding new parameters.
Figure 10.
Figure 10.
The initial and final weights from representation units to the mini-decision units for location-specific (left) and location-invariant (right) units for the fit to all observers (top panels); for learners only (middle panels); and for the ceiling learner (bottom panels). Learning increased the weights on representations tuned to near-spatial frequencies and decreased the weights on representations tuned to other spatial frequencies, especially those for competing responses. Weights from the fits of the I-IRT simulations changed the most for the learners, slightly less for the ceiling learner, less for the average of all observers, and remained unchanged simulation for non-learners (see text).
Figure B1.
Figure B1.
Individual observer data in Experiment 1 (proportion correct version). Observers S1–S4 showed improvement, while observers S5–S6 did not.
Figure B2.
Figure B2.
Weibull-fit thresholds from each observer in Experiment 1, and the exponential fit to the threshold learning curves. Thresholds from observers S1–S4 decreased, while thresholds for observers S5–S6 did not.
Figure B3.
Figure B3.
Thresholds and proportion correct (inset) for each observer in experiment 2. Learners, (S1–S3) showed learning in the decrease of thresholds (fit with exponential curves), and accuracy performance that approached the target 54% correct. The ceiling learner (S4) continued over sessions to perform near the threshold ceiling (1.0 contrast), but their performance accuracy improved. The non-learners (S5–S7) also showed closer to ceiling thresholds with little improvement in performance accuracy. Note that while falling short of the target accuracy of the adaptive staircase, the performance nonetheless preserves significant information about the stimulus (see Figure C1 below). See the text for explanations.
Figure C1.
Figure C1.
Confusion matrices shown as heatmaps for individual observers. (a) In Experiment 1, the confusion matrices showed improvements for learners whereas non-learners developed biases. (b) In Experiment 2, consistent with the use of an adaptive staircase to target 54% correct, most confusion matrices remained similar while the ceiling learner showed most improvement.

Similar articles

Cited by

References

    1. Ahissar, M., & Hochstein, S. (1997). Task difficulty and the specificity of perceptual learning. Nature, 387(6631), 401–406. - PubMed
    1. Astle, A. T., Webb, B. S., & McGraw, P. V. (2010). Spatial frequency discrimination learning in normal and developmentally impaired human vision. Vision Research, 50(23), 2445–2454. - PMC - PubMed
    1. Bakeman, R. (2005). Recommended effect size statistics for repeated measures designs. Behavior Research Methods, 37, 379–384. - PubMed
    1. Bennett, R. G., & Westheimer, G. (1991). The effect of training on visual alignment discrimination and grating resolution. Perception & Psychophysics, 49(6), 541–546. - PubMed
    1. Braida, L. D., Lim, J. S., Berliner, J. E., Durlach, N. I., Rabinowitz, W. M., & Purks, S. R. (1984). Intensity perception: XIII. Perceptual anchor model of context-coding. Journal of the Acoustical Society of America, 76, 722–731. - PubMed