

Increasing Diversity in the Physician Workforce: Pathway Programs and Predictive Analytics
- PMID: 37267045
- PMCID: PMC10516161
- DOI: 10.1097/ACM.0000000000005287
Increasing Diversity in the Physician Workforce: Pathway Programs and Predictive Analytics
Abstract
Problem: Lack of diversity in the physician workforce has well-documented negative impacts on health outcomes. Evidence supports the use of pathway or pipeline programs to recruit underrepresented in medicine students. However, data on how a pathway program should deliver instruction are lacking. This report describes a multiyear project to build such a system with the goal of increasing diversity within medical school cohorts and ultimately the physician workforce.
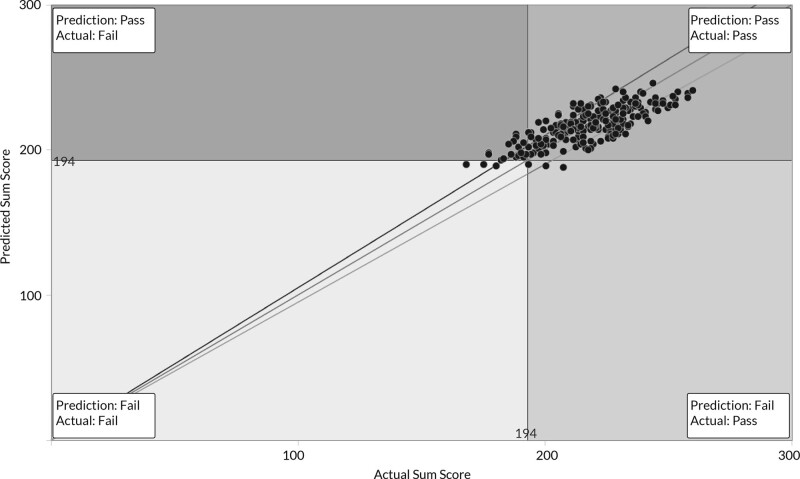
Approach: In the 2015-2016 academic year, the Ponce Health Sciences University started a 3-phase project to create a data-driven medical school feeder system by coupling a pathway program with predictive analytics. Phase 1 launched the pathway program. Phase 2 developed and validated a predictive model that estimates United States Medical Licensing Examination (USMLE) Step 1 performance. Phase 3 is underway and focuses on adoption, implementation, and support.
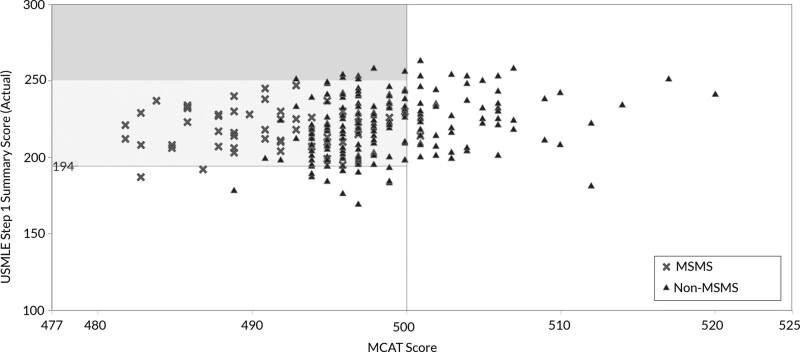
Outcomes: Data analysis compared 2 groups of students (pathway vs direct) across specific factors, including Medical College Admission Test (MCAT) score, undergraduate grade point average (GPA), first-generation status, and Step 1 exam performance. Statistically significant differences were found between the 2 groups on the MCAT exam and undergraduate GPA; however, no significant differences were found between groups for first-generation status and performance on the Step 1 exam. This finding supports the authors' hypothesis that although pathway students have significantly lower mean MCAT exam scores compared with direct students, pathway students perform just as well on the USMLE Step 1 exam.
Next steps: Next steps include expanding the project to another campus, adding more socioeconomic status and first-generation data, and identifying best curricular predictors. The authors recommend that medical school programs use pathway programs and predictive analytics to create a more data-centered approach to accepting students with the goal of increasing physician workforce diversity.
Copyright © 2023 The Author(s). Published by Wolters Kluwer Health, Inc. on behalf of the Association of American Medical Colleges.
Conflict of interest statement
Figures
References
-
- Association of American Medical Colleges. Diversity in medicine: Facts and figures 2019. https://www.aamc.org/data-reports/workforce/report/diversity-medicine-fa.... Accessed May 26, 2023.
-
- IHS Markit Ltd. The Complexities of Physician Supply and Demand: Projections From 2019 to 2034. Washington, DC: Association of American Medical Colleges; 2021.
-
- Cooper LA, Roter DL. Patient-provider communication: The effect of race and ethnicity on process and outcomes of healthcare. In: Unequal Treatment: Confronting Racial and Ethnic Disparities in Health Care. Washington, DC: National Academies Press; 2003:552–593. - PubMed
MeSH terms
LinkOut - more resources
Full Text Sources
