. 2023 Jun 27;42(6):112588.
doi: 10.1016/j.celrep.2023.112588. Epub 2023 Jun 1.

Liver and muscle circadian clocks cooperate to support glucose tolerance in mice

Affiliations

Liver and muscle circadian clocks cooperate to support glucose tolerance in mice

Jacob G Smith et al. Cell Rep. .

Abstract

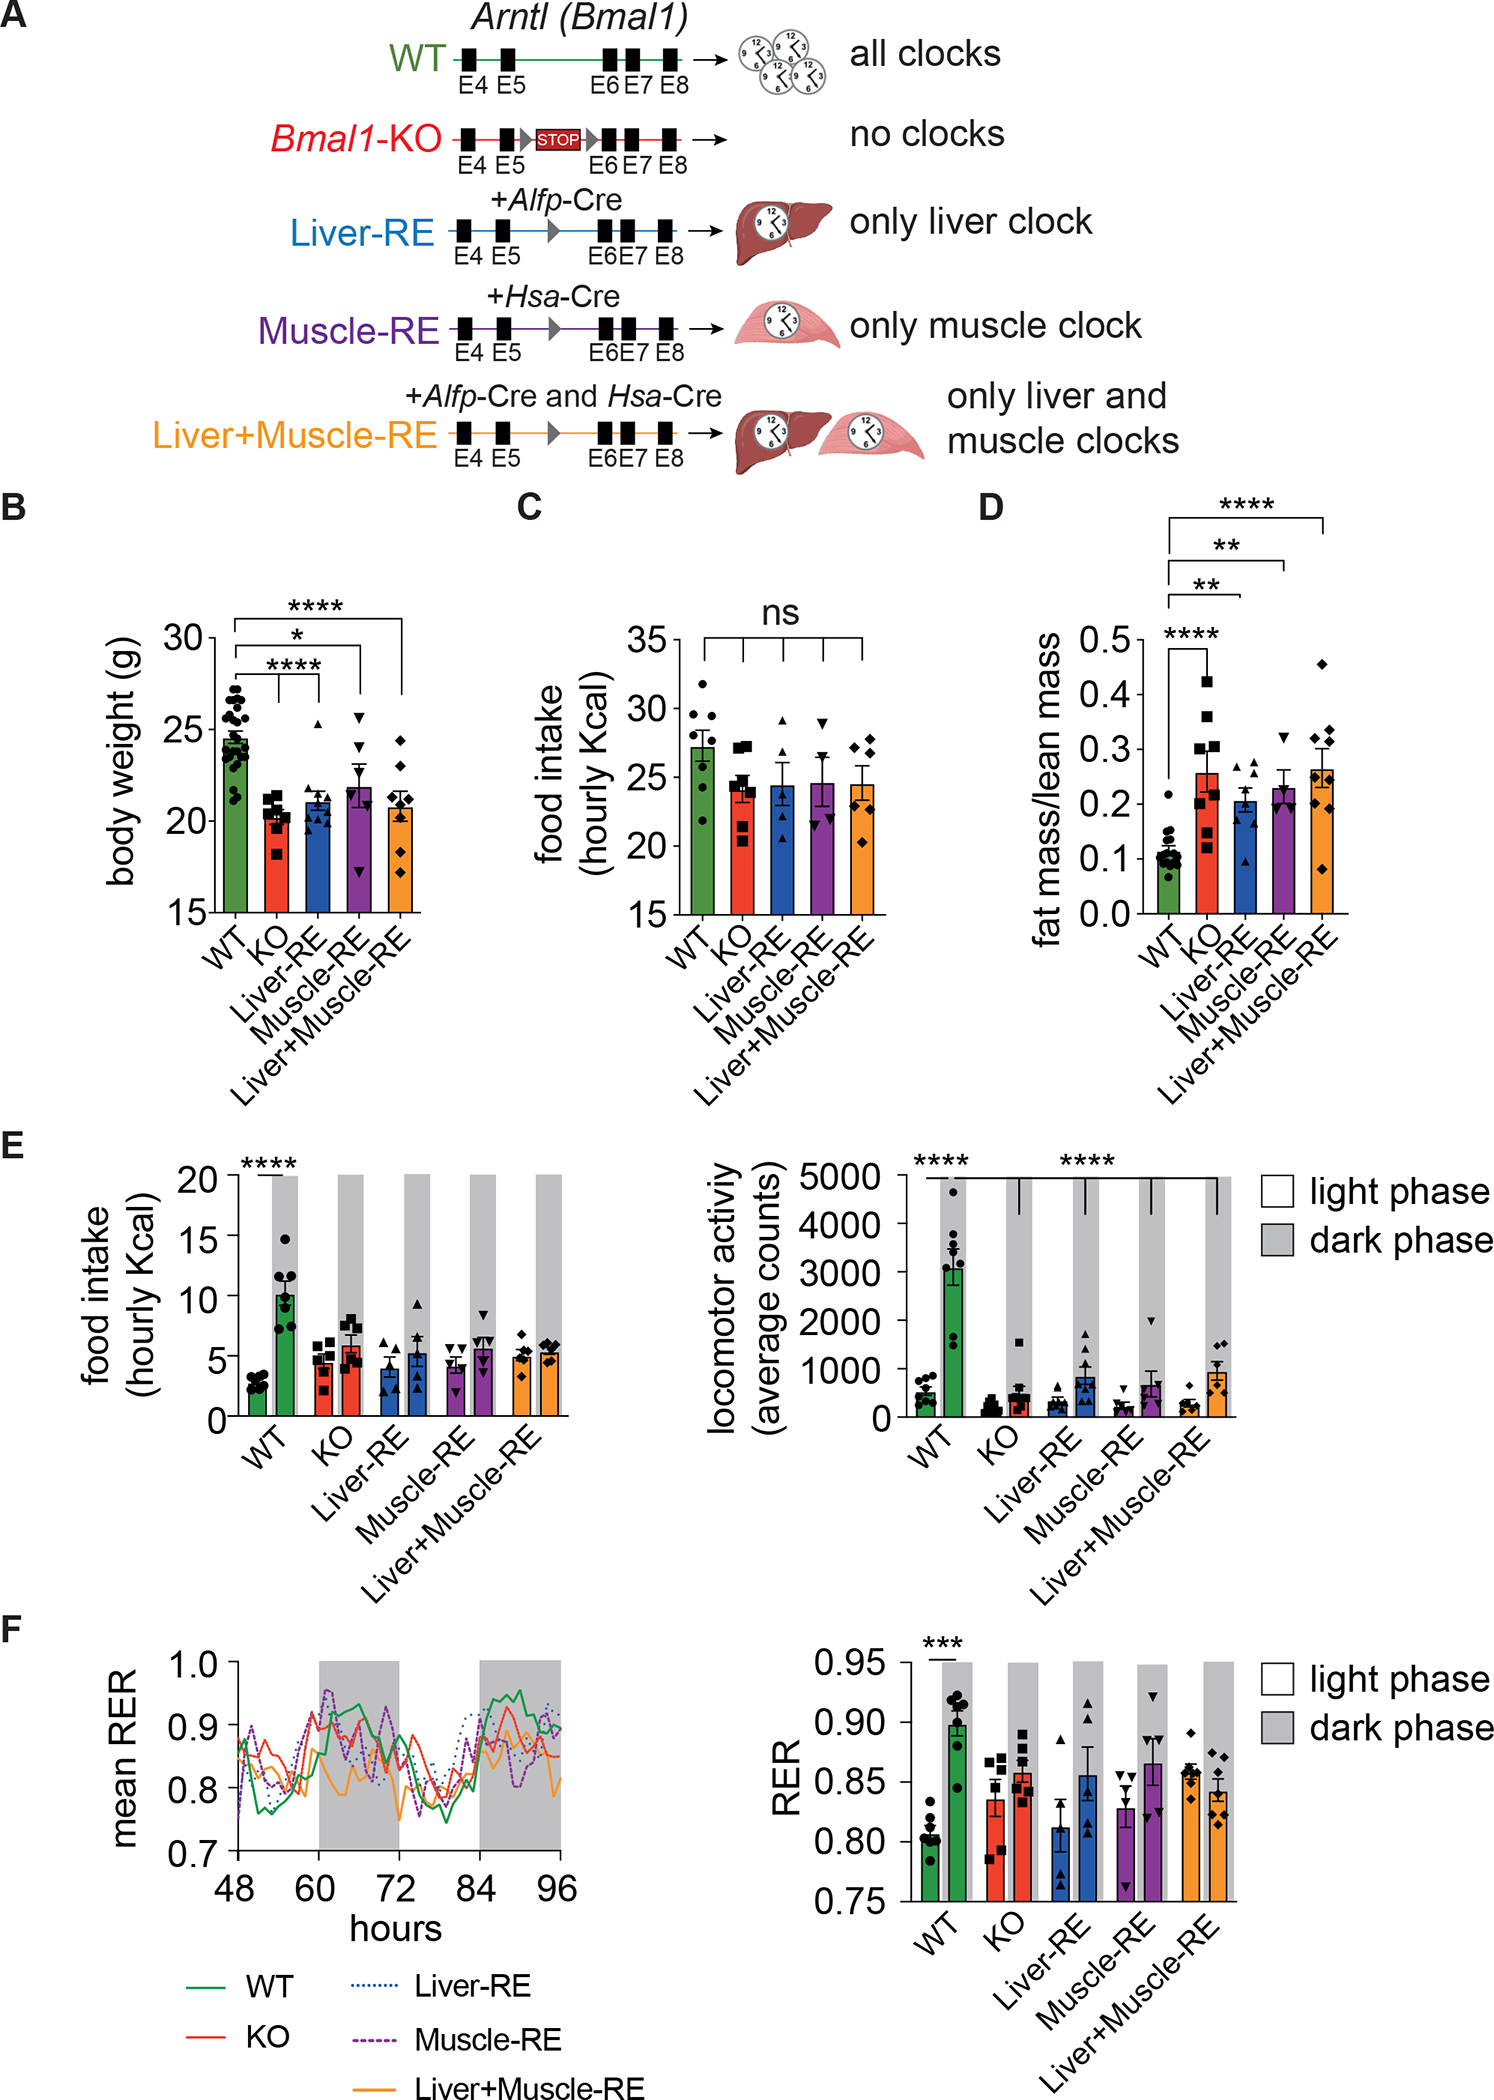
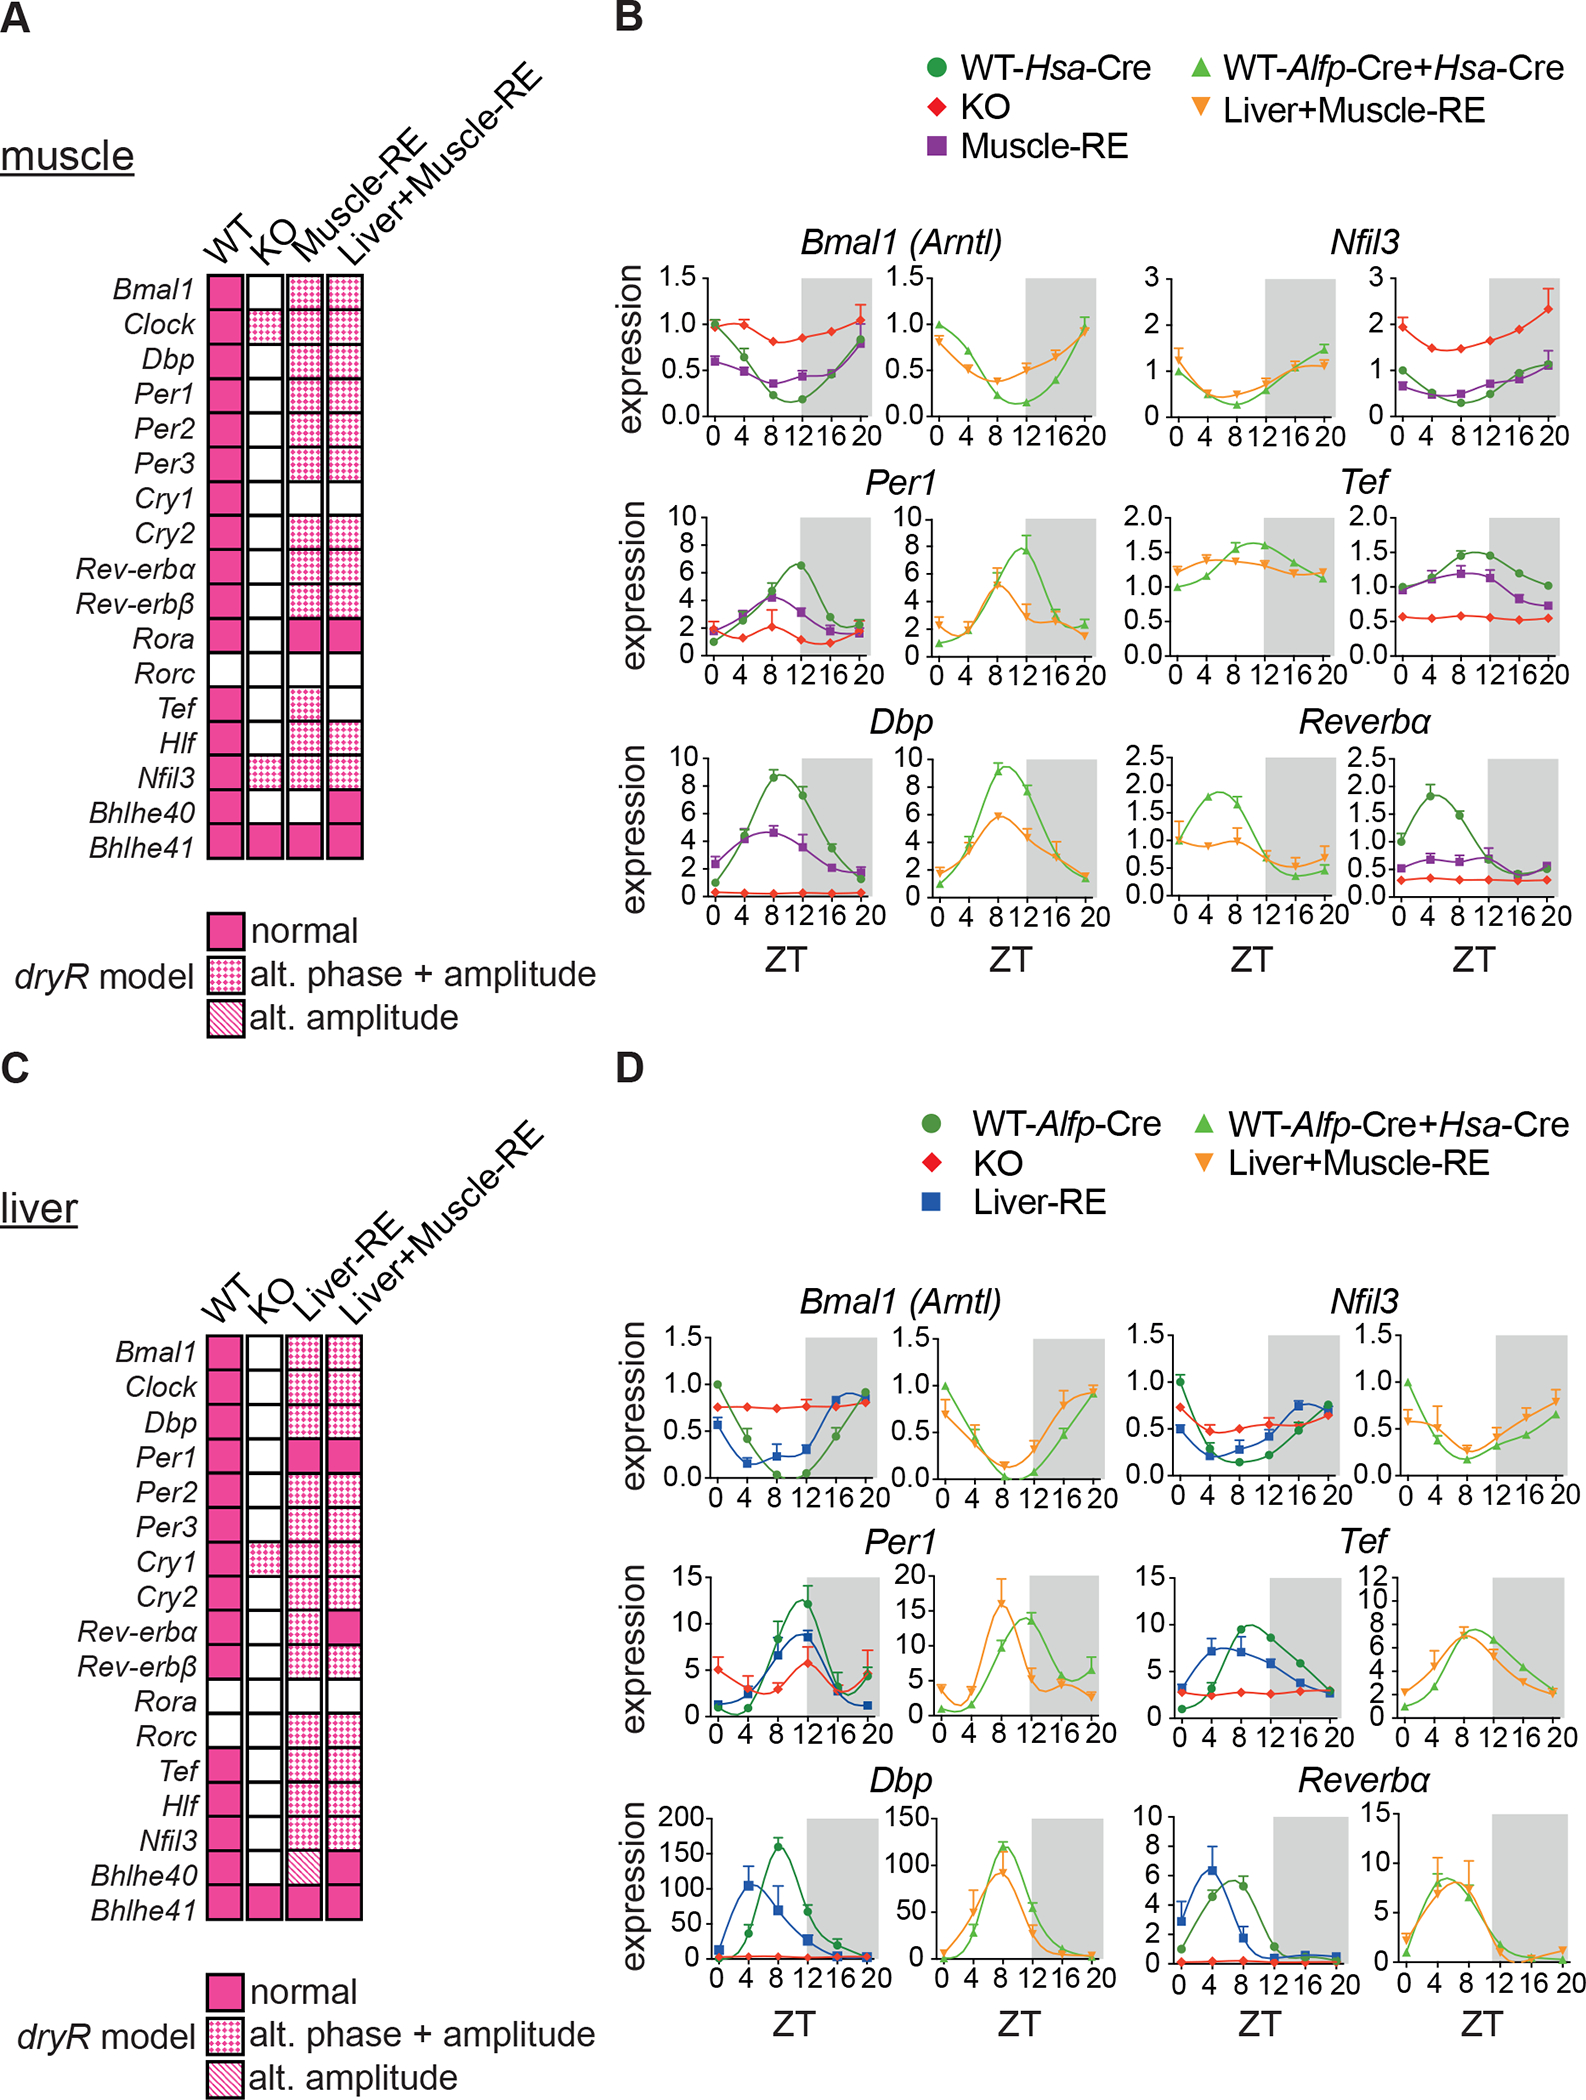
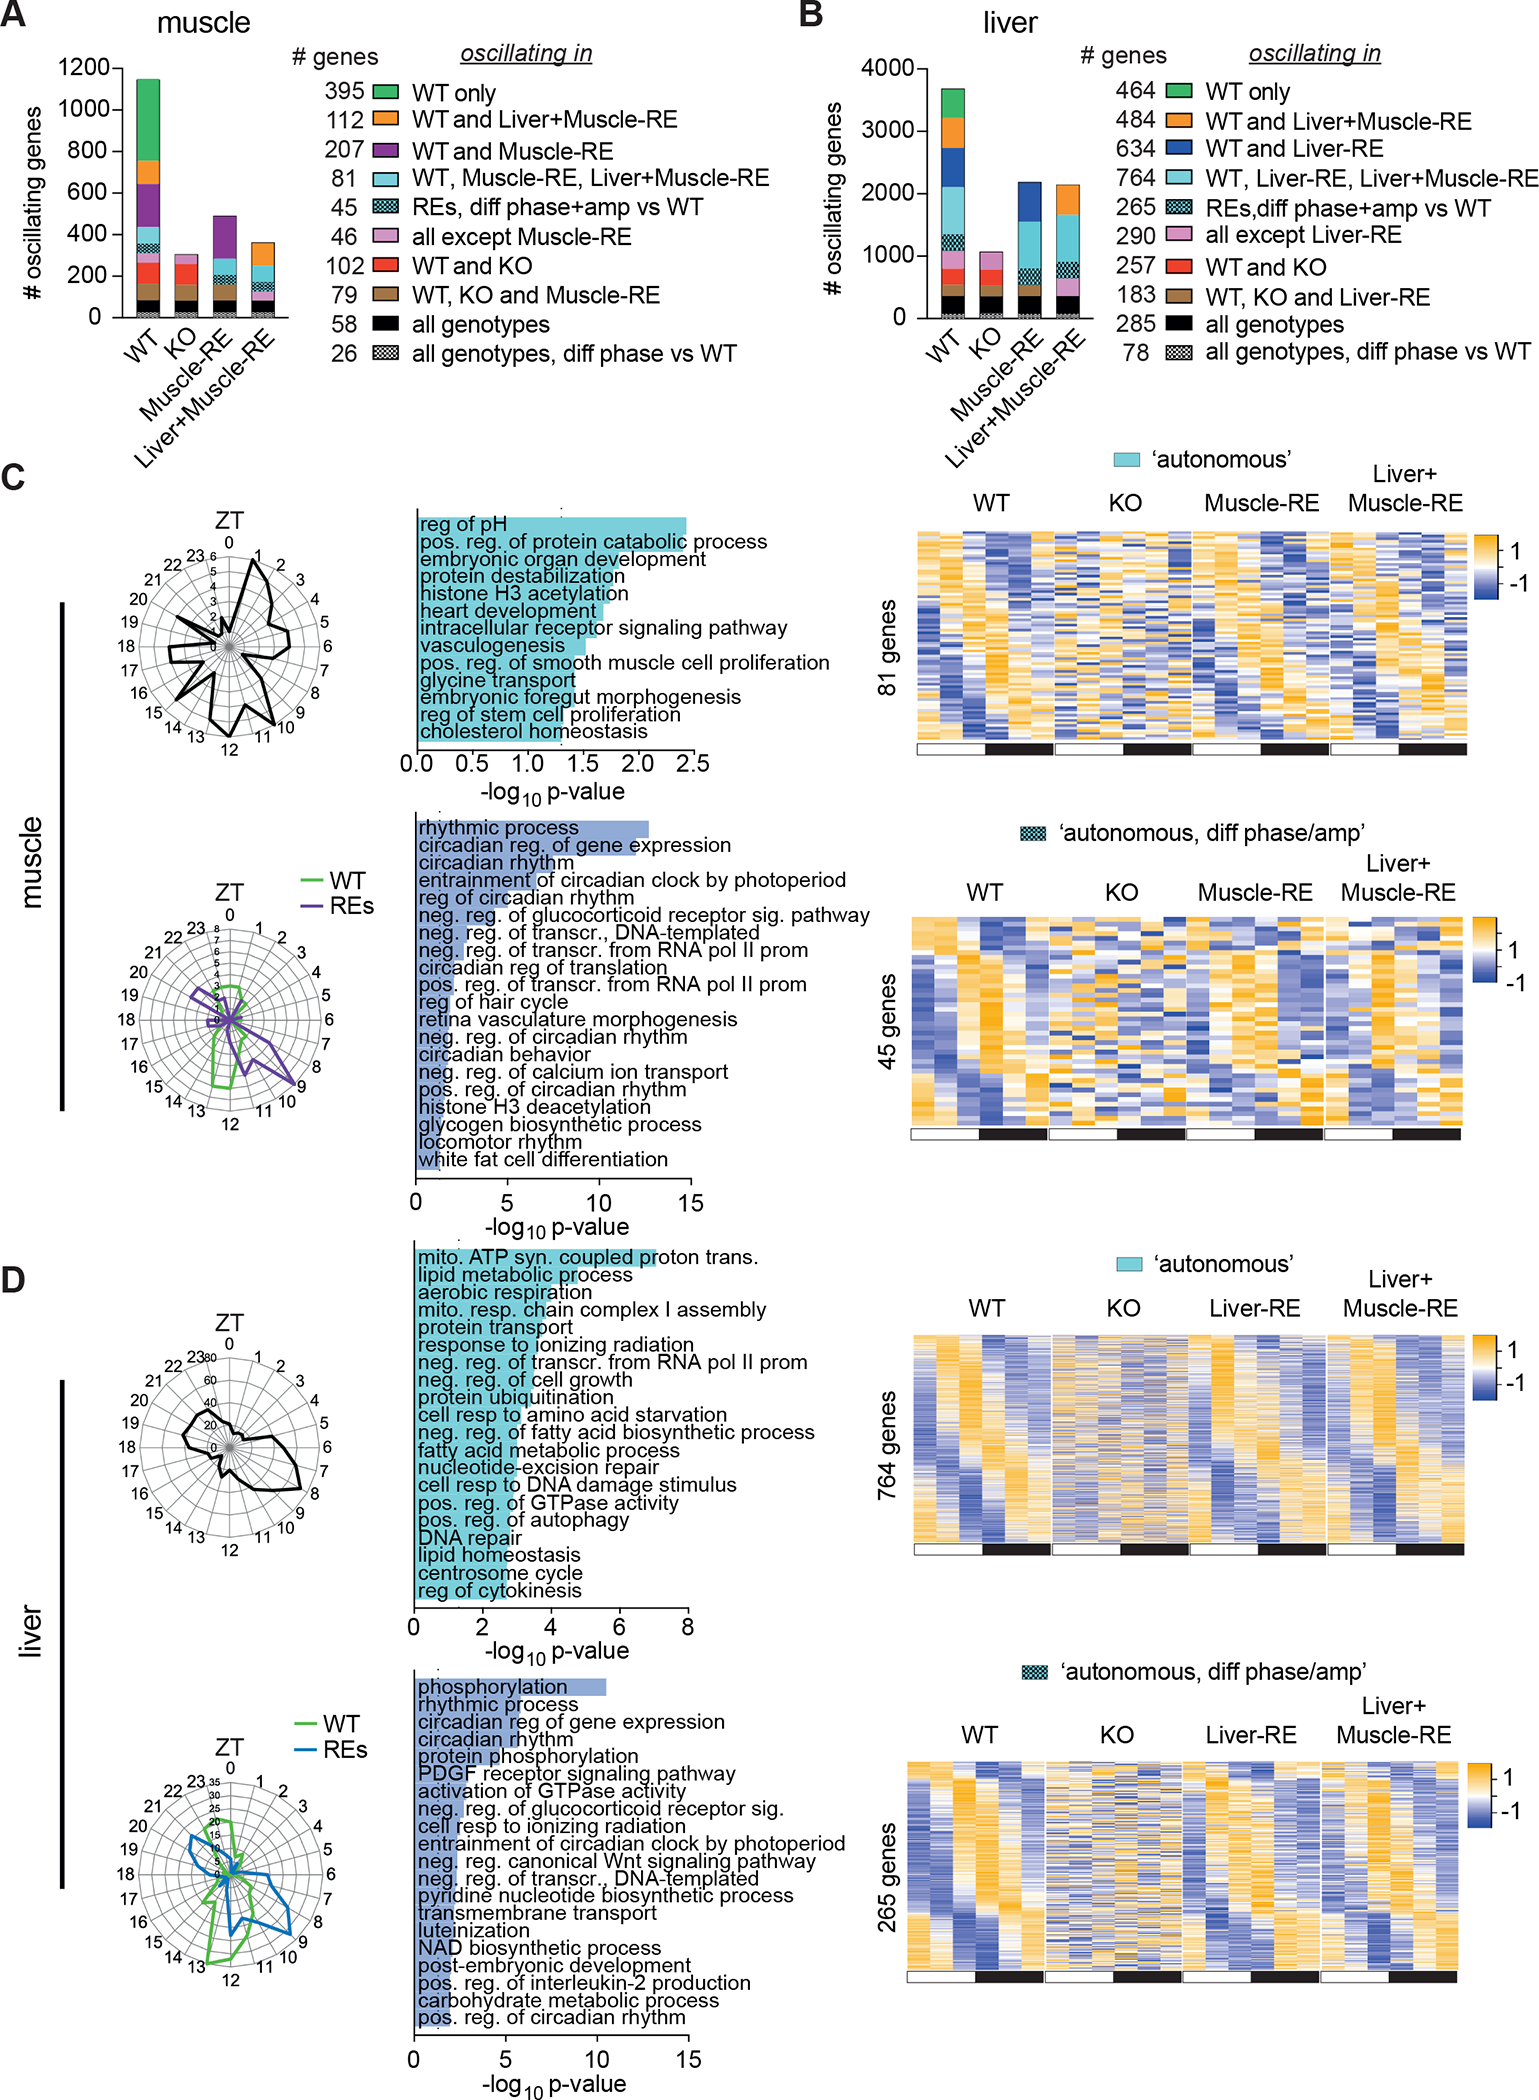
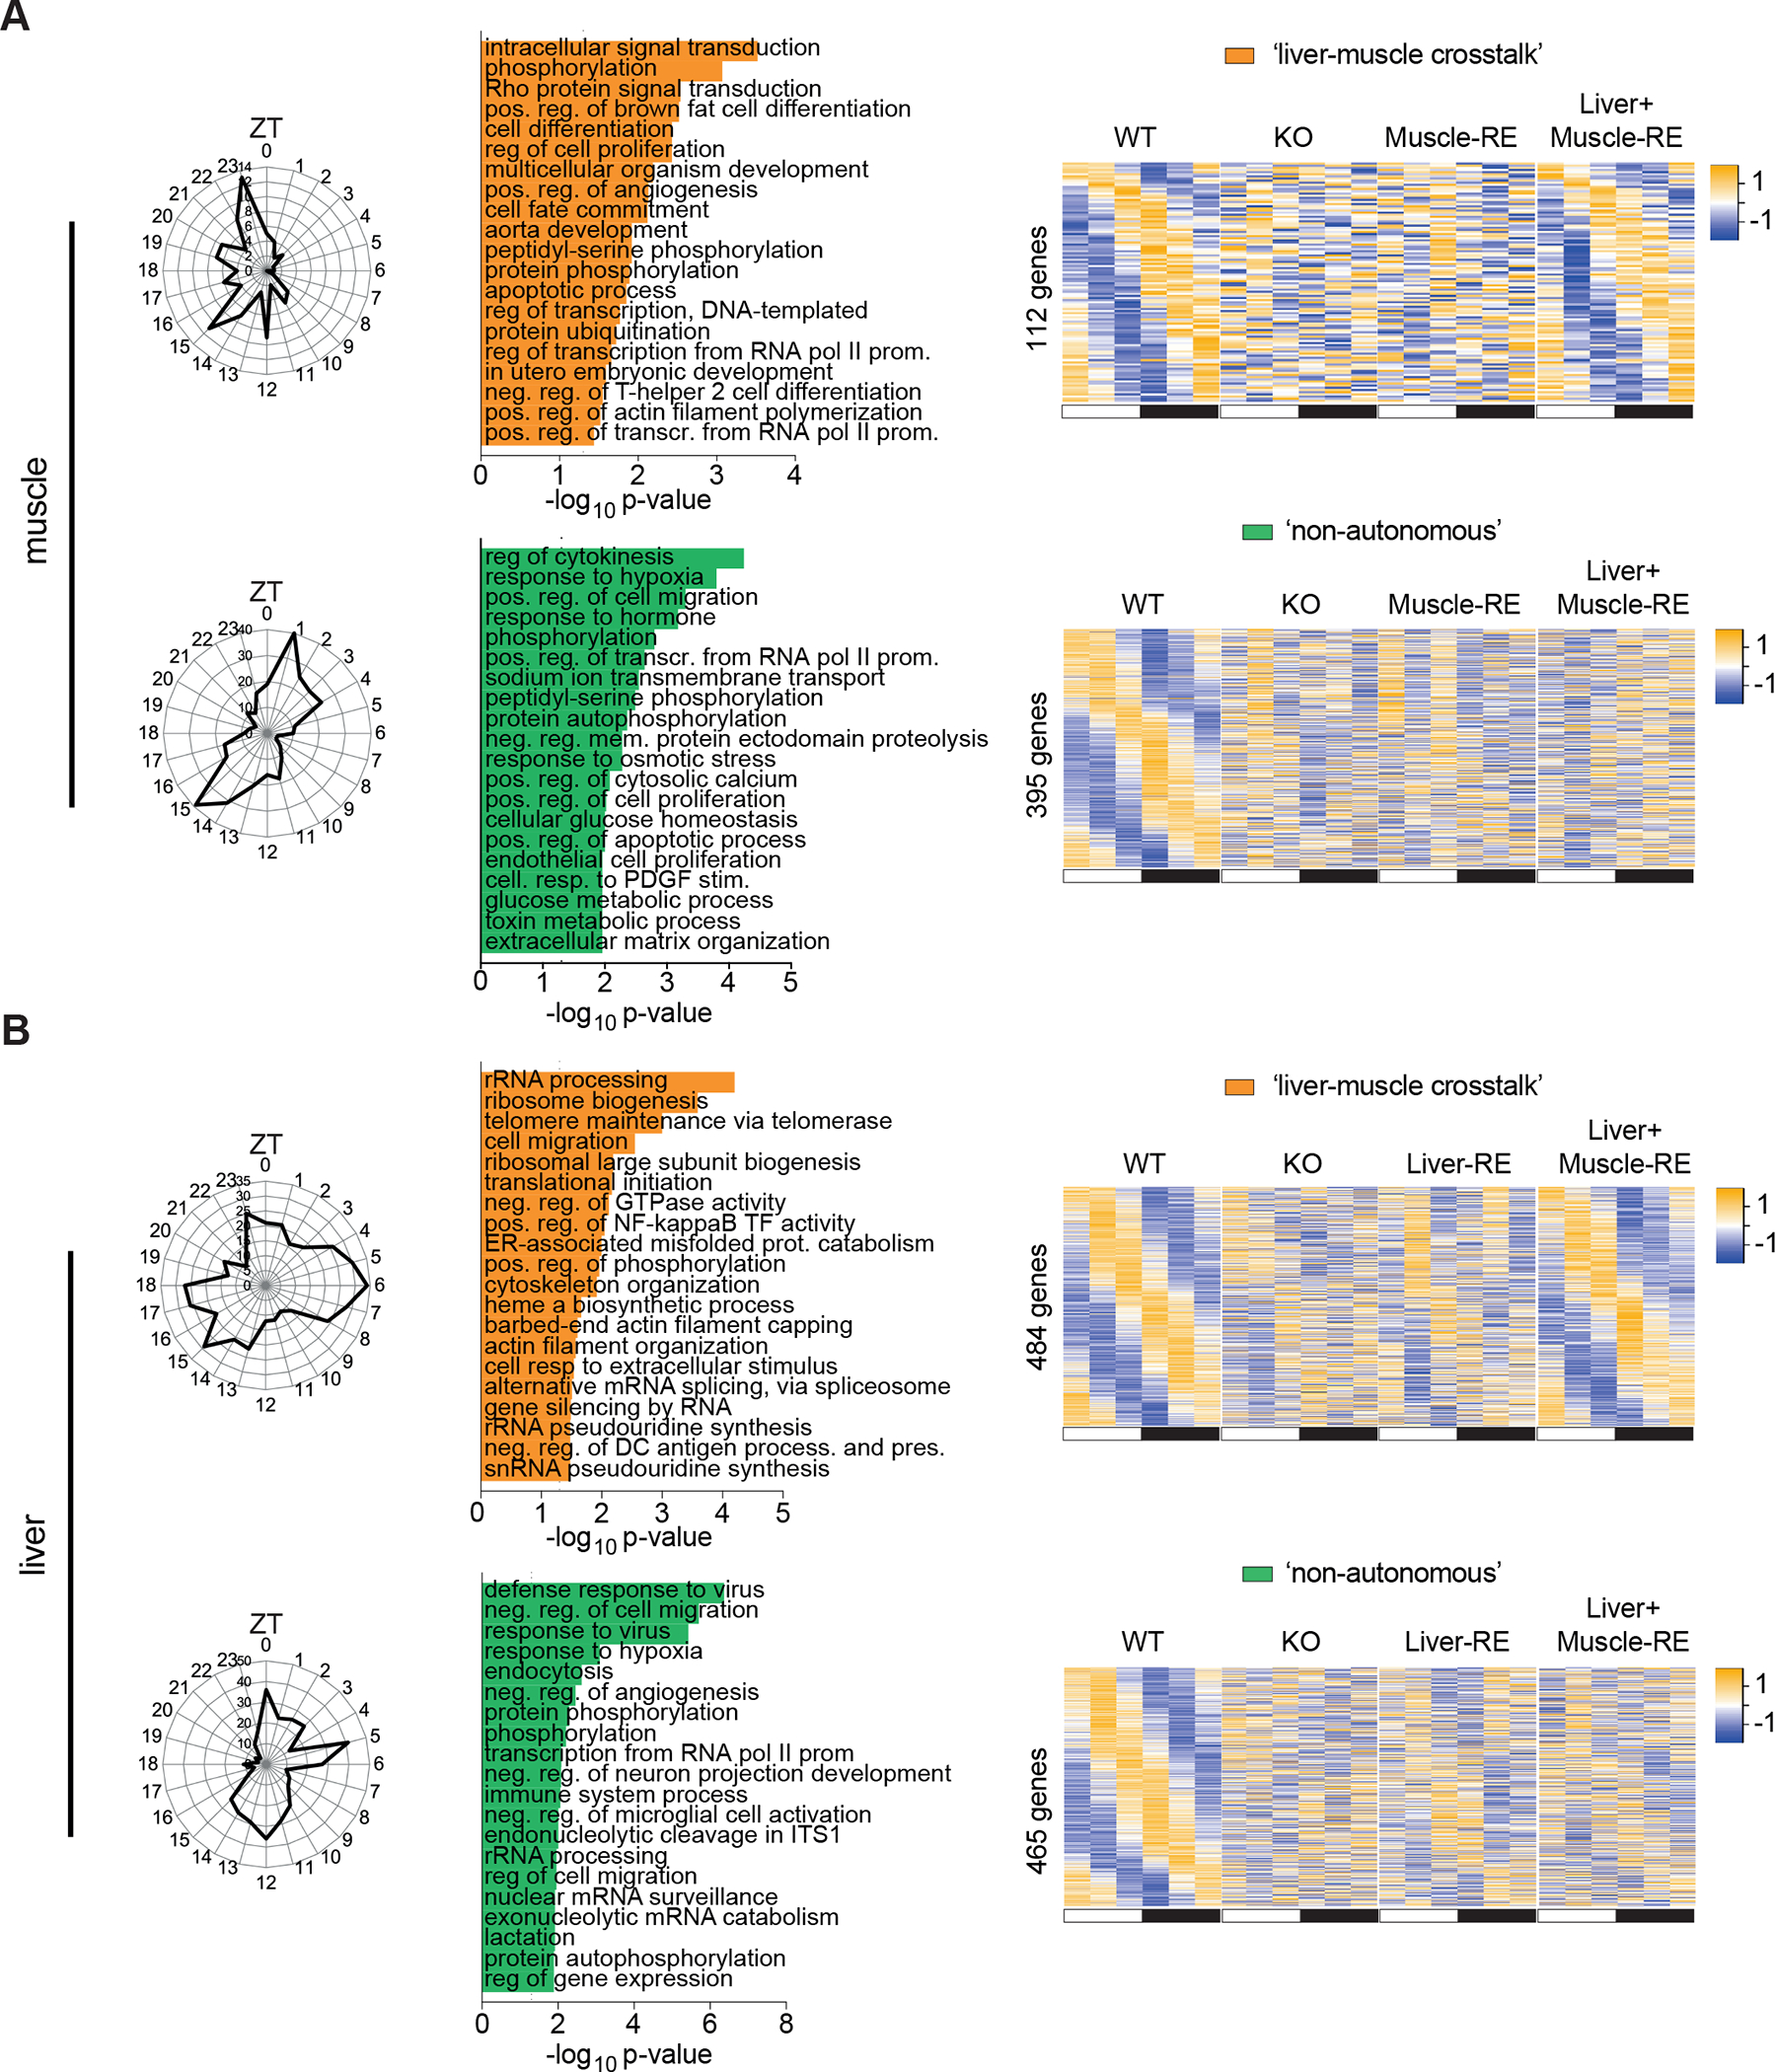
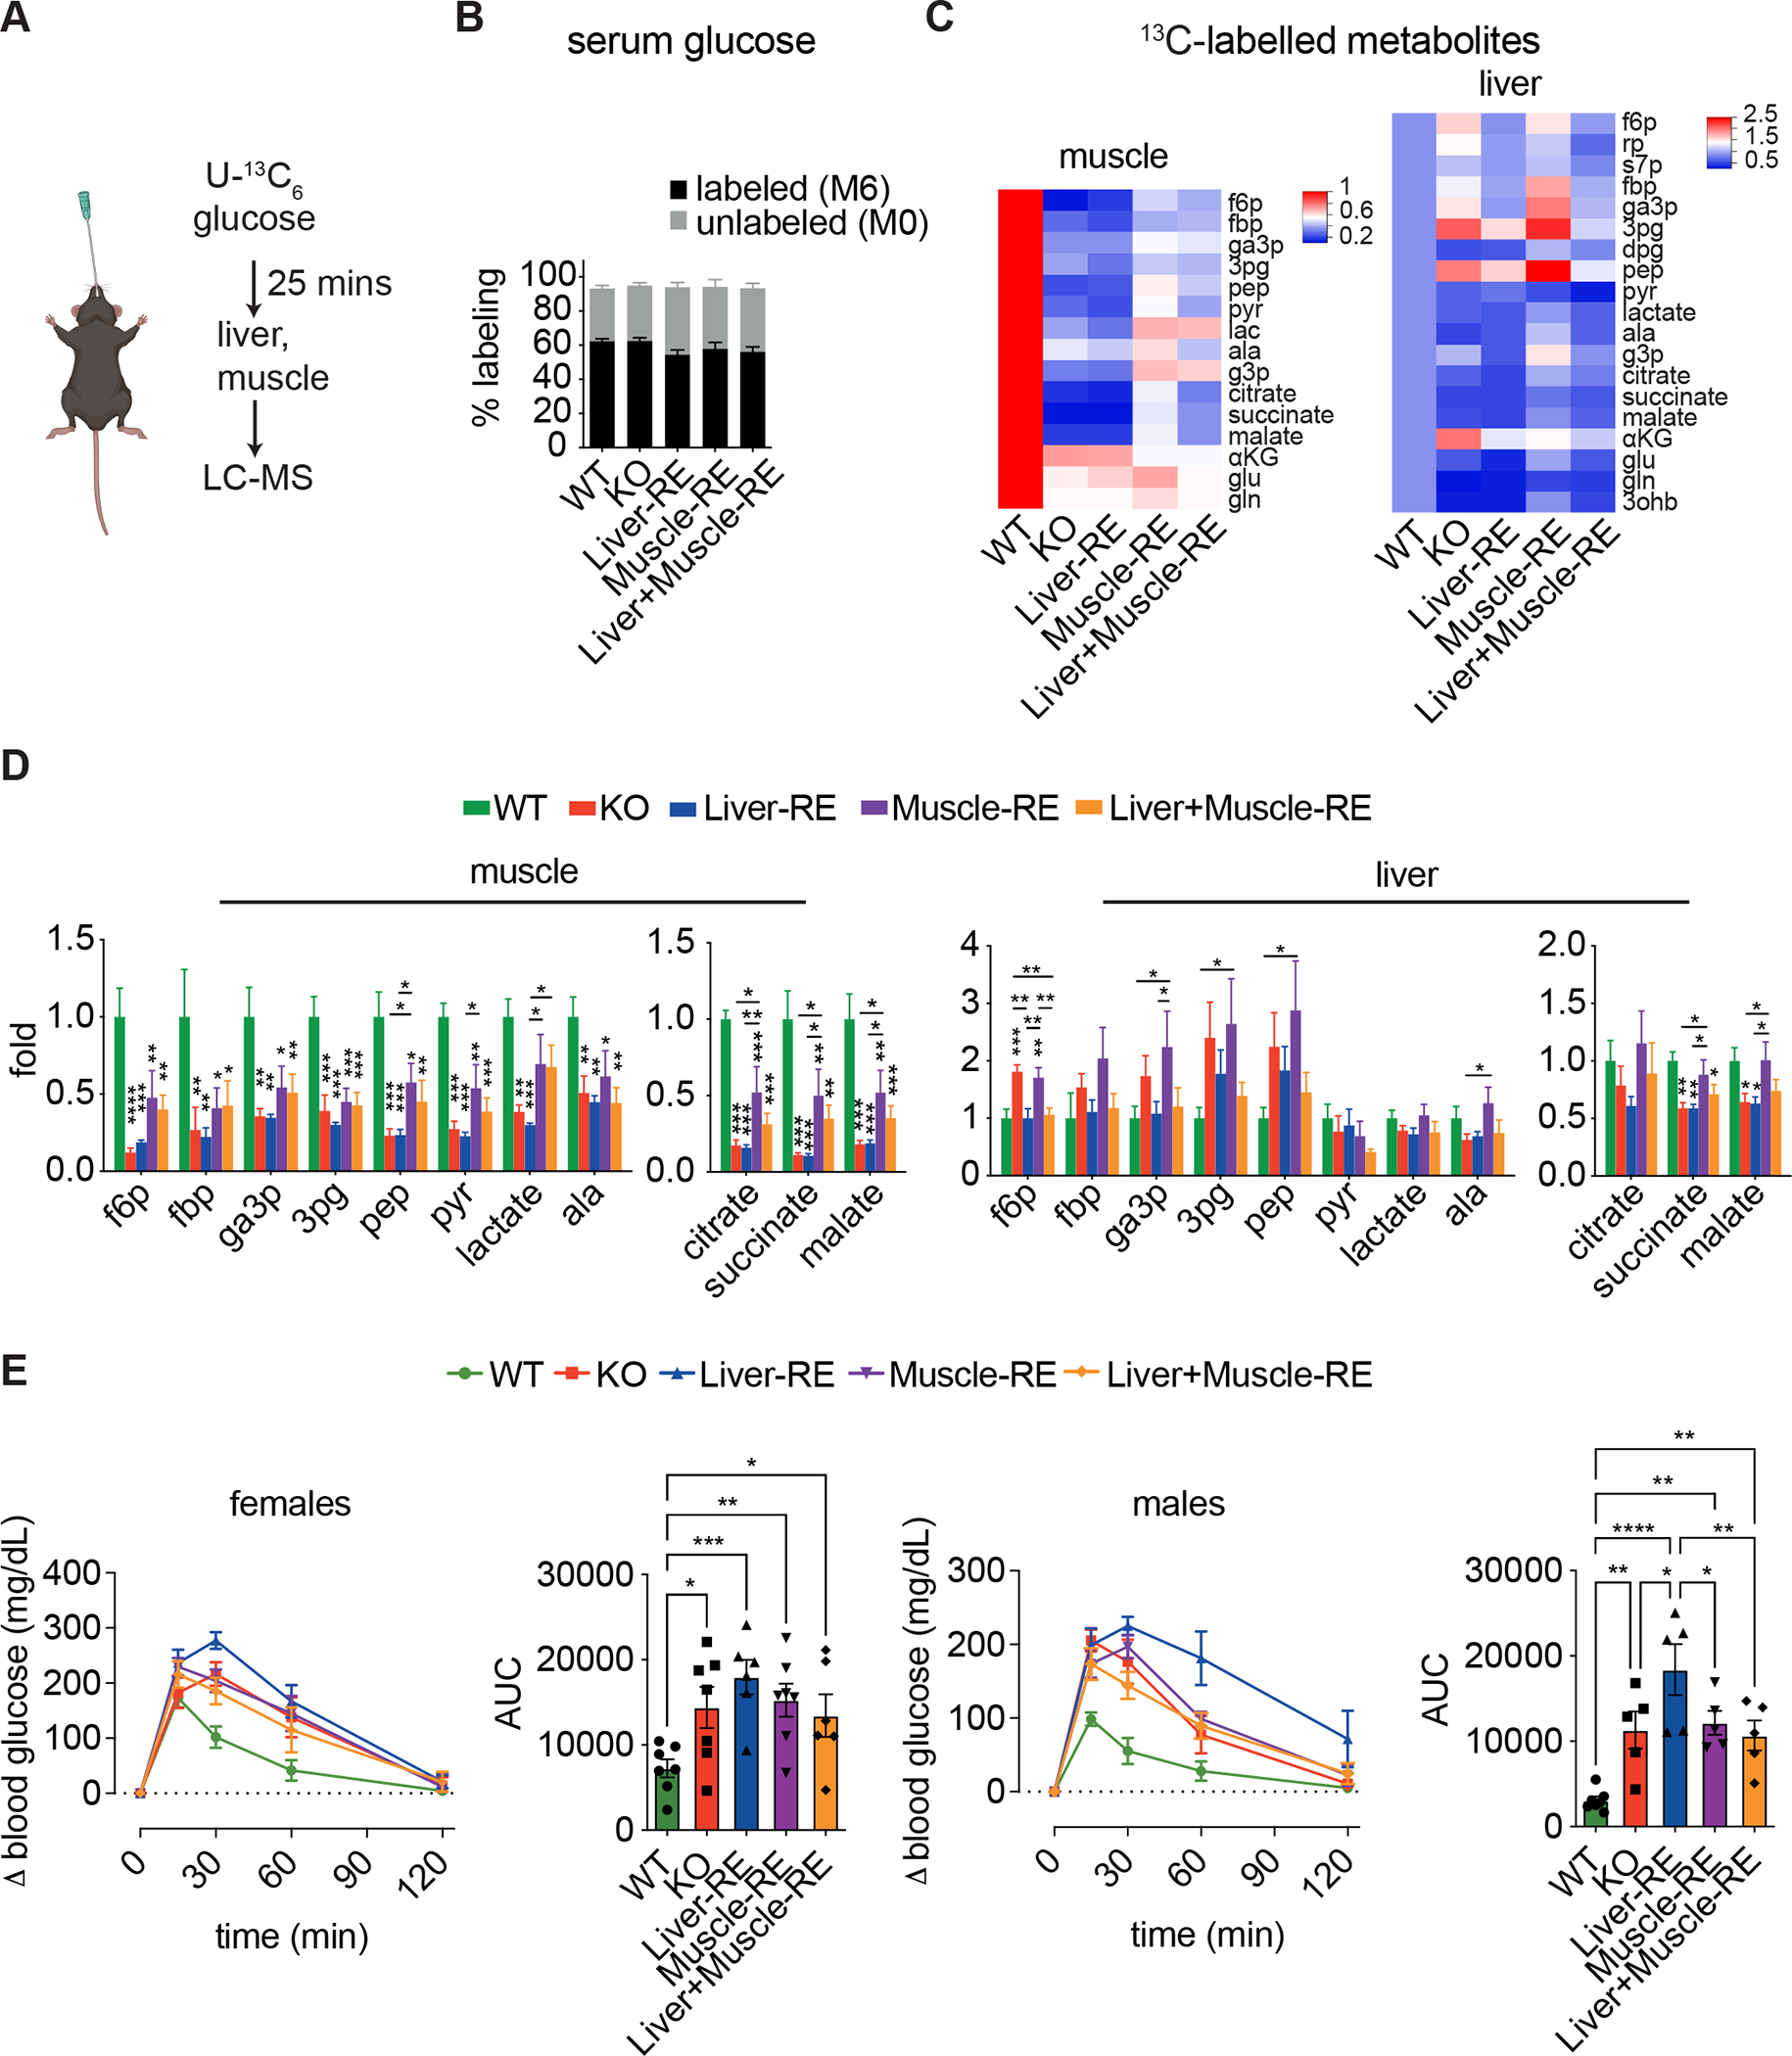
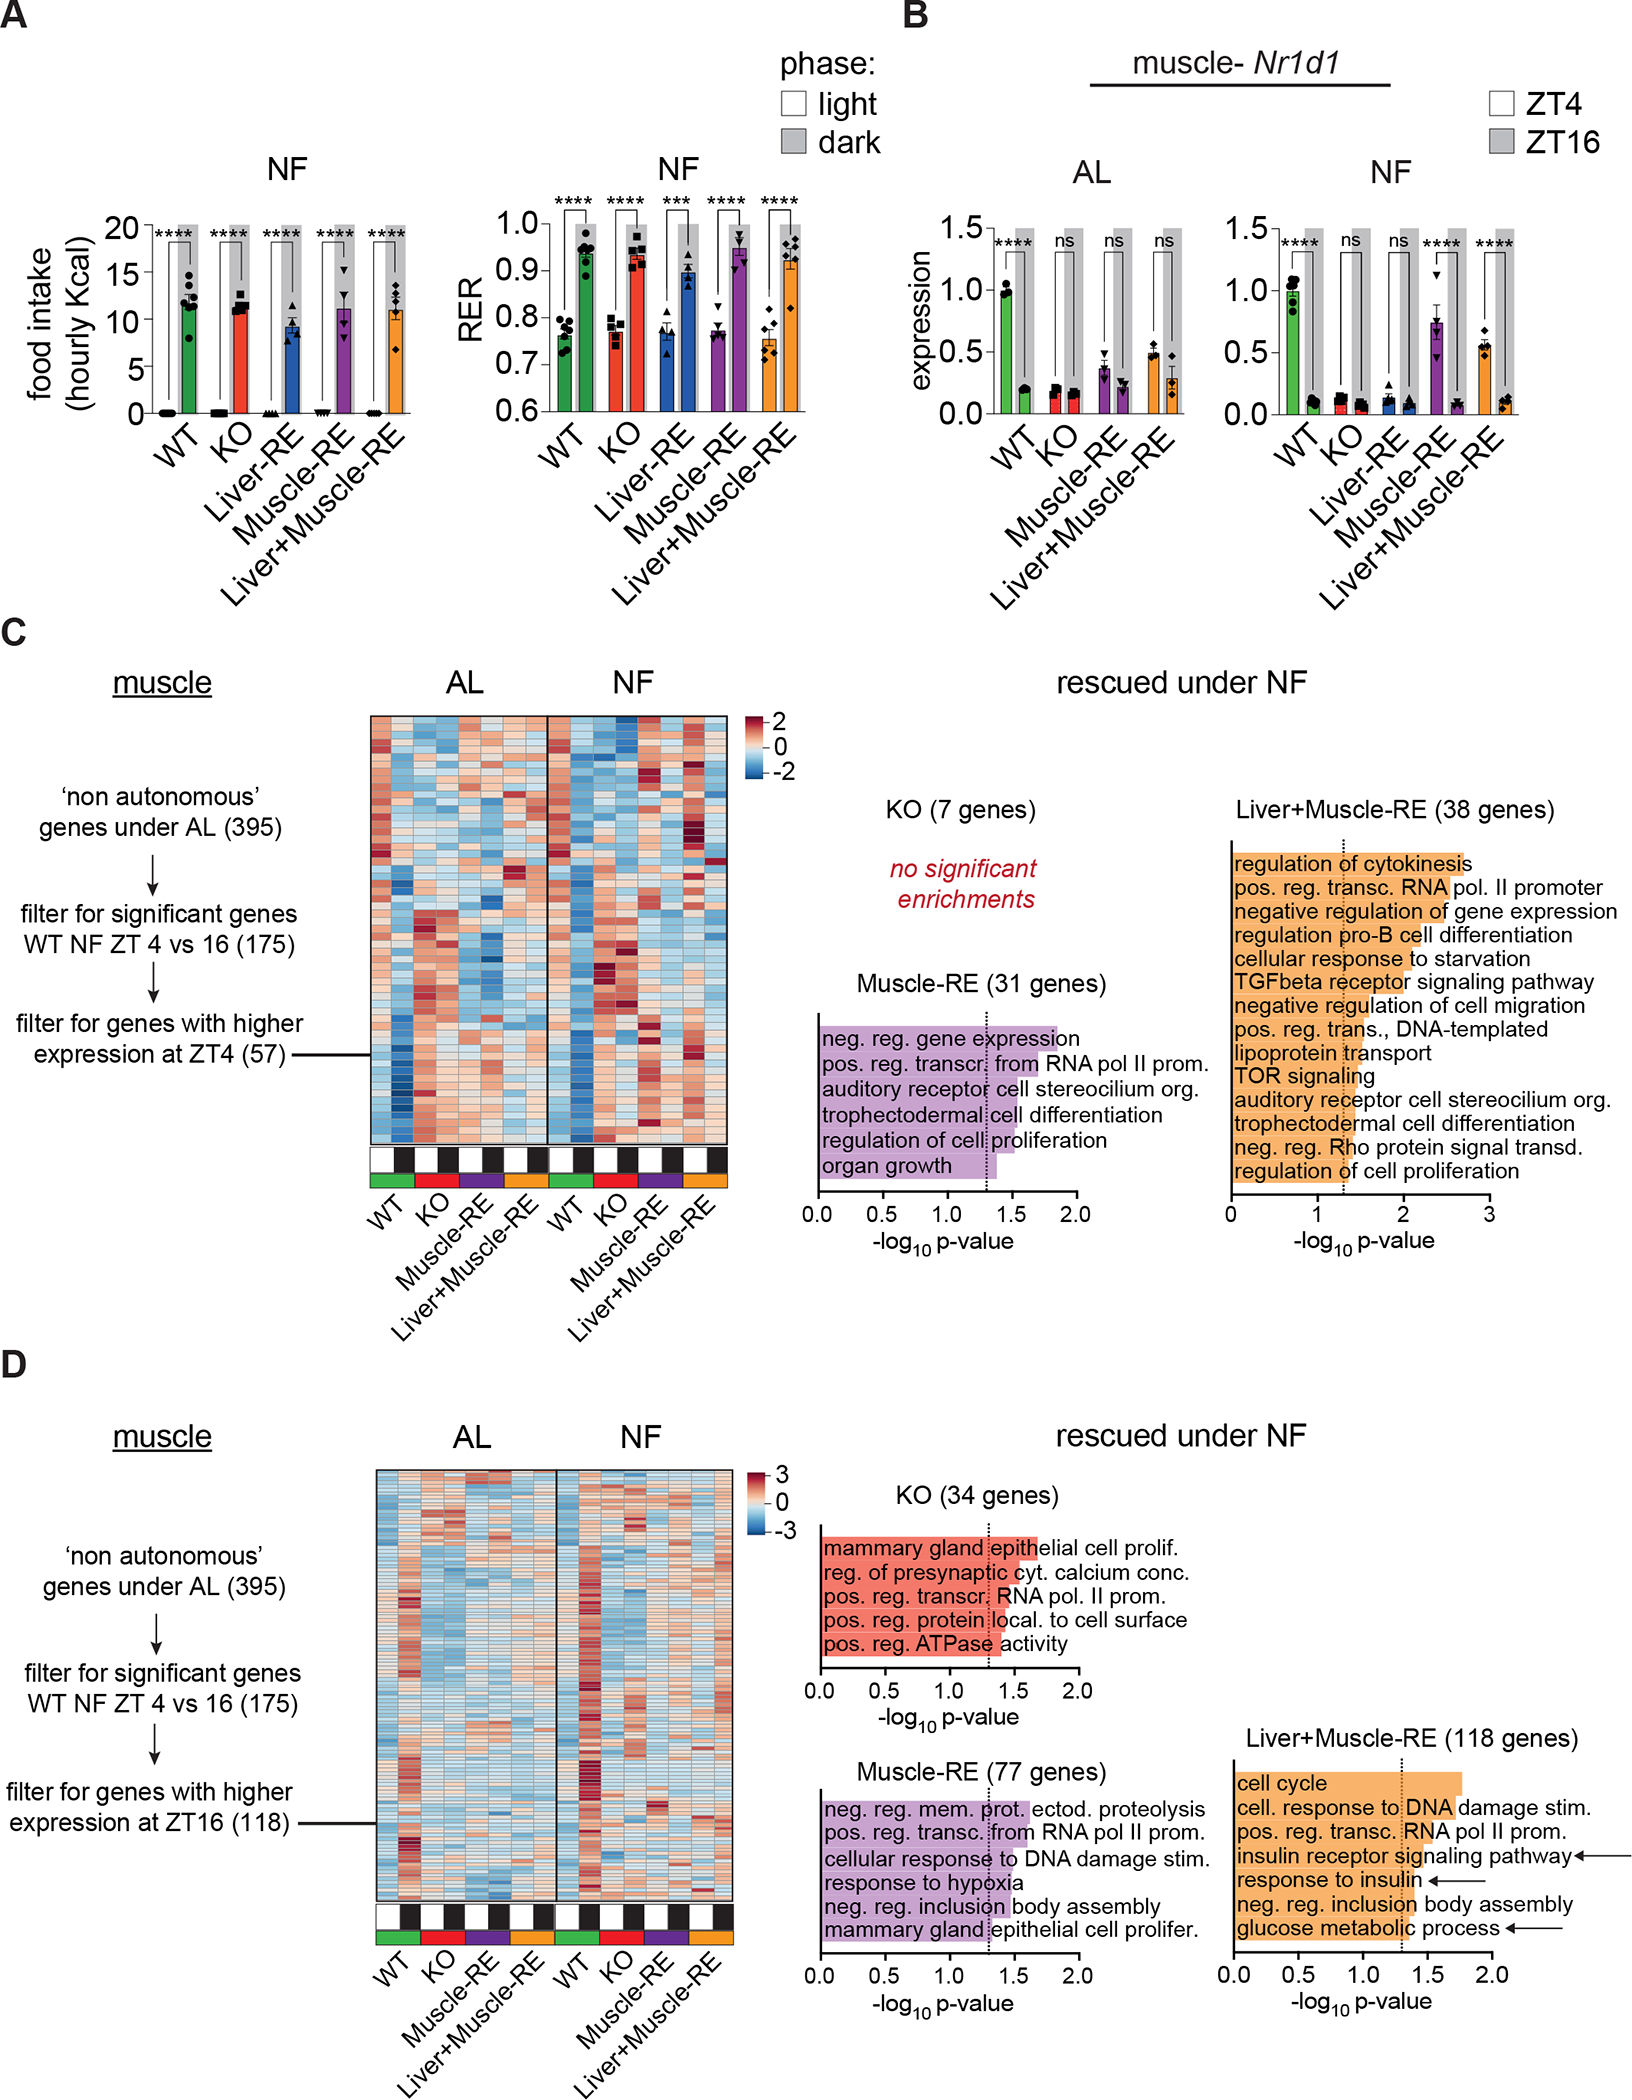
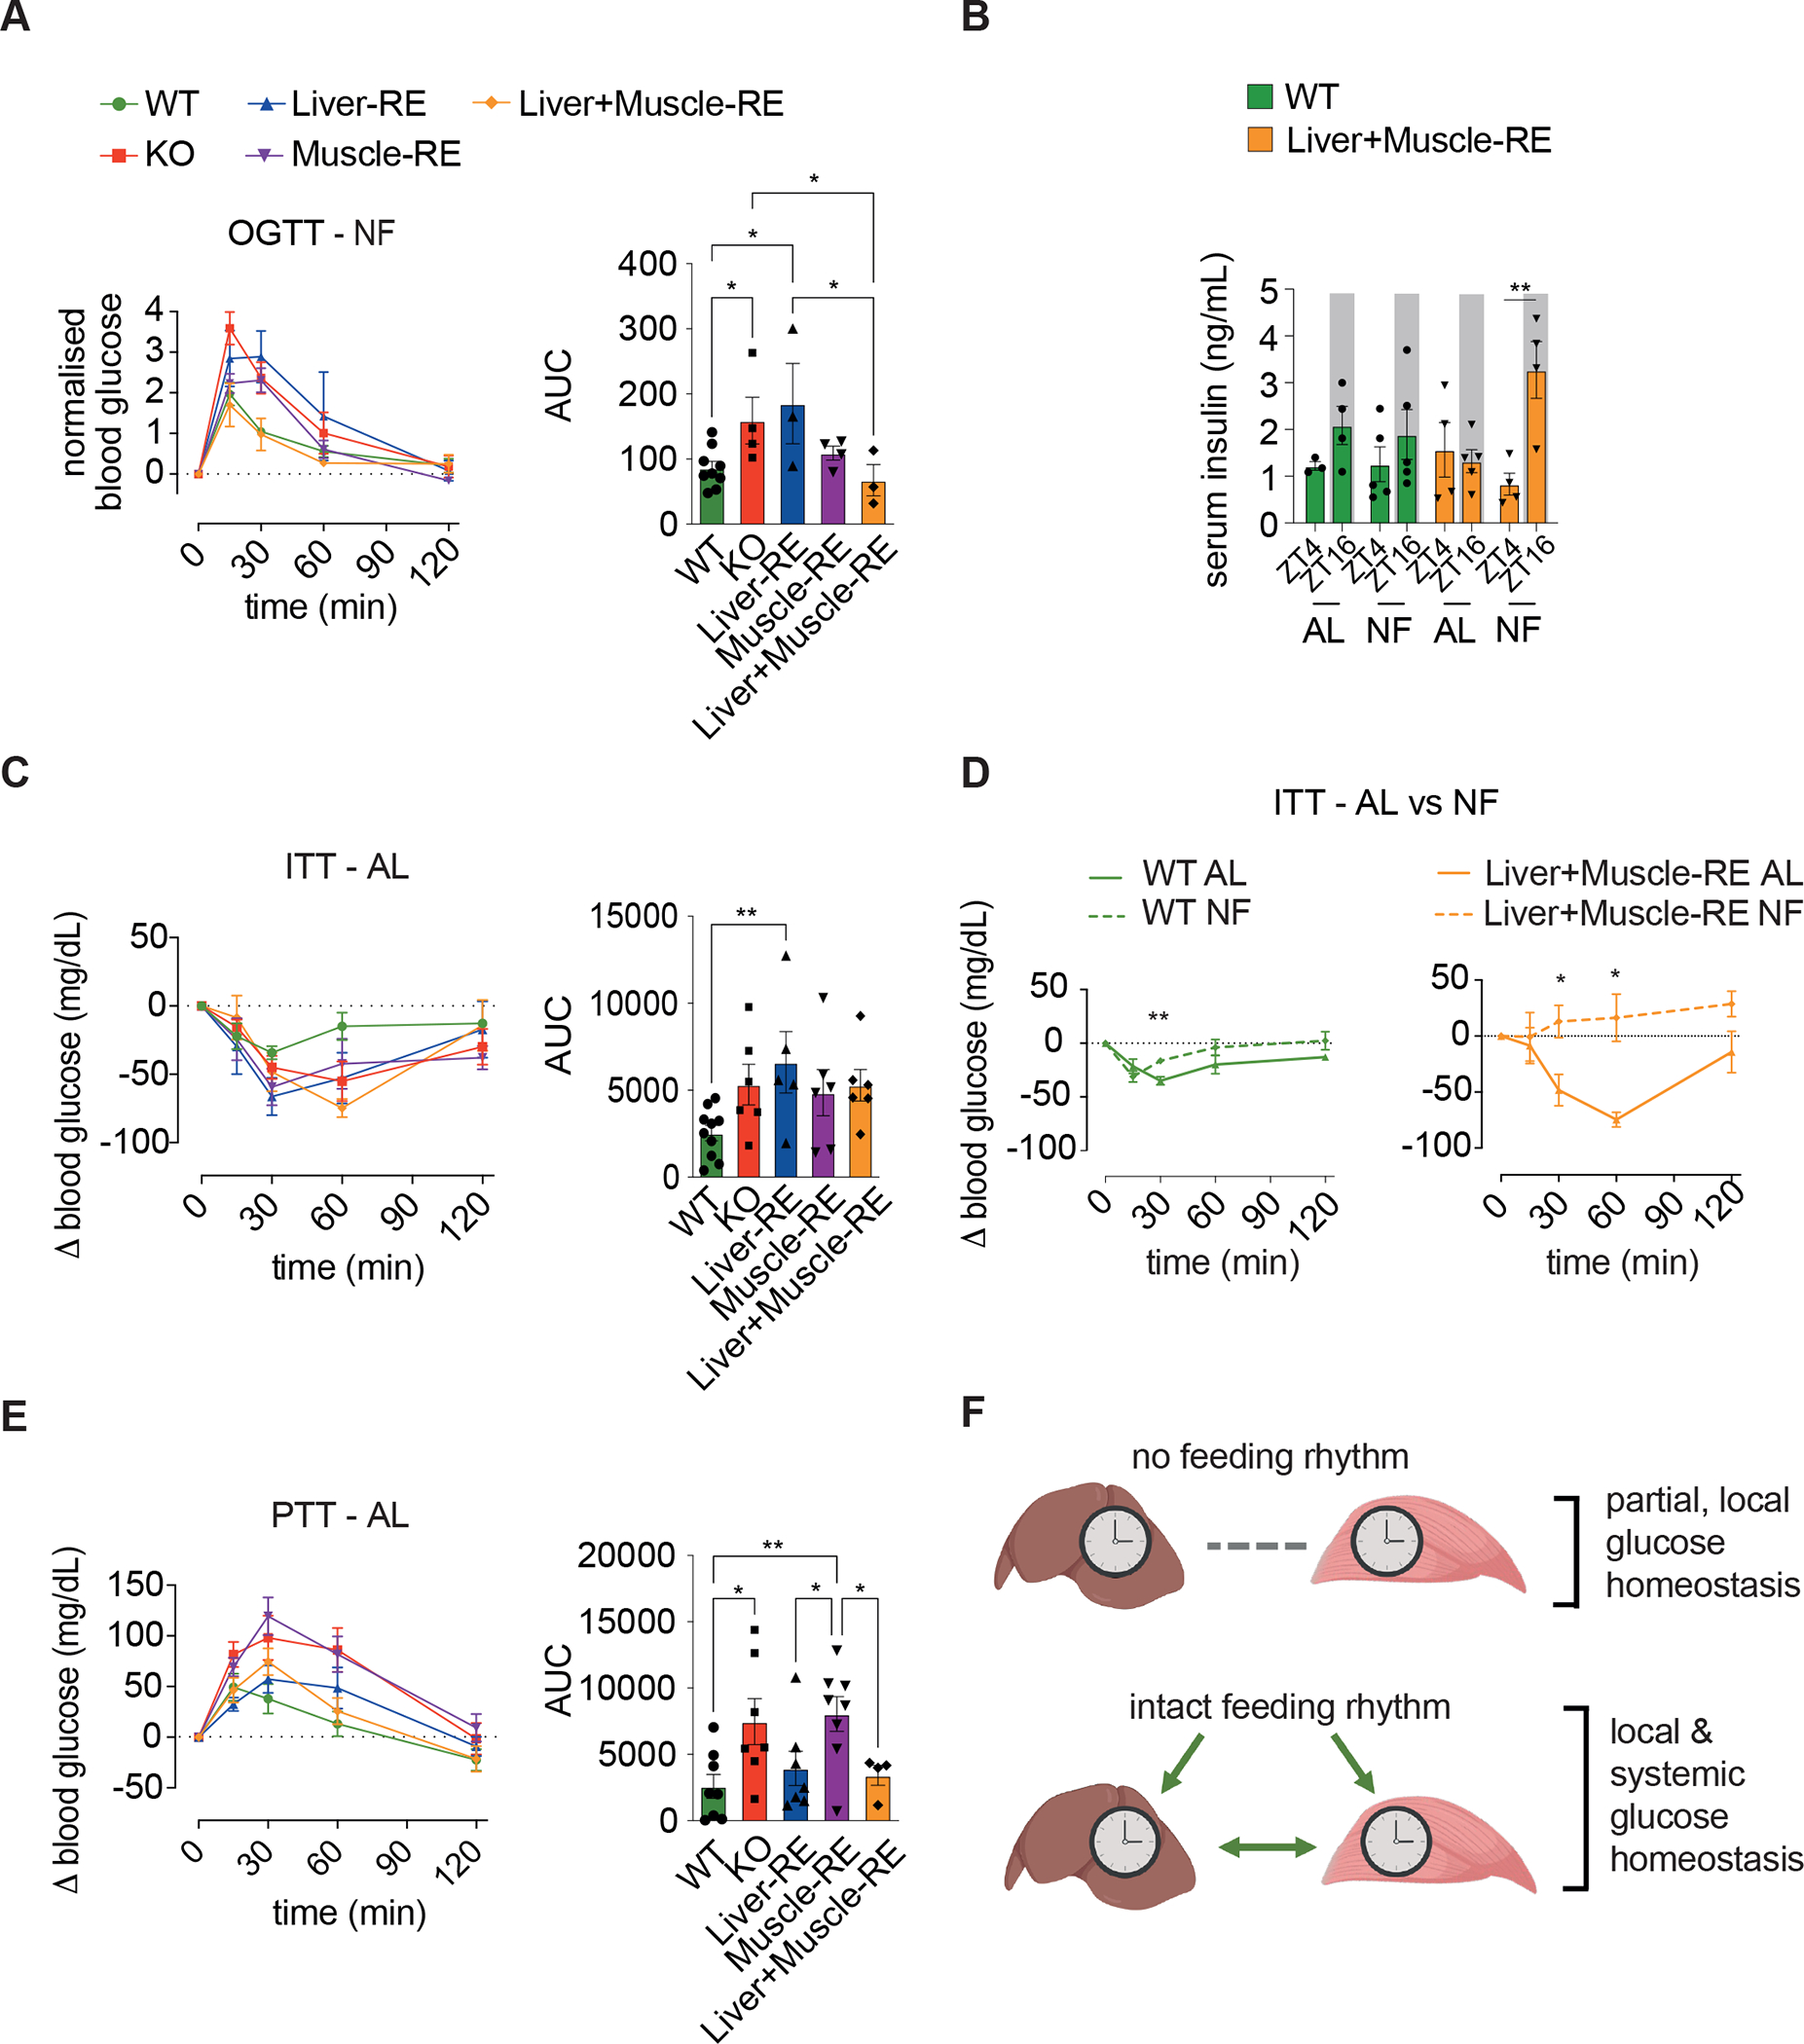
Physiology is regulated by interconnected cell and tissue circadian clocks. Disruption of the rhythms generated by the concerted activity of these clocks is associated with metabolic disease. Here we tested the interactions between clocks in two critical components of organismal metabolism, liver and skeletal muscle, by rescuing clock function either in each organ separately or in both organs simultaneously in otherwise clock-less mice. Experiments showed that individual clocks are partially sufficient for tissue glucose metabolism, yet the connections between both tissue clocks coupled to daily feeding rhythms support systemic glucose tolerance. This synergy relies in part on local transcriptional control of the glucose machinery, feeding-responsive signals such as insulin, and metabolic cycles that connect the muscle and liver. We posit that spatiotemporal mechanisms of muscle and liver play an essential role in the maintenance of systemic glucose homeostasis and that disrupting this diurnal coordination can contribute to metabolic disease.

Keywords: Bmal1; CP: Metabolism; autonomy; circadian rhythms; endocrinology; glucose; inter-organ crosstalk; liver; metabolism; muscle; systems biology.


Conflict of interest statement

Declaration of interests S.A.B. is a co-founder and scientific advisor of ONA Therapeutics.

Figures

Figure 1.
Figure 1.. Characterization of muscle or liver+muscle clock reconstituted mice.
(A) Genetic scheme for tissue-specific clock reconstitution. (B) Body weight, 8-week-old, n = 6–28 (WT-Alfp-Cre = 13; WT-Hsa-Cre = 4; WT-Alfp+Hsa-Cre = 10). One-way ANOVA, Fisher’s LSD post-hoc test, *p < 0.05, ****p < 0.0001. (C) Total daily food intake in average Kcals per h, n = 4–8 (WT-Alfp-Cre = 2; WT-Hsa-Cre = 1; WT-Alfp+Hsa-Cre = 5). One-way ANOVA, Fisher’s LSD post-hoc test, ns – not significant. (D) Fat-to-lean mass ratio. n = 4–16 (WT-Alfp-Cre = 4; WT-Hsa-Cre = 1; WT-Alfp+Hsa-Cre = 11). One-way ANOVA, Fisher’s LSD post-hoc test, **p < 0.01, ****p < 0.0001. (E) Left, light vs dark phase food intake, n = 5–7 (WT-Alfp-Cre = 2; WT-Hsa-Cre = 1; WT-Alfp+Hsa-Cre = 4). Right, light vs dark phase locomotor activity, n = 6–9 (WT-Alfp+Hsa-Cre = 8). Two-way ANOVA, Bonferroni post-hoc test, ****p < 0.0001. (F) Left, mean respiratory exchange ratio (RER), n = 5–7 (WT-Alfp-Cre = 2; WT-Hsa-Cre = 1; WT-Alfp+Hsa-Cre = 4). Right, average light vs dark phase RER. Two-way ANOVA, Bonferroni post-hoc test, ***p < 0.001. Data are presented as mean ± SEM. See also Figure S1. Figure 1A created using Biorender.com.
Figure 2.
Figure 2.. Liver and muscle core clocks oscillate in an independent manner.
(A–D) RNA-seq of gastrocnemius muscle and liver harvested around the clock, 12 h light/12 h dark conditions, n = 3. ZT, zeitgeber time; ZT0, lights on; ZT12, lights off. No mature Bmal1 mRNA or protein was detected in KO mice. See also Figure S1. (A, C) Oscillatory behavior of clock genes as captured by dryR. (B, D) Relative expression of clock genes normalized to WT ZT0. Data are presented as mean ± SEM. See also Figure S2 and Tables S1 and S2.
Figure 3.
Figure 3.. Local clocks in muscle and liver drive distinct autonomous outputs.
(A–D) RNA-seq of gastrocnemius muscle and liver harvested around the clock, 12 h light/12 h dark conditions, n = 3. ZT, zeitgeber time; ZT0, lights on; ZT12, lights off. (A, B) Top 10 dryR models. (C and D) Oscillating genes in muscle (C) and liver (D) by dryR. Left, polar histogram, peak phases. Middle, DAVID biological process enrichments, some pathway names abbreviated. Right, heatmaps of group averages sorted by WT peak phase. Top, autonomously oscillating genes. Bottom, autonomously oscillating genes with difference phase and amplitude in RE mice. See also Figure S3 and Tables S1 and S2.
Figure 4.
Figure 4.. Liver and muscle diurnal transcriptomes are influenced by Bmal1 function in distal tissues.
(A and B) dryR analysis of RNA-seq of gastrocnemius muscle (A) and liver (B) harvested around the clock, 12 h light: 12 h dark conditions, n = 3. ZT, zeitgeber time; ZT0, lights on; ZT12, lights off. Left, polar histogram, peak phases. Middle, DAVID biological process enrichments, some pathway names abbreviated. Right, heatmaps of group averages sorted by WT peak phase. Top, genes oscillating exclusively in WT and Liver+Muscle-RE. Bottom, genes oscillating exclusively in WT. See also Figures 3, S3, and S4, and Tables S1 and S2.
Figure 5.
Figure 5.. Liver and muscle clocks are partially sufficient for control of glucose metabolism at the tissue but not systemic level.
(A) Experimental design of isotope tracing, n = 5–6 (WT-Alfp-Cre = 2; WT-Hsa-Cre = 2; WT-Alfp+Hsa-Cre = 2). Data are 13C-labeled ion counts relative to WT. (B) Labeling of circulating glucose. (C) Heatmaps of downstream 13C metabolites. 3ohb, 3-hydroxybutyrate; 3pg, 3-phosphoglycerate; aKG, alpha-ketoglutarate; ala, alanine; dpg, 2,3 diphosphoglycerate; f6p, fructose 6-phosphate; fbp, fructose 1,6-bisphosphate; g3p, glycerol 3-phosphate; ga3p, glyceraldehyde 3-phosphate; glu, glutamate; gln, glutamine; lac, lactate; pep, phosphoenolpyruvate; pyr, pyruvate; rp, ribose phosphate; s7p, sedoheptulose 7-phosphate. (D) Labelling of glycolysis and TCA cycle metabolites. One-way ANOVA, Fisher’s LSD post-hoc test, *p < 0.05, **p < 0.01, ***p < 0.001, ****p < 0.0001. (E) Oral glucose tolerance tests in female (left, n=6–7) and male (right, n=5–7) mice. WTs = WT-Alfp+Hsa-Cre. Bar graph area under the curve (AUC) – one-way ANOVA, Fisher’s LSD post-hoc test, *p < 0.05, **p < 0.01, ***p < 0.001, ns = not significant. Data are presented as mean ± SEM. See also Figure S5. Figure 5A created using Biorender.com.
Figure 6.
Figure 6.. Feeding rhythms and autonomous clocks bolster time-dependent gene expression in liver and muscle.
(A) Left, light vs dark phase food intake under night feeding (NF) conditions. n = 4–7 (WT-Alfp-Cre = 2; WT-Hsa-Cre = 1; WT-Alfp+Hsa-Cre = 4). Two-way ANOVA, Bonferroni’s post-hoc test, ****p < 0.0001. Right, average light and dark phase respiratory exchange ratio (RER), n = 5–7 (WT-Alfp-Cre = 2; WT-Hsa-Cre = 1; WT-Alfp+Hsa-Cre = 4). Two-way ANOVA, Bonferroni’s post-hoc test, ***p < 0.001. (B) RNA-seq data from ad libitum (AL) and NF mice at ZT4 and ZT16, n = 3–6. For NF, WT-Alfp-Cre = 2; WT-Hsa-Cre = 2; WT-Alfp+Hsa-Cre = 2. Two-way ANOVA, Bonferroni’s post-hoc test, **p < 0.01, ****p < 0.0001. ns – not significant. (C and D) Left, heatmaps of AL non-autonomously oscillating genes peaking at ZT4 (C) or ZT16 (D), DEseq2 FDR <0.05. Right, DAVID biological process enrichment for genes not significantly different vs WT at either time point (i.e., rescued by NF) (DE-seq2 FDR <0.05), some pathway names abbreviated. Arrows = glucose related pathways. Data are presented as mean ± SEM. See also Figures S6–12.
Figure 7.
Figure 7.. Synergy between feeding rhythms and liver and muscle clocks enables systemic glucose homeostasis.
(A) Oral glucose tolerance test (OGTT) under night feeding (NF), n = 3–9 (WT-Alfp-Cre = 1; WT-Hsa-Cre = 3; WT-Alfp+Hsa-Cre = 4). Bar graph area under the curve (AUC) – one-way ANOVA, Fisher’s LSD post-hoc test, *p < 0.05, **p < 0.01, ***p < 0.001. (B) Serum insulin levels under ad libitum (AL) or NF conditions, n = 4–5 (WTs = WT-Alfp+Hsa-Cre). Two-way ANOVA, Bonferroni post-hoc test, **p < 0.01. (C) Insulin tolerance test (ITT) under AL conditions, n = 5–10 (WT-Alfp+Hsa-Cre = 7; WT-Hsa-Cre = 3). Bar graph AUC negative peaks – one-way ANOVA, Fisher’s LSD post-hoc test, **p < 0.01. (D) Insulin tolerance test as in (C) vs NF conditions, NF n = 3–6 (WT-Alfp-Cre = 1; WT-Hsa-Cre = 3; WT-Alfp+Hsa-Cre = 2). Two-way repeated measures ANOVA, Fisher’s LSD post-hoc test. *p < 0.05, **p < 0.01. (E) Pyruvate tolerance test (PTT) under AL conditions, n = 4–8 (WT = WT-Alfp+Hsa-Cre). Bar graph area under the curve – one-way ANOVA, Fisher’s LSD post-hoc test, *p < 0.05, **p < 0.01. (F) Model of central findings. Data are presented as mean ± SEM. See also Figure S13. Figure 7F created using Biorender.com.

References

    1. Rosbash M (2009). The implications of multiple circadian clock origins. PLoS Biol 7, e62. 10.1371/journal.pbio.1000062. - DOI - PMC - PubMed
    1. Bass J, and Lazar MA (2016). Circadian time signatures of fitness and disease. Science 354, 994–999. 10.1126/science.aah4965. - DOI - PubMed
    1. Guan D, and Lazar MA (2021). Interconnections between circadian clocks and metabolism. J Clin Invest 131. 10.1172/JCI148278. - DOI - PMC - PubMed
    1. Cederroth CR, Albrecht U, Bass J, Brown SA, Dyhrfjeld-Johnsen J, Gachon F, Green CB, Hastings MH, Helfrich-Forster C, Hogenesch JB, et al. (2019). Medicine in the Fourth Dimension. Cell Metab 30, 238–250. 10.1016/j.cmet.2019.06.019. - DOI - PMC - PubMed
    1. Fishbein AB, Knutson KL, and Zee PC (2021). Circadian disruption and human health. J Clin Invest 131. 10.1172/JCI148286. - DOI - PMC - PubMed

Publication types